ADX Dashboard
- Indikatoren
- Taras Slobodyanik
- Version: 3.70
- Aktualisiert: 6 Mai 2024
- Aktivierungen: 10
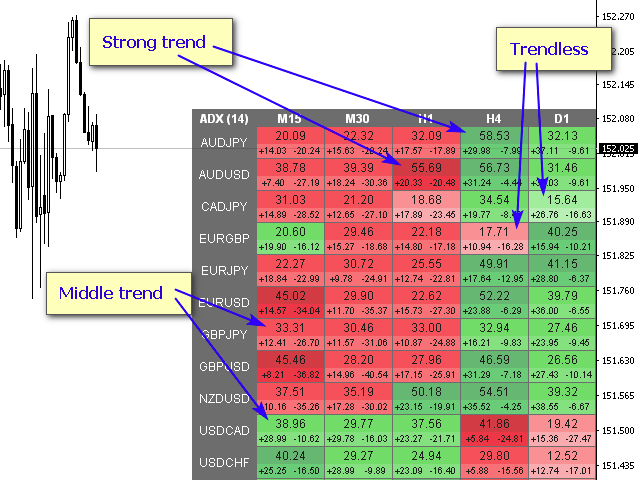
Der ADX-Indikator wird verwendet, um den Trend und seine Stärke zu bestimmen. Die Richtung des Preises wird durch die Werte +DI und -DI angezeigt, und der ADX-Wert zeigt die Stärke des Trends. Wenn +DI über -DI liegt, befindet sich der Markt in einem Aufwärtstrend, wenn nicht, ist es ein Abwärtstrend. Wenn ADX unter 20 liegt, gibt es keine eindeutige Richtung. Sobald der Indikator dieses Niveau durchbricht, beginnt ein Trend mittlerer Stärke. Werte über 40 zeigen einen starken Trend an (einen Abwärts- oder Aufwärtstrend).
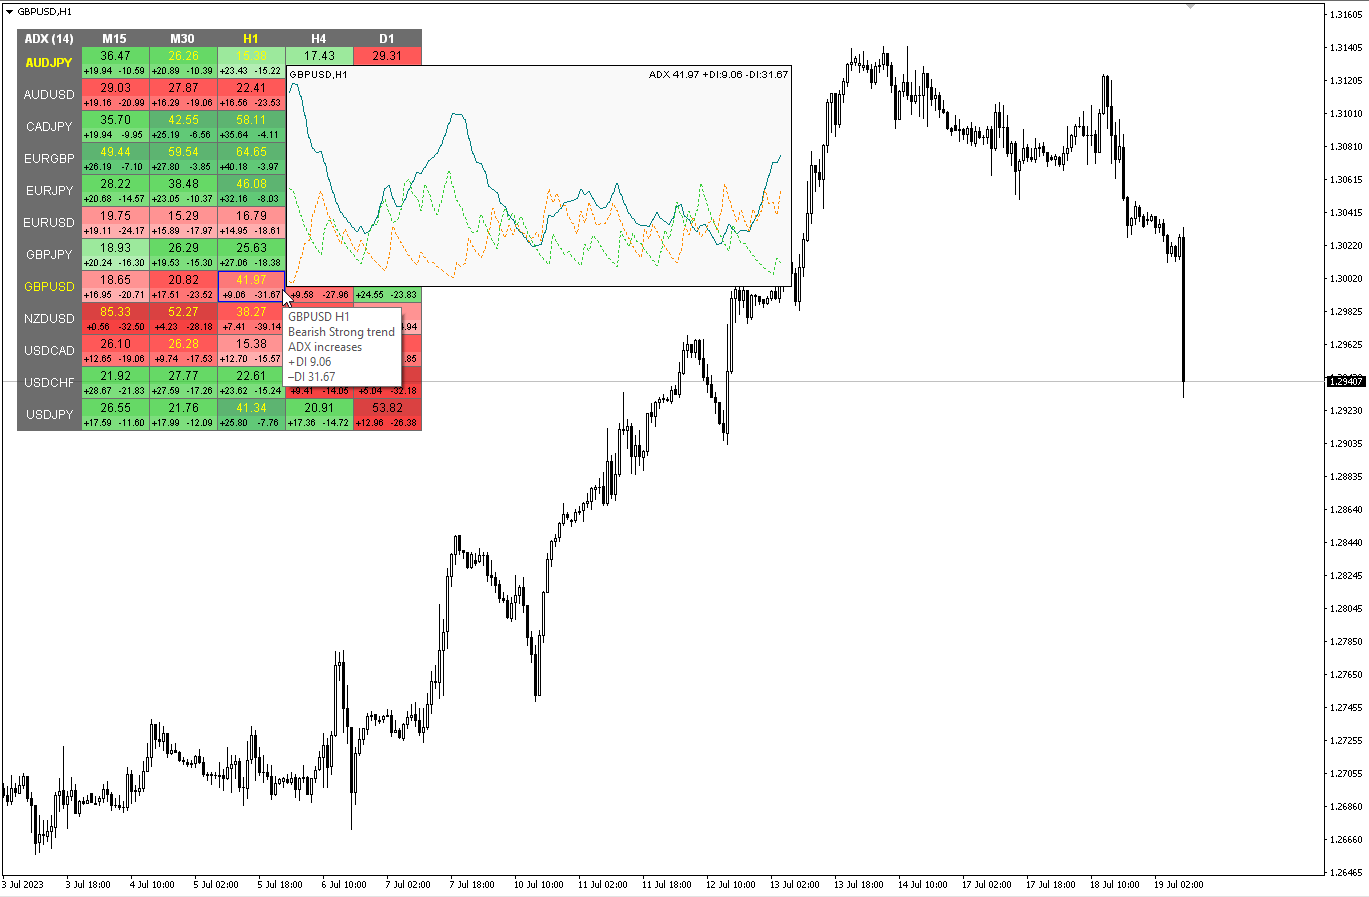
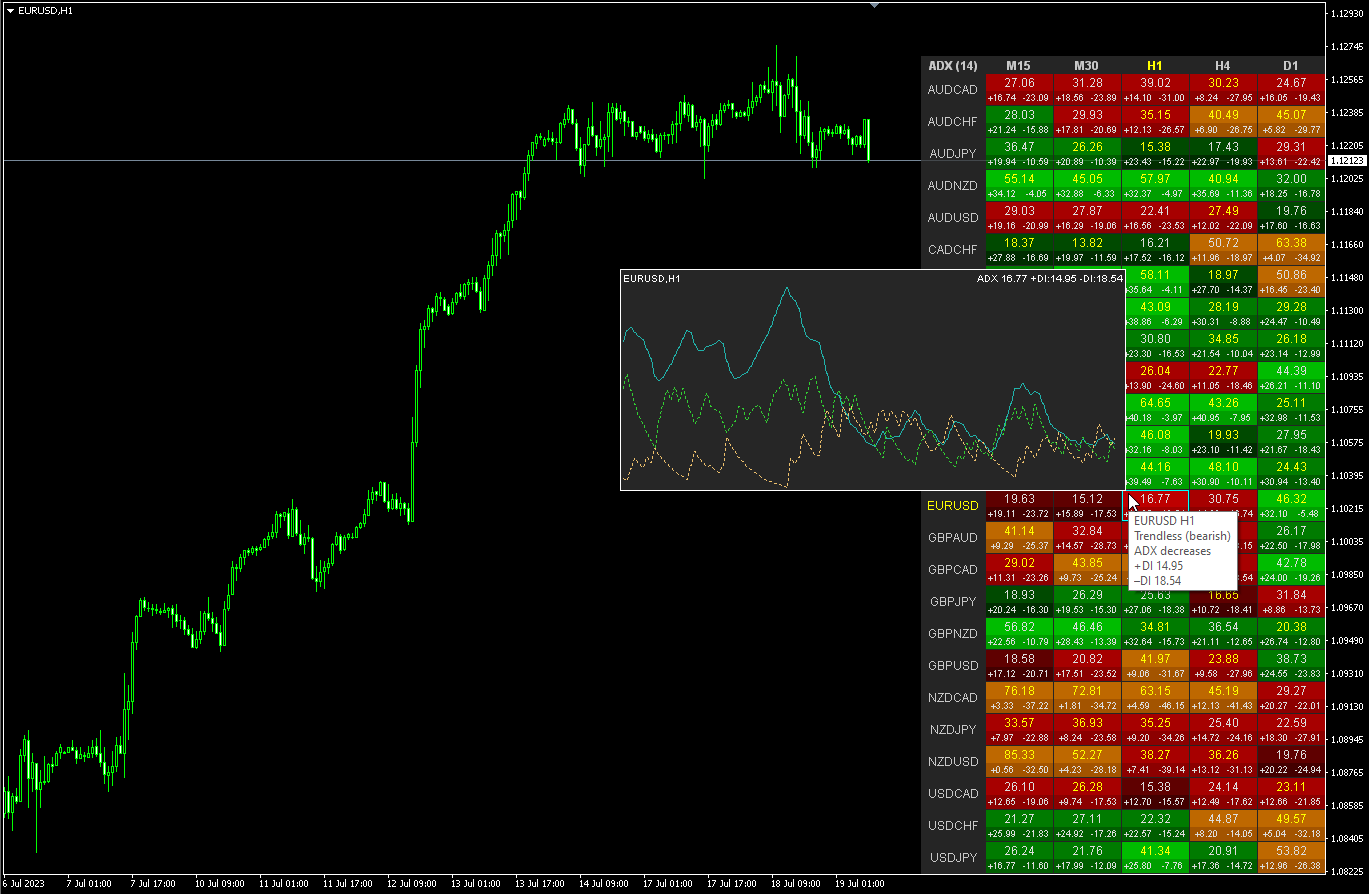
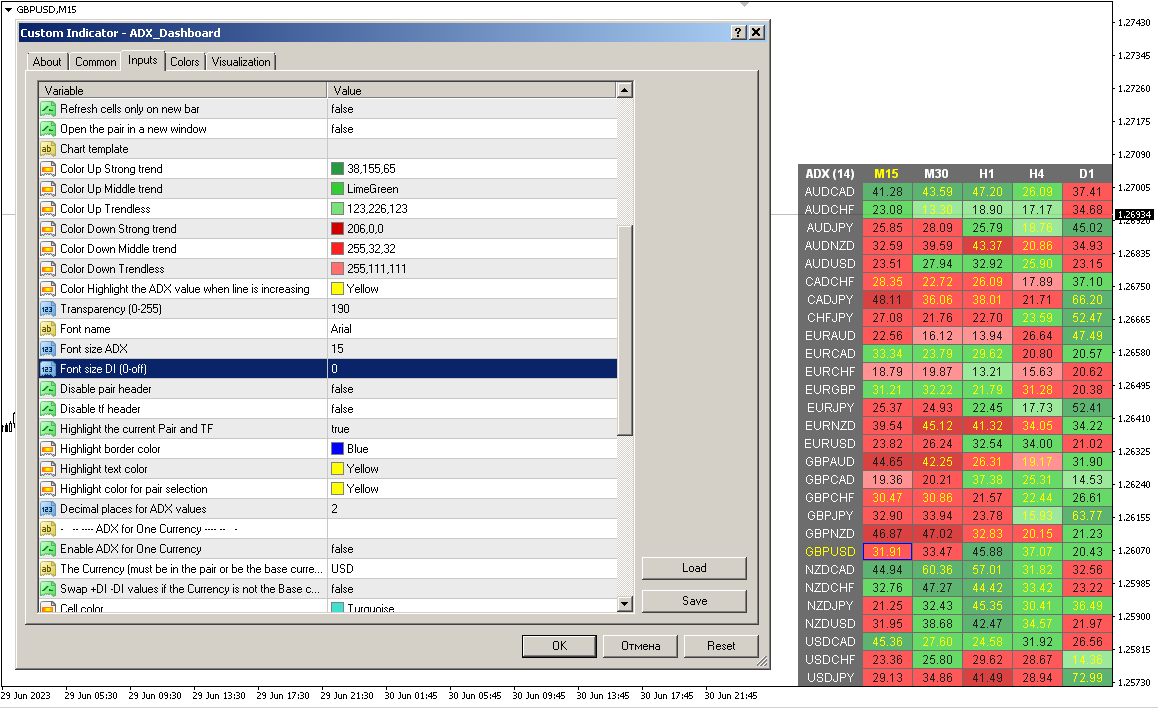
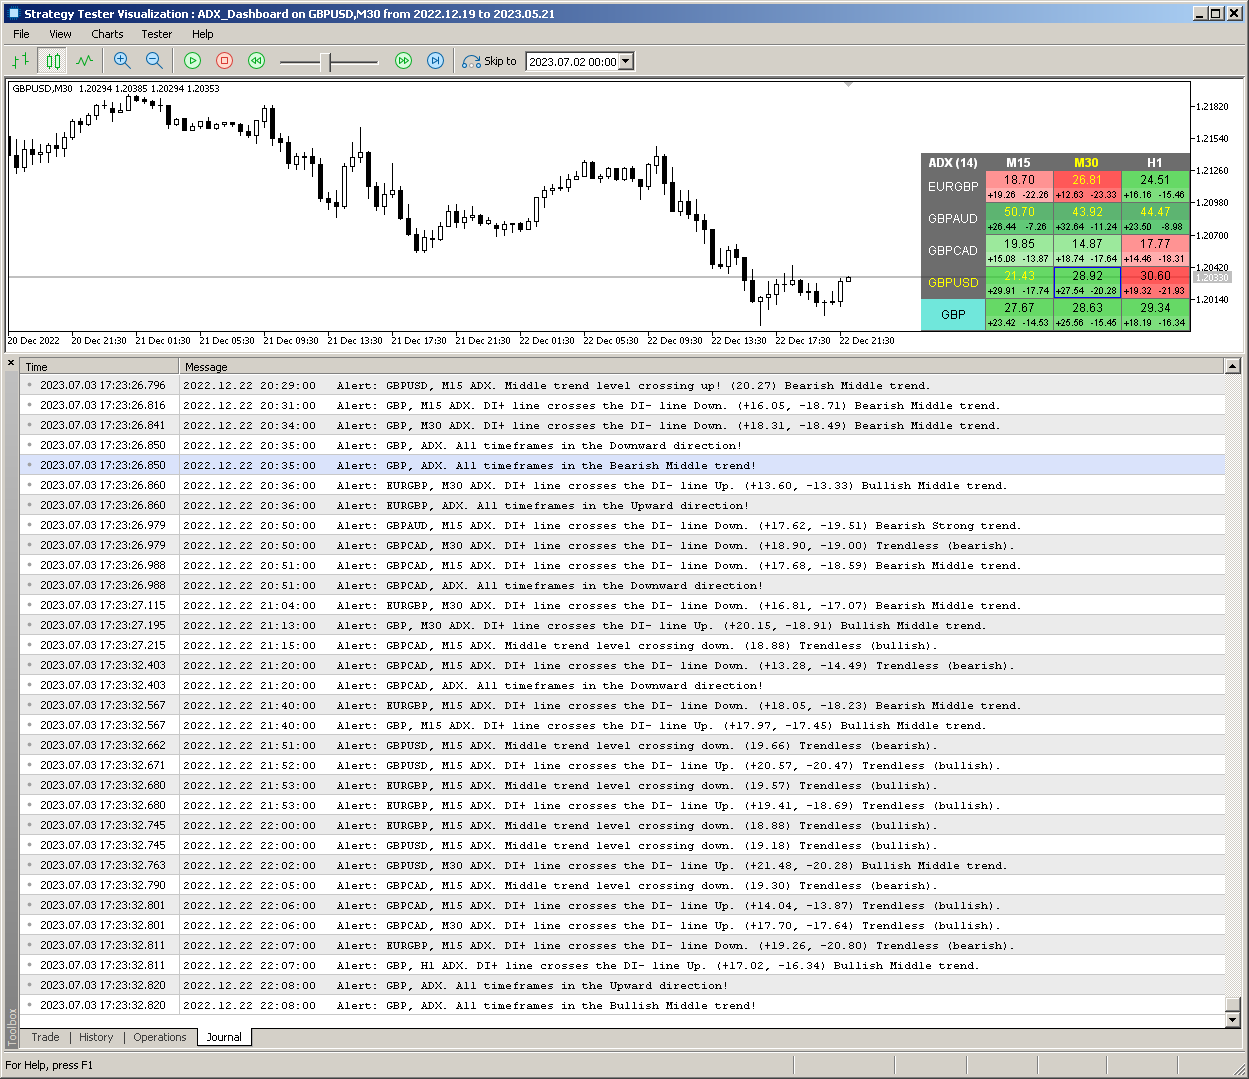
Mehrwährungs- und Mehrzeitrahmen-Modifikation des Indikators Average Directional Movement Index (ADX). Sie können in den Parametern beliebige Währungen und Zeitrahmen angeben. Außerdem kann der Indikator Benachrichtigungen senden, wenn die Trendstärkeniveaus überschritten werden und wenn die Linien +DI und -DI gekreuzt werden. Durch Klicken auf eine Zelle mit einem Punkt werden dieses Symbol und dieser Punkt geöffnet. Dies ist MTF Scanner.
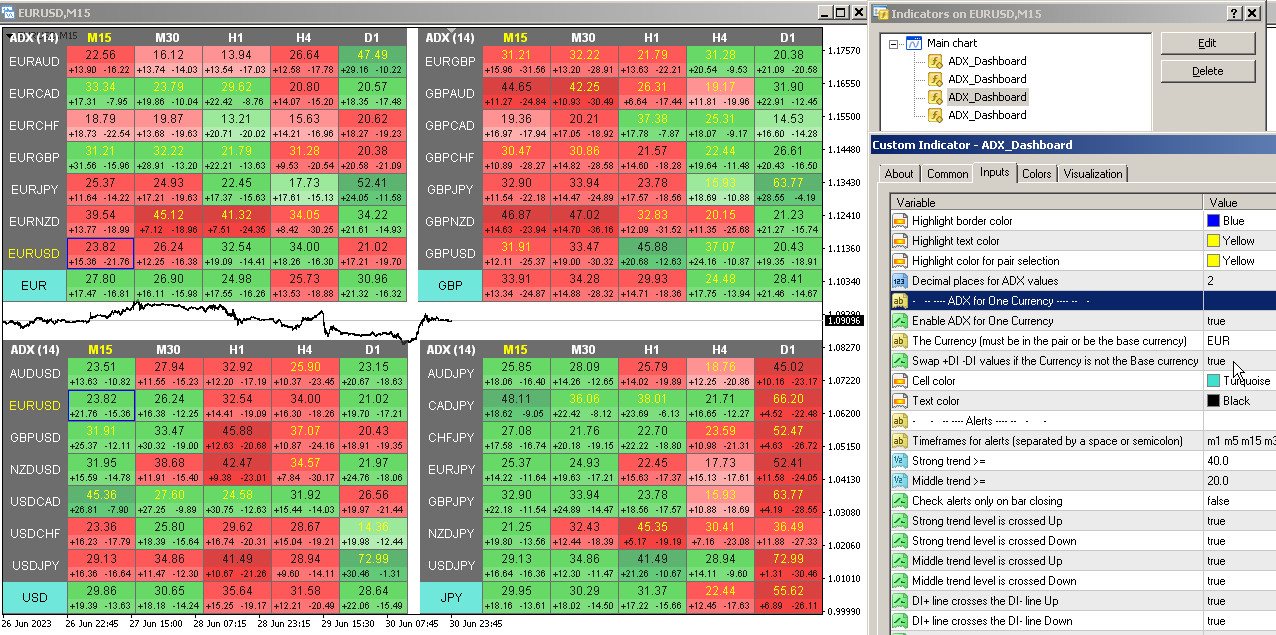
Ähnlich wie der Currency Strength Meter (CSM) kann das Dashboard automatisch Paare auswählen, die eine bestimmte Währung enthalten, oder solche Paare, die diese Währung als Basiswährung haben. Der Indikator sucht in allen Paaren, die im „Paarsatz“ angegeben sind, nach Währungen; andere Paare werden ignoriert. Basierend auf diesen Paaren wird der Gesamt-ADX für diese Währung berechnet. Und Sie können sehen, wie stark oder schwach diese Währung ist.
Die Taste zum Ausblenden des Dashboards aus dem Diagramm ist standardmäßig „D“.
Parameter
ADX Period — Durchschnittszeitraum.
ADX Applied Price — Preistyp.
Clear the chart at startup — Diagramm beim Start löschen.
Set of Pairs — Symbolsatz
— Market Watch — Paare aus dem „Marktübersicht“.— Specified manually — Paare, die manuell in den Parametern „Paare“ angegeben wurden.— Current pair — nur das aktuelle Paar anzeigen.
Pairs (separated by a space or semicolon) — Liste von Symbolen, die durch Leerzeichen oder Semikolon getrennt sind. Die Währungsnamen sollten genau wie die des Brokers geschrieben werden, Groß- und Kleinschreibung sowie Präfix/Suffix sollten beachtet werden.
Time Frames (separated by a space or semicolon) — Liste von Zeitrahmen, getrennt durch Leerzeichen oder Semikolon (mehrere Zeitrahmen).
Sort pairs — Sortierung der Liste von Paaren.
Position on chart — Ecke, um das Panel auf dem Diagramm anzuzeigen.
X offset (pix) — verschiebt das Panel entlang der X-Achse.
Y offset (pix) — verschiebt das Panel entlang der Y-Achse.
Allow to move the table manually — Verschieben der Tabelle mit der Maus zulassen.
Refresh dashboard every (seconds) — Aktualisierungszeitraum für alle Paare und Zeitrahmen.
Refresh cells only on new bar — Zellaktualisierungen (und Warnungen) erfolgen nur, wenn ein neuer Balken erscheint.
Open the pair in a new window — öffnet ein Symbol in einem neuen Diagrammfenster durch Klicken.
Chart template — der Name der Vorlage für das Diagramm, wenn das Diagramm in einem neuen Fenster geöffnet wird.
Farbeinstellungen
Color Up Strong trend — Zellenfarbe, wenn ein starker Trend vorliegt.
Color Up Middle trend — Zellenfarbe, wenn der mittlere Trend vorliegt.
Color Up Trendless — Zellenfarbe, wenn kein Trend vorliegt.
Color Down Strong trend — Zellenfarbe, wenn ein starker Trend vorliegt.
Color Down Middle trend — Zellenfarbe, wenn der durchschnittliche Trend vorliegt.
Color Down Trendless — Zellenfarbe, wenn kein Trend vorliegt.
Transparency (0-255) — Transparenz des Panels.
Font name — Schriftname.
Font size ADX — Schriftgröße ADX.
Font size DI (0-off) — Schriftgröße DI (0-aus).
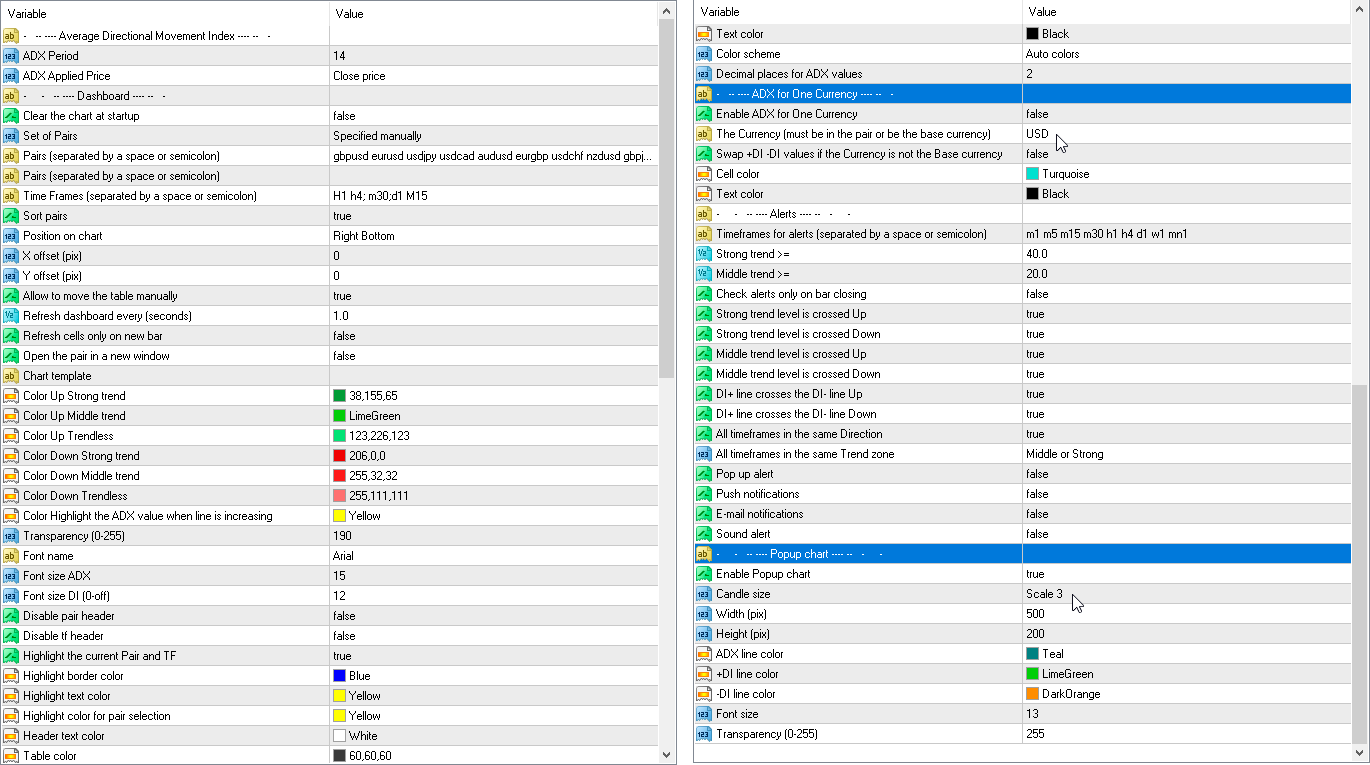
Warnungen
Timeframes for alerts (separated by a space or semicolon) — Liste der Zeiträume, für die die Warnung gesendet wird (getrennt durch Leerzeichen oder Semikolon).
Strong trend >= — das Niveau eines starken Trends
Middle trend >= — das Niveau des mittleren Trends.
Check alerts only on bar closing — Niveauüberschreitung nur nach Balkenschluss prüfen.
Strong trend level is crossed Up — Warnung, wenn ADX das Niveau eines starken Trends nach oben überschreitet.
Strong trend level is crossed Down — Warnung, wenn ADX das Niveau eines starken Trends nach unten überschreitet.
Middle trend level is crossed Up — Alarm, wenn das Niveau des mittleren Trends nach oben überschritten wird.
Middle trend level is crossed Down — Alarm, wenn das Niveau des mittleren Trends nach unten überschritten wird.
DI+ line crosses the DI- line Up — Alarm, wenn DI+ DI- nach oben kreuzt.
DI+ line crosses the DI- line Down — Alarm, wenn DI+ DI- nach unten kreuzt.
All timeframes in the same direction — Alarm, wenn alle Zellen dieselbe Richtung zeigen.
DI+ changes direction — DI+ ändert die Richtung.
DI- changes direction — DI- ändert die Richtung.
DI+ crosses level X (0-off) — DI+ kreuzt Niveau X (0-aus).
DI- crosses level X (0-off) — DI- kreuzt Niveau X (0-aus).
Pop up alert — Popup-Alarm.
Push notifications — Push-Benachrichtigungen.
E-mail notifications — E-Mail-Benachrichtigungen.
Sound alert — Akustischer Alarm.
Popup-Diagramm
Enable Popup chart — Popup-Diagramm aktivieren
Candle size — Kerzengröße
Width (pix) — Breite (Pixel)
Height (pix) — Höhe (Pixel)
Font size — Schriftgröße
Transparency (0-255) — Transparenz (0-255).


Awesome!