Moving Average Colored
- Indikatoren
- Karin Klayton Schiochet
- Version: 1.0
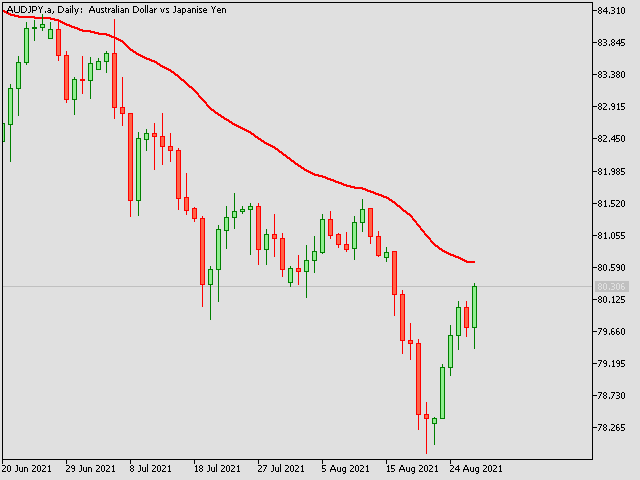
Moving Average Colored
A very simple indicator, but one that cannot be missed when carrying out your operations.
Considered one of the oldest and indispensable indicators to have on your chart now with coloring to make your operations even easier.
Configuration Parameters:
- Time course
- Averaging Method
Come and see our mql5 signals too


Indicador práctico y sencillo de usar, muy agradecido al desarrollador.