• Übersicht
  • Bewertungen
  • Diskussion (4)

Variativity

Der Indikator bewertet den Grad der Preisvolatilität und identifiziert die Komponenten, die zu Wachstum und Rückgang führen. Mit Variativity können Sie bestimmen, wo sich die Bewegung ändert, gute Zeiten, um mit dem Trend oder gegen den Trend zu handeln. Begleiten Sie offene Transaktionen.

Anzeige

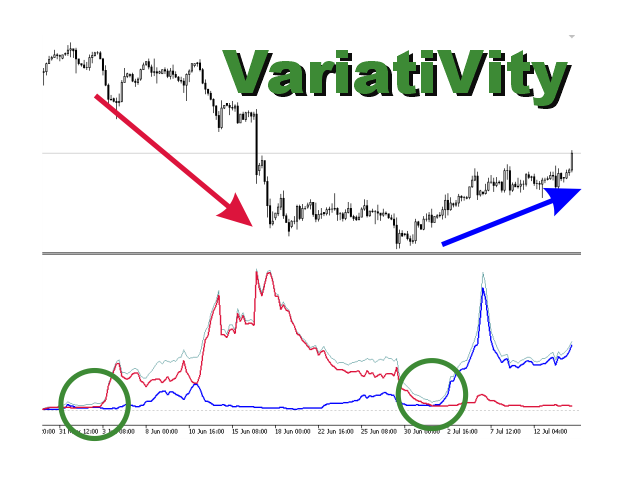
Der Indikator zeigt 3 Zeilen an:

VARIATIVITY - dünne graue Linie. Gesamtpreisvolatilität. Das Wachstum der Linie zeigt eine Zunahme der Marktaktivität an. Der Rückgang deutet auf die Möglichkeit eines Gegentrendhandels hin. Ein deutlicher Rückgang auf kleine Werte bedeutet eine hohe Wahrscheinlichkeit einer Trendumkehr.

UP - blaue Linie. Der Anteil der Veränderungen, die zu einem Anstieg des Wechselkurses führen. Der Beginn des UP-Wachstums von kleinen Werten, während die Gesamtvolatilität abnimmt, kann als Signal für Käufe dienen.

DN ist der Bruch, der zu einer Abnahme führt. Anteil der Veränderungen, die zu einer Abschreibung führen.

Die Kreuzung der UP- und DN-Leitungen kann auch als Einfahrsignal verwendet werden.

Verwendung des Indikators

Trend-Trading

Trend-Trading wird durchgeführt, wenn die VARIATIVITY-Linie von niedrigen Werten aus zu steigen beginnt. Die Richtung wird nach dem überwiegend wachsenden UP oder DN . gewählt

Counter-Trend-Trading

Gegentrend-Trading wird durchgeführt, wenn die VARIATIVITY-Linie abnimmt und UP oder DN von kleinen Werten aus zu wachsen beginnt

Begleitung von Transaktionen

Es wird empfohlen, Stop-Orders nur dann zu durchsuchen, wenn die Gesamtvolatilität sinkt.

Trend und Seitwärtsbewegung
Ein signifikanter Abfall der VARIATIVITÄT auf Tiefststände geht nur einer möglichen Trendwende voraus und kann den Beginn einer Seitwärtsbewegung anzeigen.
Die seitliche Bewegung ist wenig variabel und kann lange anhalten.

Weitere Empfehlungen
Es wird empfohlen, den Indikator in Verbindung mit Range-Indikatoren (zum Beispiel ATR) und einem Handelsplan zu verwenden

Wenn Sie Zeitrahmen von M30 bis H4 verwenden, müssen Sie die tägliche Zyklizität sorgfältig berücksichtigen.

Berücksichtigen Sie bei der Auswahl eines Zeitrahmens die Besonderheiten des Instruments. Für Metalle wird empfohlen, große Zeitrahmen H4, D1 . zu verwenden

Anzeigeeinstellungen

Der Indikator ist sehr einfach zu konfigurieren, er hat nur zwei Hauptparameter:

PRICE - Auswahl der Preise für die Analyse. Standardmäßig basiert die Berechnung auf den Eröffnungskursen der Bar

DEPTH - die Tiefe der analysierten Historie. Aus praktischen Gründen sollte er signifikant sein, mindestens 100 Balken. Der Standardwert ist 240.

SMOOTCH - Glättung von Linien. Standardmäßig deaktiviert, aber Sie können den Mittelungszeitraum festlegen. 13 wäre eine gute Wahl

Der Indikator führt eine beträchtliche Anzahl von Berechnungen durch und für eine optimale Leistung können Sie die Anzahl der berechneten und angezeigten Balken begrenzen

LIMIT - wenn gesetzt, dann begrenzt die Anzahl der berechneten Balken

Viel Erfolg !

Der Quellcode kann dem Endkäufer zur Überprüfung zur Verfügung gestellt werden.


Empfohlene Produkte
XCalper HiLo Activator
Aecio de Feo Flora Neto
HiLo Activator v1.02 by xCalper The HiLo Activator is similar to moving average of previous highs and lows. It is a trend-following indicator used to display market’s direction of movement. The indicator is responsible for entry signals and also helps determine stop-loss levels. The HiLo Activator was first introduced by Robert Krausz in the Feb. 1998 issue of Stocks & Commodities Magazine.
This is Gekko's Bollinger Bands indicator. It extends the use of the famous Bollinger Bands and calculates strong entry and exit signals using price action on the edge and on the middle bands. You can set it up in many different ways, eg: pullback, pullback against trend, middle band crossing and middle band crossing against trend. Inputs Number of Bars to Plot Indicator:  number of historical bars to plot the indicator, keep it low for better performance; Produces Signal Only When a Bar Closes:
This indicator builds upon the previously posted Nadaraya-Watson smoothers. Here we have created an envelope indicator based on Kernel Smoothing with integrated alerts from crosses between the price and envelope extremities. Unlike the Nadaraya-Watson estimator, this indicator follows a contrarian methodology. Please note that by default this indicator can be subject to repainting. Users can use a non-repainting smoothing method available from the settings. The triangle labels are designed so
Setup 9.1 strategy created by the North American trader Larry Williams . SIMPLE setup, effective, with a good level of accuracy and excellent return. Attention : The Demo version only works on the tester, if you are interested in running it in real time, please contact me and I will provide another version. Buy Signal: Exponential moving average of 9 (MME9) is falling, wait it to TURN UP (in closed candle). Place a buy stop order 1 tick above the HIGH of the candle that caused the turn to occur.
Double HMA MTF for MT5
Pavel Zamoshnikov
4 (4)
This is an advanced multi-timeframe version of the popular Hull Moving Average (HMA) Features Two lines of the Hull indicator of different timeframes on the same chart. The HMA line of the higher timeframe defines the trend, and the HMA line of the current timeframe defines the short-term price movements. A graphical panel with HMA indicator data from all timeframes at the same time . If the HMA switched its direction on any timeframe, the panel displays a question or exclamation mark with a tex
With this easy to set up indicator you can display and set alerts for the following candlestick formations: Bull Breakout, Bear Breakout, Hammer, Pin, Bullish Engulfing, Bearish Engulfing. Input parameters: ShortArrowColor: The color of the Arrows, displaying a Bearish candle formation LongArrowColor: The color of the Arrows displaying a Bullish candle formation BullishEngulfing: Disabled/Enabled/EnabledwithAlert BearishEngulfing: Disabled/Enabled/EnabledwithAlert Pin:  Disabled/Enabled/Enabledw
FREE
Owl Smart Levels MT5
Sergey Ermolov
4.07 (28)
MT4-Version  |  FAQ Der Owl Smart Levels Indikator ist ein komplettes Handelssystem innerhalb eines Indikators, der so beliebte Marktanalysetools wie die fortschrittlichen Fraktale von Bill Williams , Valable ZigZag, das die richtige Wellenstruktur des Marktes aufbaut, und Fibonacci-Levels , die die genauen Einstiegslevels markieren, enthält in den Markt und Orte, um Gewinne mitzunehmen. Detaillierte Strategiebeschreibung Anleitung zur Verwendung des Indikators Berater-Assistent im Handel Owl H
Noize Absorption Index - is the manual trading system that measures the difference of pressure between bears forces and bulls forces. Green line - is a noize free index that showing curent situation. Zero value of index shows totally choppy/flat market.Values above zero level shows how powerfull bullish wave is and values below zero measures bearish forces.Up arrow appears on bearish market when it's ready to reverse, dn arrow appears on weak bullish market, as a result of reverse expectation.
Atomic Analyst MT5
Issam Kassas
4.32 (19)
Zunächst einmal ist es erwähnenswert, dass dieser Handelsindikator nicht neu malt, nicht neu zeichnet und keine Verzögerung aufweist, was ihn sowohl für manuellen als auch für Roboterhandel ideal macht. Benutzerhandbuch: Einstellungen, Eingaben und Strategie. Der Atom-Analyst ist ein PA-Preisaktionsindikator, der die Stärke und das Momentum des Preises nutzt, um einen besseren Vorteil auf dem Markt zu finden. Ausgestattet mit fortschrittlichen Filtern, die helfen, Rauschen und falsche Signale z
STRICTLY FOR BOOM INDEX ONLY!!!!! Here I bring the Maximum Trend Arrows OT1.0 MT5 indicator. This indicator is made up of a combination of different trend indicators for entries and exits, for entries an orange arrow will paint on the chart below the current market and a red flag for closing of trades and it produces buy arrows only. When the orange arrow appears, it will appear along with it's sound to notify you. The 1H timeframe is recommended, don't use it anywhere else than on the 1H timefr
Bober Real MT5
Arnold Bobrinskii
4.76 (17)
Bober Real MT5 is a fully automatic Forex trading Expert Advisor. This robot was made in 2014 year and did a lot of profitbale trades during this period. So far over 7000% growth on my personal account. There was many updates but 2019 update is the best one. The robot can run on any instrument, but the results are better with EURGBP, GBPUSD, on the M5 timeframe. Robot doesn't show good results in tester or live account if you run incorrect sets. Set files for Live accounts availible only for cu
Multiple Timeframe MACD indicator. This indicator was built for making multiple timeframe analysis possible in MT5 using MACD Indicator. MACD Indicator traditionally shows two lines and one histogram. MACD Line(Yellow) is calculated by subtracting 12period EMA(fast) from 26period EMA (slow). Signal Line(Blue) is created by a 9period EMA from MACD Line. Histogram is just the difference between MACD and Signal lines. Histogram is colored based on the difference between its value and the previous h
SolarTrade Suite Finanzindikator: Jupiter Market Indicator – Ihr zuverlässiger Führer in der Welt der Finanzmärkte! Dies ist ein Trendindikator, der spezielle innovative und fortschrittliche Algorithmen zur Berechnung seines Wertes verwendet und zudem ein ansprechendes Design aufweist. Die Messwerte dieses Indikators sind sehr leicht zu verstehen: Blau – Kaufen, Rot – Verkaufen. Sehen Sie sich unsere anderen Produkte aus der SolarTrade Suite-Reihe am Ende der Beschreibung an. Möchten Sie si
TrendDetect
Pavel Gotkevitch
The Trend Detect indicator combines the features of both trend indicators and oscillators. This indicator is a convenient tool for detecting short-term market cycles and identifying overbought and oversold levels. A long position can be opened when the indicator starts leaving the oversold area and breaks the zero level from below. A short position can be opened when the indicator starts leaving the overbought area and breaks the zero level from above. An opposite signal of the indicator can b
LevelPAttern MT5 is a technical indicator based on the daily levels and Price Action patterns. The indicator is based on the standard ZigZag indicator + reversal candlestick pattens, such as Star, Hammer (also knows as Pin bar), Engulfing and others. The indicator generates audio and text notifications when a pattern is formed and a level is touched. It also supports sending email and push notifications. Indicator operation features It is suitable for working with any CFD and FOREX trading inst
Renko System
Marco Montemari
This indicator can be considered as a trading system. It offers a different view to see the currency pair: full timeless indicator, can be used for manual trading or for automatized trading with some expert advisor. When the price reaches a threshold a new block is created according to the set mode. The indicator beside the Renko bars, shows also 3 moving averages. Features renko mode median renko custom median renko 3 moving averages wicks datetime indicator for each block custom notification
Limitless MT5
Dmitriy Kashevich
Limitless MT5 is a universal indicator suitable for every beginner and experienced trader. works on all currency pairs, cryptocurrencies, raw stocks Limitless MT5 - already configured and does not require additional configuration And now the main thing Why Limitless MT5? 1 complete lack of redrawing 2 two years of testing by the best specialists in trading 3 the accuracy of correct signals exceeds 80% 4 performed well in trading during news releases Trading rules 1 buy signal - the ap
ATrend
Zaha Feiz
4.77 (13)
ATREND: How It Works and How to Use It How It Works The " ATREND " indicator for the MT5 platform is designed to provide traders with robust buy and sell signals by utilizing a combination of technical analysis methodologies. This indicator primarily leverages the Average True Range (ATR) for volatility measurement, alongside trend detection algorithms to identify potential market movements. Leave a massage after purchase and receive a special bonus gift. Key Features: ⦁ Dynamic Trend Detect
ArcturusFX MT5
Fernando Jose Anton
ArcturusFX-Handbuch: https ://www .mql5 .com /en /blogs /post /760580 Empfohlenes Asset: GBPUSD - Zeitfenster: 5M Handelskonfigurationen: Konservative Konfiguration – Hedge-Handel: https ://c .mql5 .com /6 /965 /Conservative_Hedge_Setup_- GBPUSD -_5M .ini Mittel-aggressive Konfiguration – Hedge-Handel: https ://c .mql5 .com /6 /965 /Medium_Aggressive_Setup_- GBPUSD -_5M .ini Hoch-aggressive Konfiguration – Hedge-Handel: https ://c .mql5 .com /6 /965 /High_Aggressive_Setup_- GBPUSD -_5M .ini K
The Trend Complete indicator is a signal indicator and has interesting properties. It should be taken into account that this indicator reflects extremes and should be used as an additional one, and another instrument should be used for the entry point. Searches for and displays pivot points on the price chart. Trend indicators are one of the main tools for analyzing trends in the Forex market. The indicator is able to transmit all types of signals to the user: messages, E-mail and Push! The go
This indicator scans the 1-3 Trendline pattern . The indicator is a 100 % non repaint low risk breakout system . The patterns are formed around swing high and swing lows which make them a low risk pattern with high reward. PATTERN BACKGROUND The 1-3 Trendline Breakout pattern is formed by four(4) points which are composed of three (3) primary points and the pattern neck. A trendline is always formed by the point 1 and the neck of the pattern . When price breaks out of the trendline formed , it
Point Black
Ignacio Agustin Mene Franco
Black Card Pack indicator 5/1 point black It has the strategy of professional bollingers where each arrow gives you a different entry signal. It is used to operate in m1 and in d1 It is used for scalping and intraday, modified for forex markets ! suitable for all pairs modified for synthetic index markets suitable for all pairs! Ideal for volatility and jumps!
Cycles Forecast
Pooriya Alirezaee
This indicator is based on a mathematical formula and an ANN combined, designed to make a model(using previous prices) of the most recent market condition (any chart*) in order to use the model as a forecasting tool. *This indicator can operate on any chart/timeframe, but it's suggested you use multiple timeframes for each trade because this method relies solely on the time factor, you can not use this indicator to predict price volatility, but if it's fit correctly it will show you when the nex
Hunter trend
Yaroslav Varankin
Hunter Trend: Arrow Indicator for Binary Options Trading Hunter Trend is an arrow indicator designed for trading binary options (turbo options) on the M1 timeframe, allowing for short-term trading opportunities. How to Trade with this Tool: Signals may appear when a candlestick forms. Once such a signal appears, wait for the closure of that candlestick. Upon the opening of a new candlestick, open a trade for 1-2 candlesticks in the indicated direction. In this case, for 1-2 minutes. A blue dot
"GoldenSwing" is a comprehensive MetaTrader 5 indicator meticulously crafted by Southern Star Trading, designed to enhance your trading strategies with precision swing high and swing low identification. Harnessing the power of swing analysis, this indicator provides traders with invaluable insights into market reversals and trend continuations, enabling them to make informed trading decisions. With its advanced algorithm, GoldenSwing detects significant swing highs and swing lows in real-time,
Candle High Low Indicator showing High and Low of X candles across a line. Settings Candle number for calculation (>= 1 ) - Define the number of candles for the indicator to find the maximum and minimum of that period of candles. Continuation of the line's display to the right - If you want the High and Low line to extend to the right edge of the graph Line High Color - Set line color Line High Style - Set line style Line Low Color - Set line color Line Low Style - Set line style
This indicator finds Three Drives patterns. The Three Drives pattern is a 6-point reversal pattern characterised by a series of higher highs or lower lows that complete at a 127% or 161.8% Fibonacci extension. It signals that the market is exhausted and a reversal can happen. [ Installation Guide | Update Guide | Troubleshooting | FAQ | All Products ] Customizable pattern sizes Customizable colors and sizes Customizable breakout periods Customizable 1-2-3 and 0-A-B ratios It implements visual/s
Gecko EA MT5
Profalgo Limited
5 (1)
NEW PROMO: Only a few copies copies available at 349$ Next price: 449$ Make sure to check out our " Ultimate EA combo package " in our   promo blog ! Gecko runs a simple, yet very effective, proven strategy.  It looks for important recent support and resistance levels and will trade the breakouts.  This is a "real" trading system, which means it will use a SL to protect the account.  It also means it will not use any dangerous techniques like martingale, grid or averaging down. The EA shows its
Premium-Level ist ein einzigartiger Indikator mit mehr als 80% Genauigkeit der richtigen Vorhersagen! Dieser Indikator wurde von den besten Trading-Spezialisten seit mehr als zwei Monaten getestet! Den Indikator des Autors finden Sie nirgendwo anders! Anhand der Screenshots können Sie sich von der Genauigkeit dieses Tools überzeugen! 1 ist ideal für den Handel mit binären Optionen mit einer Ablaufzeit von 1 Kerze. 2 funktioniert bei allen Währungspaaren, Aktien, Rohstoffen, Kryptowährungen
Dieser Indikator findet AB = CD-Retracement-Muster. Das AB = CD-Retracement-Muster ist eine 4-Punkte-Preisstruktur, bei der das anfängliche Preissegment teilweise zurückverfolgt wird, gefolgt von einer Bewegung mit gleichem Abstand vom Abschluss des Pullbacks, und die Basis für alle harmonischen Muster ist. [ Installationsanleitung | Update-Anleitung | Fehlerbehebung | FAQ | Alle Produkte ] Anpassbare Mustergrößen Anpassbare AC- und BD-Verhältnisse Anpassbare Pausenzeiten Anpassbare Linien,
Käufer dieses Produkts erwarben auch
Golden Trend Indicator MT5
Noha Mohamed Fathy Younes Badr
4.86 (14)
Golden Trend indicator  is The best indicator for predicting trend movement this indicator never lags and never repaints and never back paints    and give  arrow buy and sell    before the candle appear  and it will help you and  will make your trading decisions clearer its work on all currencies and  gold and crypto and all time frame This unique  indicator uses very secret algorithms to catch the  trends, so you can trade using this indicator and see the trend clear on charts  manual guide and
FX Volume MT5
Daniel Stein
4.82 (17)
FX Volume: Erleben Sie den echten Marktüberblick aus der Sicht eines Brokers Kurzüberblick Möchten Sie Ihre Handelsstrategie auf das nächste Level bringen? FX Volume liefert Ihnen Echtzeit-Einblicke in die Positionierung von Retail-Tradern und Brokern — lange bevor verzögerte Berichte wie der COT verfügbar sind. Ob Sie nach beständigen Gewinnen streben oder einfach einen tieferen Vorteil am Markt suchen, FX Volume hilft Ihnen, große Ungleichgewichte zu erkennen, Breakouts zu bestätigen und Ihr
Quantum TrendPulse
Bogdan Ion Puscasu
5 (13)
Wir stellen   Quantum TrendPulse   vor, das ultimative Handelstool, das die Leistung von   SuperTrend   ,   RSI   und   Stochastic   in einem umfassenden Indikator vereint, um Ihr Handelspotenzial zu maximieren. Dieser Indikator wurde für Händler entwickelt, die Präzision und Effizienz suchen, und hilft Ihnen dabei, Markttrends, Momentumverschiebungen und optimale Ein- und Ausstiegspunkte sicher zu erkennen. Hauptmerkmale: SuperTrend-Integration:   Folgen Sie problemlos dem vorherrschenden Markt
TPSpro RFI Levels MT5
Roman Podpora
4.53 (19)
ANWEISUNGEN       Russland       -        ENG    Die Empfehlung basiert auf dem Indikator -   TPSpro   TREND PRO -   Version MT5 Die wichtigsten Elemente in der Branche sind entweder in Zonen oder in der Fabrik enthalten, oder sie führen zu einer Lösung bei einem Kauf oder dem Verkauf eines anderen Instruments. Wenn viele Menschen ihre Rechte nicht auf dem Händlerkonto verschlüsseln, werden die Folgen nicht schnell genug sein. Ich habe es damit abgeschlossen, dass ich diese Folgen nun noch inter
TPSproTREND PrO MT5
Roman Podpora
4.47 (17)
TPSpro TREND PRO   ist ein Trendindikator, der den Markt automatisch analysiert und Informationen über den Trend und jede seiner Änderungen liefert sowie Signale für den Einstieg in Geschäfte ohne Neuzeichnung gibt! Der Indikator verwendet jede Kerze und analysiert sie separat. bezieht sich auf verschiedene Impulse – Aufwärts- oder Abwärtsimpuls. Exakte Einstiegspunkte in Transaktionen für Währungen, Krypto, Metalle, Aktien, Indizes! Version MT5                   VOLLSTÄNDIGE BESCHREIBUNG DES IN
RelicusRoad Pro MT5
Relicus LLC
4.78 (18)
Jetzt 147 US -Dollar (nach ein paar Aktualisierungen auf 499 US -Dollar) - Unbegrenzte Konten (PCs oder MACs) RelicusRoad Benutzerhandbuch + Schulungsvideos + Zugang zur privaten Discord-Gruppe + VIP-Status EINE NEUE ART, DEN MARKT ZU BETRACHTEN RelicusRoad ist der weltweit leistungsstärkste Handelsindikator für Forex, Futures, Kryptowährungen, Aktien und Indizes und gibt Händlern alle Informationen und Tools, die sie benötigen, um profitabel zu bleiben. Wir bieten technische Analysen und Ha
Bill Williams Advanced
Siarhei Vashchylka
5 (9)
Bill Williams Advanced is designed for automatic chart analysis using Bill Williams' "Profitunity" system. The indicator analyzes four timeframes at once. Manual (Be sure to read before purchasing) Advantages 1. Automatically analyzes the chart using the "Profitunity" system of Bill Williams. The found signals are placed in a table in the corner of the screen. 2. Equipped with a trend filter based on the Alligator indicator. Most of the system signals are recommended to be used only according t
Dieses Dashboard zeigt die   neuesten verfügbaren harmonischen   Muster für die ausgewählten Symbole, so dass Sie Zeit sparen und effizienter sein werden /   MT4-Version . Kostenloser Indikator:   Basic Harmonic Pattern Spalten des Indikators Symbol:   die ausgewählten Symbole werden angezeigt Trend:   bullish oder bearish Pattern :   Art des Musters (Gartley, Schmetterling, Fledermaus, Krabbe, Hai, Cypher oder ABCD) Entry :   Einstiegskurs SL:   Stop-Loss-Kurs TP1:   1. Take-Profit-Kurs TP2
Dies ist ein Indikator für MT5, der genaue Signale für den Einstieg in einen Handel ohne Repainting (Neuzeichnen) liefert. Er kann auf alle Finanzwerte angewendet werden: Forex, Kryptowährungen, Metalle, Aktien, Indizes. Er liefert ziemlich genaue Schätzungen und sagt Ihnen, wann es am besten ist, eine Position zu eröffnen und zu schließen. Sehen Sie sich das Video (6:22) mit einem Beispiel für die Verarbeitung nur eines Signals an, das sich für den Indikator gelohnt hat! Die meisten Händler ver
Wir stellen vor       Quantum Breakout PRO   , der bahnbrechende MQL5-Indikator, der die Art und Weise, wie Sie mit Breakout-Zonen handeln, verändert! Entwickelt von einem Team erfahrener Händler mit über 13 Jahren Handelserfahrung,       Quantum Breakout PRO       ist darauf ausgelegt, Ihre Handelsreise mit seiner innovativen und dynamischen Breakout-Zone-Strategie auf ein neues Niveau zu heben. Der Quantum Breakout Indicator zeigt Ihnen Signalpfeile auf Breakout-Zonen mit 5 Gewinnzielzonen u
Matrix Arrow Indicator MT5
Juvenille Emperor Limited
5 (13)
Matrix Arrow Indicator MT5   ist ein einzigartiger 10-in-1-Trend, der zu   100 % nicht neu gezeichnet   werden kann. Multi-Timeframe-Indikator, der für alle Symbole/Instrumente verwendet werden kann:   Forex ,   Rohstoffe ,   Kryptowährungen ,   Indizes ,   Aktien .  Der  Matrix Arrow Indicator MT5  wird den aktuellen Trend in seinen frühen Stadien bestimmen und Informationen und Daten von bis zu 10 Standardindikatoren sammeln, die sind: Durchschnittlicher Richtungsbewegungsindex (ADX) Rohstoff
Easy Breakout MT5
Mohamed Hassan
5 (3)
After your purchase, feel free to contact me for more details on how to receive a bonus indicator called VFI, which pairs perfectly with Easy Breakout for enhanced confluence!     Easy Breakout MT5   is a powerful price action trading system built on one of the most popular and widely trusted strategies among traders: the   Breakout strategy ! This indicator delivers crystal-clear Buy and Sell signals based on breakouts from key support and resistance zones. Unlike typical breakout indicators
Gartley Hunter Multi
Siarhei Vashchylka
5 (9)
Gartley Hunter Multi - An indicator for searching for harmonic patterns simultaneously on dozens of trading instruments and on all possible timeframes. Manual (Be sure to read before purchasing) | Version for MT4 Advantages 1. Patterns: Gartley, Butterfly, Shark, Crab. Bat, Alternate Bat, Deep Crab, Cypher 2. Simultaneous search for patterns on dozens of trading instruments and on all possible timeframes 3. Search for patterns of all possible sizes. From the smallest to the largest 4. All fou
Royal Scalping Indicator M5
Vahidreza Heidar Gholami
5 (6)
Royal Scalping Indicator is an advanced price adaptive indicator designed to generate high-quality trading signals. Built-in multi-timeframe and multi-currency capabilities make it even more powerful to have configurations based on different symbols and timeframes. This indicator is perfect for scalp trades as well as swing trades. Royal Scalping is not just an indicator, but a trading strategy itself. Features Price Adaptive Trend Detector Algorithm Multi-Timeframe and Multi-Currency Trend Low
Dies ist wahrscheinlich der vollständigste Indikator für die automatische Erkennung der harmonischen Preisbildung, den Sie für die MetaTrader-Plattform finden können. Es erkennt 19 verschiedene Muster, nimmt Fibonacci-Projektionen genauso ernst wie Sie, zeigt die potenzielle Umkehrzone (PRZ) an und findet geeignete Stop-Loss- und Take-Profit-Werte. [ Installationsanleitung | Update-Anleitung | Fehlerbehebung | FAQ | Alle Produkte ] Es erkennt 19 verschiedene harmonische Preisbildungen Darges
Dieses Dashboard entdeckt und zeigt die   Angebots- und Nachfragezonen   auf dem Chart an, sowohl im Scalping- als auch im Long-Term-Modus, je nach Ihrer Handelsstrategie für die ausgewählten Symbole. Darüber hinaus hilft Ihnen der Scanner-Modus des Dashboards, alle gewünschten Symbole auf einen Blick zu überprüfen und keine geeigneten Positionen zu verpassen /   MT4-Version Kostenloser Indikator:   Basic Supply Demand Merkmale Ermöglicht Ihnen die Anzeige von Handelsmöglichkeiten für   mehrere
CONTACT US  after purchase to get the Indicator Manual. Try Now—Limited 50% Discount for First 10 Buyers! Download the  Metatrader 4 Version Due to regulatory restrictions, our service is unavailable in certain countries such as India, Pakistan, and Bangladesh. William Delbert Gann (W.D. Gann) was an exceptional market analyst, whose trading technique was based on a complex blend of mathematics, geometry, astrology, and ancient mathematics which proved to be extremely accurate. A Note from t
Suleiman Levels
Suleiman Alhawamdah
5 (2)
Wichtiger Hinweis: Das in den Screenshots gezeigte Bild zeigt meine 2 Indikatoren, den „Suleiman Levels“-Indikator und den „RSI Trend V“-Indikator. Ich empfahl, es zusammen mit dem „RSI Trend V1“-Indikator zu verwenden, insbesondere um die farbige Wolke zu bestätigen und abzugleichen sowie für Pfeilsignale, zusätzlich zur Bedeutung des Fibonacci-Indikators und seiner angehängten herausragenden Ebenen : https://www.mql5.com/en/market/product/132080 Der „Suleiman Levels“-Indikator ist ein fortsch
Gold Trend 5
Sergei Linskii
5 (1)
Gold Trend - dies ist ein guter technischer Indikator für Aktien. Der Algorithmus des Indikators analysiert die Preisbewegung eines Vermögenswerts und spiegelt die Volatilität und mögliche Einstiegszonen wider. Die besten Indikatorsignale: - Für VERKAUFEN = rotes Histogramm + roter SHORT-Zeiger + gelber Signalpfeil in dieselbe Richtung. - Für KAUFEN = blaues Histogramm + blauer LONG-Zeiger + aquafarbener Signalpfeil in dieselbe Richtung. Vorteile des Indikators: 1. Der Indikator erzeugt S
Golden Spike Premium
Kwaku Bondzie Ghartey
Golden Spikes Detector Acknowledgement and Dedications:  The name of this indicator was Inspired by an Original; Mr Grant Koopman; a Knowledgeable and experienced Synthetics trader. I dedicate this indicator to Mr Grant.  Overview:   The Golden Spikes Premium is a groundbreaking trading indicator meticulously crafted for the Boom and Crash indices on the Deriv market. Tailored to meet the needs of discerning traders, this powerful tool operates exclusively on the one-minute timeframe, providing
Einzigartiger Indikator, der einen professionellen und quantitativen Ansatz für Mean-Reversion-Trading umsetzt. Es nutzt die Tatsache, dass der Preis auf vorhersehbare und messbare Weise umlenkt und zum Mittelwert zurückkehrt, was klare Ein- und Ausstiegsregeln ermöglicht, die nicht-quantitative Handelsstrategien bei weitem übertreffen. [ Installation Guide | Update Guide | Troubleshooting | FAQ | All Products ] Klare Handelssignale Erstaunlich einfach zu handeln Anpassbare Farben und Größen Im
ADR Scalping Indicator MT5
Robert Mathias Bernt Larsson
5 (2)
Dies ist leicht der am häufigsten übersehene Indikator, der Ihnen die meisten Einblicke in die Preisbewegung gibt. Es ist der einzige Indikator, den ich selbst verwende. Dieser Indikator gibt Ihnen Aufschluss darüber, wie stark sich der Preis heute bewegen wird und in welche Richtung höchstwahrscheinlich. ADR steht für Average Daily Range. Wenn Sie Intraday traden oder skalpieren, müssen Sie die Spanne kennen, um die sich der Preis bewegen wird. Nehmen wir an, der Preis hat sich um die Hälft
Zunächst einmal ist es wichtig zu betonen, dass dieses Handelssystem ein Nicht-Repainting-, Nicht-Redrawing- und Nicht-Verzögerungsindikator ist, was es sowohl für manuelles als auch für automatisches Trading ideal macht. Online-Kurs, Handbuch und Vorlagen herunterladen. Das "Smart Trend Trading System MT5" ist eine umfassende Handelslösung, die für neue und erfahrene Trader maßgeschneidert ist. Es kombiniert über 10 Premium-Indikatoren und bietet mehr als 7 robuste Handelsstrategien, was es zu
Elliot Waves Analyzer Pro
Viktor Weidenthal
2.67 (3)
Elliot Waves Analyzer Pro calculates Elliot Waves to Help Identify Trend direction and Entry Levels. Mainly for Swing Trading Strategies. Usually one would open a Position in trend direction for Wave 3 or a Correction for Wave C . This Indicator draws Target Levels for the current and next wave. Most important Rules for Elliot Wave Analysis are verified by the Indicator.  The Pro version analyzes Multiple Timeframes and shows the Subwaves and Target-Levels.   For an Overview  " Elliot Waves Anal
Legacy of Gann for MT5
Pavel Zamoshnikov
5 (5)
The indicator very accurately determines the levels of the possible end of the trend and profit fixing. The method of determining levels is based on the ideas of W.D.Gann, using an algorithm developed by his follower Kirill Borovsky. Extremely high reliability of reaching levels (according to K. Borovsky  - 80-90%) Indispensable for any trading strategy – every trader needs to determine the exit point from the market! Precisely determines targets on any timeframes and any instruments (forex, met
Blahtech Supply Demand MT5
Blahtech Limited
4.54 (13)
Was: $299  Now: $149  Supply Demand uses previous price action to identify potential imbalances between buyers and sellers. The key is to identify the better odds zones, not just the untouched ones. Blahtech Supply Demand indicator delivers functionality previously unavailable on any trading platform. This 4-in-1 indicator not only highlights the higher probability zones using a multi-criteria strength engine, but also combines it with multi-timeframe trend analysis, previously confirmed swings
Was: $249  Now: $149   Market Profile defines a number of day types that can help the trader to determine market behaviour. A key feature is the Value Area, representing the range of price action where 70% of trading took place. Understanding the Value Area can give traders valuable insight into market direction and establish the higher odds trade. It is an excellent addition to any system you may be using. Inspired by Jim Dalton’s book “Mind Over Markets”, this indicator is designed to suit the
Volume Horizon is a horizontal volume indicator that allows you to observe the density of market participants' volumes across various price and time intervals. Volume histograms can be constructed based on ascending or descending market waves, as well as individual bars. This tool enables more precise determination of entry or exit points, relying on levels of maximum volumes or volume-weighted average prices (VWAP). What makes Volume Horizon unique? 1. Segmentation into ascending and descendi
Identify key turning points with reliable fractal analysis Special Offer: Purchase now to receive free bonuses worth $30! (Read more for details) This indicator examines the price structure of fractals of different periods to determine possible reversal points in the market, providing timing to positional traders that already have a fundamental or technical valuation model. Unlike its younger brother, Reversal Fractals , this indicator won't miss reversals because of the period selected, and w
EMA Scalper Indicator is an indicator of EMA lines and reversal EMA lines. Each pair of EMA channels area that can be used to make reversal entry. After the EMA lines are widening because of major trend, the area can be used to find profitable entry and exit, especially after EMA reversal. Do the cut loss whenever candle closed outside the area. The A, B, C, D, and E area are colored differently. Solid lines: Normal EMA lines. Dashed lines: Reversal EMA lines.
Weitere Produkte dieses Autors
The indicator highlights the points that a professional trader sees in ordinary indicators. VisualVol visually displays different volatility indicators on a single scale and a common align. Highlights the excess of volume indicators in color. At the same time, Tick and Real Volume, Actual range, ATR, candle size and return (open-close difference) can be displayed. Thanks to VisualVol, you will see the market periods and the right time for different trading operations. This version is intended f
FREE
DayRate EURUSD
Maxim Kuznetsov
The script calculates the rate of price change and its deviation. Displays a typical price movement channel. Transfer the script to the chart and it will automatically mark up the channels through which the price can move in the near future. Place orders according to the channel boundaries. The script uses statistical methods to determine the rate and amplitude of the price. It calculates and displays channels and limits of further movement based on them.  This   version   is   intended   for
FREE
DayRate
Maxim Kuznetsov
The script calculates the rate of price change and its deviation. Displays a typical price movement channel. Transfer the script to the chart and it will automatically mark up the channels through which the price can move in the near future. Place orders according to the channel boundaries. The script uses statistical methods to determine the rate and amplitude of the price. It calculates and displays channels and limits of further movement based on them.  Parameters PLACEMENT - channel place
XFlow CHF
Maxim Kuznetsov
XFlow zeigt einen expandierenden Preiskanal, der hilft, den Trend und die Momente seiner Umkehrung zu bestimmen. Wird auch bei der Begleitung von Trades verwendet, um Take-Profit/Stop-Loss und Mittelwerte festzulegen. Es hat praktisch keine Parameter und ist sehr einfach zu bedienen - geben Sie einfach den für Sie wichtigen Moment der Geschichte an und der Indikator berechnet den Preiskanal. dies ist eine Demo-Version, die auf CHF-Währungspaare beschränkt ist. Wurde entwickelt, um die interakti
FREE
SyncTradeSQL
Maxim Kuznetsov
Script for quick updates (synchronization) up-to-date data in the SQLite database. Saves open positions and orders, current quotes. Take advantage of SQLite's capabilities for intermediate data storage, analytics, and integrations of the MetaTrader platform. Keep all your data in one place. Use the saved data in SQL analytical queries, from Python and other languages, to build dashboards Parameters useDefaults true - use default parameters. Save data to the COMMON hierarchy, to the db/ram/{s
FREE
SyncHistorySQL
Maxim Kuznetsov
Script for quick updates (synchronization) trade history in the SQLite database. Saves closed positions and orders, symbols data. Take advantage of SQLite's capabilities for intermediate data storage, analytics, and integrations of the MetaTrader platform. Keep all your data in one place. Use the saved data in SQL analytical queries, from Python and other languages, to build dashboards Parameters useDefaults   true - use default parameters. Save data to the COMMON hierarchy, to the db/ram/{s
FREE
IntradayMagicGBP
Maxim Kuznetsov
4 (1)
IntradayMagic прогнозирует характер ATR и тиковых объёмов на 1 сутки вперёд. Индикатор не перерисовывается и не отстаёт. Используя Intraday Magic вы можете значительно повысить качество торговли и избежать излишних рисков. По его показаниям можно детектировать кризисные состояния рынка и моменты разворота тренда, уточнять моменты и направления входов. Это бесплатная ознакомительная версия ограничена символами (парами) включающими GBP. Никаких иных ограничений нет. Для других пар вы можете исполь
FREE
Maltese cross GBP   Универсальный инструмент для определения трендов, флетов и торговли по графическим паттернам. Объединяет техники Гана, Эллиота, Мюррея. Просто разместите его на графике и он покажет направление и скорость движения цены, выделит разворотные моменты. Maltese cross поможет точно определять узловые моменты в истории, планировать торговые действия и сопровождать открытые сделки.  Эта бесплатная демонстрационная версия MalteseCross ограничена GBPUSD и кроссами GBP. Никаких прочих о
FREE
SyncDB LT
Maxim Kuznetsov
A   service   to   keep   the   SQLite   database up   to   date .   Fast   real -t ime   operation .   Saves   open   positions   and   orders ,   current   quotes ,   and   trading   history .   Take   advantage   of   SQLite 's   capabilities   for   intermediate   data   storage ,   analytics ,   and   integration   of the   MetaTrader   platform .   Save   all   your   data   in   one   place .   Use   the   saved   data   in   SQL   analytical   queries ,   from   Python   and   other   la
FREE
Another Relation displays the relative movement of the other symbols (up to 5) in a separate chart window. The indicator works currency pairs, indices and other quotes. Another Relation allows to visually estimate the symbol correlation and their relative amplitude. Thus, the trader is able to compare the movement of the current instrument to others, identify correlations, delays and make decisions based on their general movement. Indicator usage The window displays the data on all the symbols
SMArrows
Maxim Kuznetsov
Reliable SMA reversal signals. No repainting. Simple settings. Suitable for binary options. Made for maximum traders' convenience. The indicator performs a complex analysis of a price movement relative to SMA and displays the array which is to be most probably followed by a price impulse and SMA reversal. Internal sorting mechanisms sort out definitely late, unreliable or inefficient entries. Options SMA_PERIOD - considered SMA period should be no less than 24, the default is 44 SMA_APPLIED - S
SpeedChan
Maxim Kuznetsov
SpeedChan Leading indicator. Marks in the future two price channels - if the price comes into the channel, then the quote changes with the speed specified in the parameters. In these areas, price reversals are most likely. Two price channels are displayed - one on top, showing the growth rate; the second one - below, shows the speed of the fall. Channels are displayed as a solid center line and two borders drawn with a dotted line. In many cases, the area between the channels is not important fo
IntradayMagic predicts the nature of ATR and tick volumes for 1 day ahead. The indicator does not redraw and does not lag behind. Using Intraday Magic, you can significantly improve the quality of trading and avoid unnecessary risks. According to its indications, you can detect the crisis state of the market and the moments of trend reversal, specify the moments and directions of entries. How the indicator works Periodic events, exchange schedules, Bank schedules, expirations, and other similar
Ein universelles Tool zur Identifizierung von Trends, Flats und dem Handel mit Chartmustern. Kombiniert die Techniken von Ghana, Elliot, Murray. Platzieren Sie es einfach auf dem Chart und es zeigt die Richtung und Geschwindigkeit der Preisbewegung an und hebt die Wendepunkte hervor. Malteserkreuz hilft Ihnen, die Schlüsselmomente in der Geschichte zu lokalisieren, Handelsaktionen zu planen und offene Geschäfte zu begleiten. Grundprinzipien Malteserkreuz zeigt Trend-, Flat- und Impulslinien vor
Inguz 4
Maxim Kuznetsov
Ing (inguz,ingwar) - the 23rd rune of the elder Futhark ᛝ, Unicode+16DD. Add some runic magic to your trading strategies. The correct marking of the daily chart will indicate to you the successful moments for counter-trend trading. Simple to use, has high efficiency in volatile areas. Be careful in lateral movements. Signals ᛝ are generated when the main lines of construction intersect. Red arrow down - recommended sales Blue up arrow - recommended purchases rare purple arrows indicate exce
XFlow4
Maxim Kuznetsov
XFlow zeigt einen expandierenden Preiskanal, der hilft, den Trend und die Momente seiner Umkehrung zu bestimmen. Wird auch bei der Begleitung von Trades verwendet, um Take-Profit/Stop-Loss und Mittelwerte festzulegen. Es hat praktisch keine Parameter und ist sehr einfach zu bedienen - geben Sie einfach den für Sie wichtigen Moment der Geschichte an und der Indikator berechnet den Preiskanal. ANGEZEIGTE LINIEN ROTATE ist eine dicke, durchgezogene Linie. Das Zentrum der allgemeinen Rotation des P
The indicator shows the direction and sustainability of the trend, as well as its reversals. Use the indicator to search for successful entries, the performance bottlenecks to minimize risk and time to exit deals. The indicator is never redrawn . It is an easy-to-setup visual tool for both novice and experienced traders It fits any trading style. The indicator is displayed immediately at a candlestick open as two lines: ROAD - smoothed movement. It is drawn as a solid orange line BRIGHT - trend
AnotherSymbol displays the relative movement of another symbol on the current chart as candlesticks, High/Low or Close lines. The plotted chart is aligned to the selected Moving Average and scaled by the standard deviation. When sing this data representation the trader should focus not on the absolute values, but on the behavior of the price relative to the Bollinger bands. Another Symbol provides additional opportunities in the pair strategies and cross rates trading. Main Parameters SYMBOL -
Prima MT5
Maxim Kuznetsov
Price Reversion Indicator based on MA shows trend reversals. The indicator algorithm provides highly reliable entry points, and its simple settings allow using it for any symbol and trading style. Signals are generated at the opening of a bar and are not redrawn. Prima analyzes the relative movement of two moving averages (fast and slow) with respect to the price, and determines the moments when the next movement will cause the reversal of the two MAs with a high probability. These points are ma
IntradayMagic predicts the nature of ATR and tick volumes for 1 day ahead. The indicator does not redraw and does not lag behind. Using Intraday Magic, you can significantly improve the quality of trading and avoid unnecessary risks. According to its indications, you can detect the crisis state of the market and the moments of trend reversal, specify the moments and directions of entries. How the indicator works Periodic events, exchange schedules, Bank schedules, expirations, and other similar
MartinGame 5
Maxim Kuznetsov
Trading can be fun and exciting! The MartinGame Expert Advisor game will help you get acquainted with money management while having fun, understand the value of correct forecasts and just pass the time usefully. You will act as an analyst predicting the direction and strength of the trend, and the wayward "Martin" will listen to your advice and try to follow them. Rules of the game All transactions are made by your ward "Martin". He has absolutely no knowledge of analysis, always uses fixed ta
AutoGan
Maxim Kuznetsov
Das Skript ermittelt statistisch das Haupttempo der Bewegung (der Hauptwinkel von Ghana) für das ausgewählte Werkzeug. Mathematische Methoden bestimmen die Geschwindigkeit der Kerzen des aktuellen Zeitrahmens auf dem Hintergrund des älteren. Setzen Sie einfach AutoGan auf dem Diagramm und es wird die erforderlichen Berechnungen durchführen und das Ghana-Raster richtig zeichnen. Das Skript ist sehr einfach zu bedienen, in den Parametern werden nur die Farben der Rasterlinien festgelegt. Daten:
MACD by MK
Maxim Kuznetsov
Use the opportunities of the MACD with maximum efficiency. Choose the price, filters and averaging method, all possible parameters. A unique feature of "MACD by MK"is the amplified signal line. The bends of the indicator have color designations and are additionally reflected on the main chart. By correlating them and the initial price, make your trading more qualitative. For ease of use, a neat ZigZag has been added A remarkable property of "MACD by MK" is the detection of motion attenuation.
AutoLevels
Maxim Kuznetsov
Automatic calculation and marking of resistance and price reversal levels. The script will perform statistical calculations and plot a regular grid on which the quote moves on the graph. These levels are very stable. Use them in trading planning and for placing pending orders. Just select a timeframe and AutoLevels will indicate the important places of the chart in the form of horizontal lines. Solid lines indicate more "dense" areas - areas of price reversal, where the quote happens more oft
Inguz
Maxim Kuznetsov
Ing (inguz,ingwar) - 23-ich RUNE des älteren futhark ᛝ, Unicode+16DD. Fügen Sie Ihren Handelsstrategien etwas Runenmagie hinzu. Die richtige Markierung des Tagescharts zeigt Ihnen die guten Momente für den Gegentrendhandel an. Einfach zu bedienen, hat eine hohe Effizienz in volatilen Bereichen. Seien Sie vorsichtig bei seitlichen Bewegungen. Die Signale ᛝ werden erzeugt, wenn sich die Hauptlinien der Konstruktion kreuzen. Roter Pfeil nach unten - Verkauf empfohlen Blauer Pfeil nach oben - Ka
Ing
Maxim Kuznetsov
Der Handel mit dem Intraday-Diagonalraster, die Entwicklung der Handelstechniken von Ghana und Murray. Basierend auf zyklischer Volatilität führt der Berater optimale Eingänge aus. Sehr einfach zu bedienen - der Hauptparameter ist der minimale Tagesbereich. Zusätzlich können Sie die Mittelungs- und Festlegungsparameter für den Gewinn festlegen. Jeden Tag zeigt der Berater ein diagonales Netz von Linien an, die die Ähnlichkeit der Rune Ing bilden Das Handelssignal von BUY ist die Kreuzung des
SessionAlert
Maxim Kuznetsov
Angesichts der Differenz der Handelssitzungen zeigt der Indikator die Trendrichtung und das Widerstandsniveau an. Alle Ereignisse werden auf dem Diagramm markiert und Warnungen werden gesendet. Mit SessionAlert können Sie ruhig, gemessen handeln. Sie müssen nur die Start- und Endzeit der Sitzungen angeben. Der Indikator zeigt das Widerstandsniveau an, zeigt mit einem Pfeil ein Trendwechselereignis an und markiert zusätzlich die Berührung des Widerstandsniveaus durch den Preis. Das Funktionsprinz
XFlow
Maxim Kuznetsov
XFlow zeigt einen expandierenden Preiskanal, der hilft, den Trend und die Momente seiner Umkehrung zu bestimmen. Wird auch bei der Begleitung von Trades verwendet, um Take-Profit/Stop-Loss und Mittelwerte festzulegen. Es hat praktisch keine Parameter und ist sehr einfach zu bedienen - geben Sie einfach den für Sie wichtigen Moment der Geschichte an und der Indikator berechnet den Preiskanal. ANGEZEIGTE LINIEN ROTATE ist eine dicke, durchgezogene Linie. Das Zentrum der allgemeinen Rotation des P
MyChart
Maxim Kuznetsov
The beautiful design of the trading chart makes trading more convenient and enjoyable. MyChart neatly marks out the time and price grid. Marks up the visual labels of the graph. Displays candlesticks of the older period, spread and stop-level levels. Flexible options allow you to customize the appearance to your taste. It looks good in any color theme of the terminal.  Settings TIME & PRICE grid - the appearance of the time and price grid. You can turn the grids on/off separately. Set fonts and
SyncDB
Maxim Kuznetsov
A service to keep the SQLite database up to date . Fast real - time operation . Saves open positions and orders , current quotes , and trading history . Take advantage of SQLite 's capabilities for intermediate data storage , analytics , and integration of the MetaTrader platform . Save all your data in one place . Use the saved data in SQL analytical queries , from Python and other languages , to build dashboards and integrate MetaTrader Parameters SyncDB creates and maintains 2 databases at th
Auswahl:
Keine Bewertungen
Antwort auf eine Rezension