Point of Control POC
- Indikatoren
- Anton Polkovnikov
- Version: 1.1
- Aktivierungen: 5
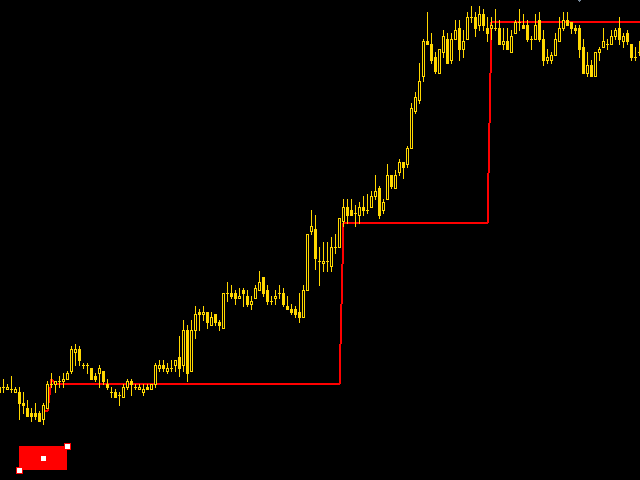
A huge number of traders use the VolumeProfile/MarketProfile analysis method. And I think there is no need to explain such concepts as POC and VAH/VAL. However, the standard VolumeProfile representation has a drawback - we only see the current picture of the market. We see the "convexity" of the volume distribution within the period. But we don't see the main thing - the "migration" of the POC level during the price movement.
Our indicator is unique. It is dynamic. The first feature is that the user chooses the starting point independently, from where the calculation begins. The second is that the dynamics of changing levels is drawn and stays on the chart, so we get a great picture of the formation of the movement through volumes.
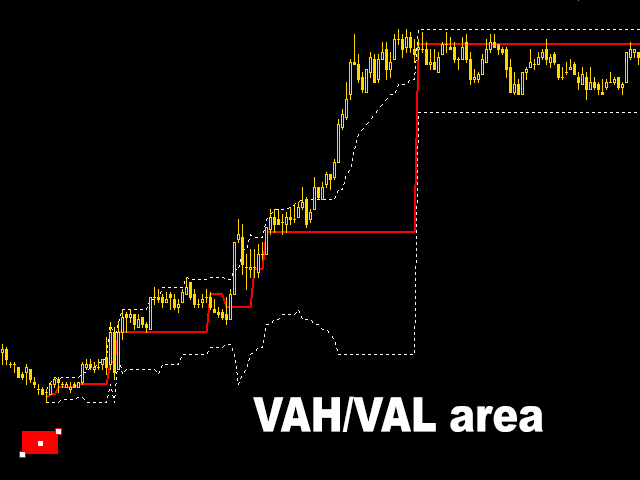
The third unique feature of the indicator is the zones of undistributed volatility. Usually when working with POC, the so-called VAH/VAL zones are used, where the user selects the area percentage. In this case the script internally counts the current market volatility. Then this value is postponed to both sides of the POC level. The variants of working with volatility levels are similar to working with VAH/VAL. The difference is that these zones are more sensitive to price movements and often more accurate.
For calculation the indicator uses three types of tick data
- volume, passed in a trade
- number of deals (ticks)
- number of changes of Bid/Ask values (so called non-trading ticks)
IMPORTANT: The indicator will only work if the broker provides tick data. You can check the possibility through a test order of the tick history in the Symbols menu. If you, not having carried out such a test, bought the indicator and as a result cannot use it, it is not the reason for return.
Basic settings:
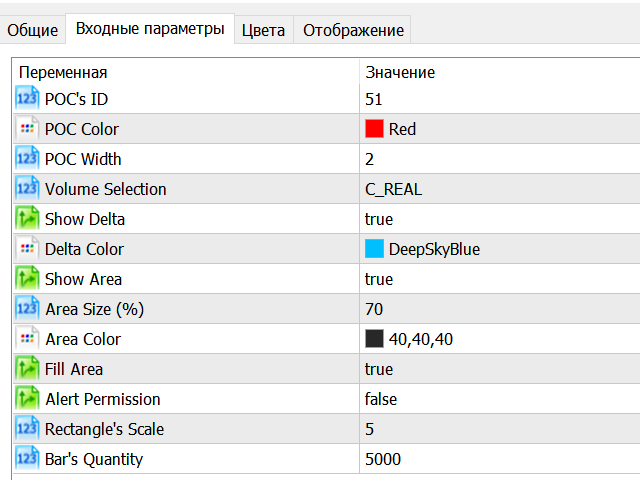
- POC's ID - unique number that user assigns to an indicator. If a user adds two or more indicators to the chart and assigns them the same ID, all indicators will start from the same point
- Volume Selection - selection of tick data type
- Show Delta - on/off display of volatility zone borders
- Show Area - switches on/off the display of VAH/VAL area borders
- AreaSize (%) - set the percentage of VAH/VAL area
- Fill Area - on/off switch of color filling of VAH/VAL area
- Alert Permission - switches alerts for ROS level change on/off
- Bar's Quantity - the quantity of bars, on which the data necessary for the indicator will be calculated. It must be less than the number of available bars on the price chart

