TheStrat TFC Monitor
- Indikatoren
- Robert Gerald Wood
- Version: 1.5
- Aktualisiert: 23 November 2023
- Aktivierungen: 10
Beim Handel mit The Strat ist es wichtig, mehrere Zeitrahmen im Auge zu behalten.
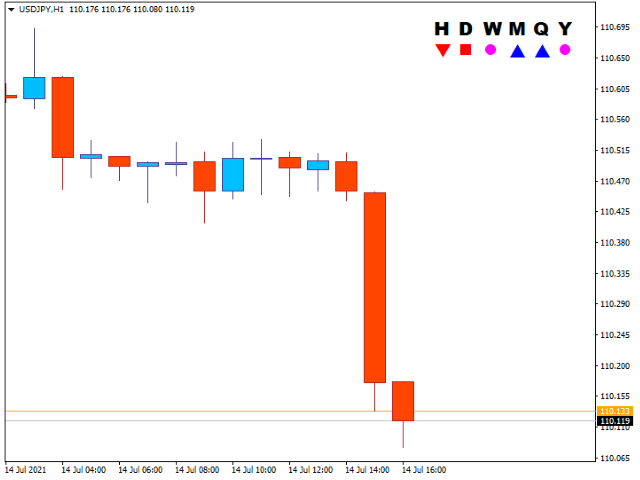
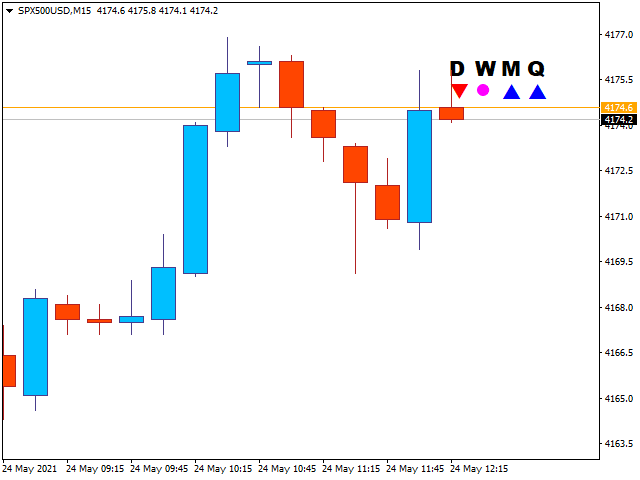
Dieser Indikator zeigt den täglichen, wöchentlichen, monatlichen und vierteljährlichen Status der aktuellen Kerze für jeden Zeitrahmen an.
- Ein Kreissymbol zeigt an, dass die Kerze in diesem Zeitrahmen derzeit eine Inside ist, oder Typ 1 in der TheStrat-Terminologie. Eine Inside-Day-Kerze konsolidiert die Kursbewegung, und wir suchen nach einem Ausbruch aus der Spanne.
- Ein Dreieckssymbol, das nach oben oder unten zeigt, ist eine Trendkerze oder Typ 2 in der TheStrat-Terminologie. Eine Trendkerze kann entweder bullisch oder bärisch sein, was darauf hinweist, dass sie aus der vorherigen Kerzenspanne ausgebrochen ist und nun in eine Richtung tendiert.
- Ein quadratisches Symbol ist eine Außenkerze oder Typ 3 in der Strat-Terminologie. Dies weist auf zwei Dinge hin, zum einen, dass der Preis in diesem Zeitrahmen unentschlossen und wahrscheinlich ziemlich unruhig ist, und zum anderen, dass es in kürzeren Zeitrahmen wahrscheinlich gute Gelegenheiten für den Handel mit kurzen Umkehrungen gibt. Das Quadrat hat entweder eine bullische oder eine bärische Farbe, um anzuzeigen, welche Seite derzeit gewinnt.
Die für jedes Symbol verwendeten Farben können nach Ihrem Geschmack konfiguriert werden, und die Größe des Textes und der Symbole sind ebenfalls konfigurierbar.
EINSTELLUNGEN
Zeitrahmenauswahl
Stündlich anzeigen
Zeigt bei True den stündlichen Kerzenstatus an.
Täglich anzeigen
Zeigt bei True den täglichen Kerzenstatus an.
ShowWeekly
Bei True wird der wöchentliche Kerzenstatus angezeigt.
Monatlich anzeigen
Zeigt bei True den monatlichen Kerzenstatus an.
Vierteljährlich anzeigen
Zeigt bei True den vierteljährlichen Kerzenstatus an.
Jährlich anzeigen
Zeigt bei True den jährlichen Kerzenstatus an.
Anzeigeformatierung
InsideFontColor
Die Farbe, die beim Zeichnen in Kerzen (Typ 1) verwendet werden soll.
BullishFontColor
Die Farbe, die verwendet werden soll, wenn Kerzen mit bullischem Trend (Typ 2) oder Außenseite (Typ 3) gezeichnet werden.
BearishFontColour
Die Farbe, die verwendet werden soll, wenn Kerzen mit bullischem Trend (Typ 2) oder Außenseite (Typ 3) gezeichnet werden.
HeaderFontName
Die Schriftart, die für Überschriften zu den Kerzenzustandssymbolen verwendet werden soll.
Schriftgröße
Die für die Überschriften zu verwendende Schriftgröße. Dies steuert auch die Gesamtgröße der Anzeigeanzeige.