Order Squeeze
- Indikatoren
- Sara Sabaghi
- Version: 1.3
- Aktualisiert: 18 August 2022
- Aktivierungen: 5
Order Squeeze
Easy to use indicator to predict the market movement with calculated HIGH important levels.
These levels are calculated in the lowest time frame with candle details. Ind calculates the quantity of market tick, volume per tick, and orders per candle.
So with this statistical data, you catch the important price levels that supply and demand in the market are attractive for sellers and buyers.
Institutes and banks trade with huge order lots and they need a lot of sellers for their BUY or need a lot of buyers when they want to sell an asset.
They do that in special levels full of demand and supply trades. here you are.
What's the point?
This indicator actually shows the number of buyers and sellers waiting for that price by plotting the volume of supply and demand.
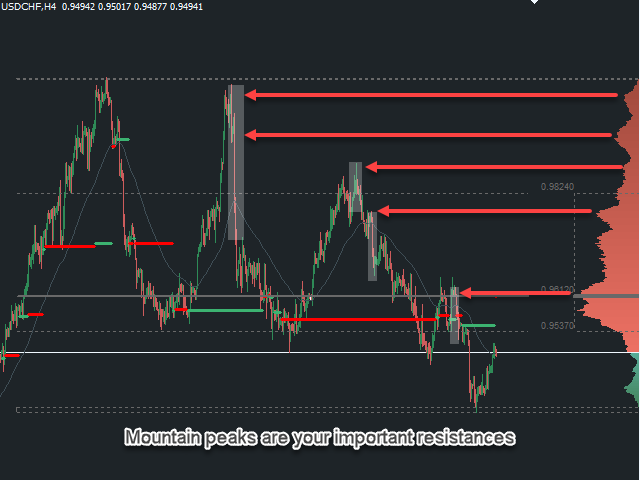
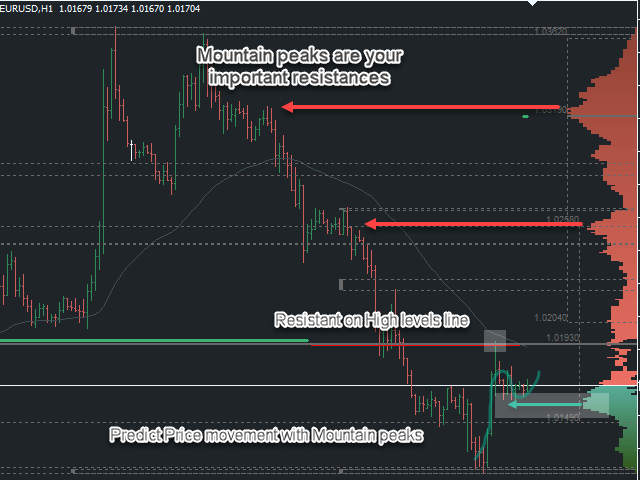
The peaks have the most people for buying and selling, and the valleys have the least demand for buying and selling.
As a result, buy and sell at the peaks and wait for the rapid passage of the price in the valleys.
What are you seeing on chart is your EXACTLY chart candles data. with zoom In or zoom out you can finde more infor from old candles.
How to use?
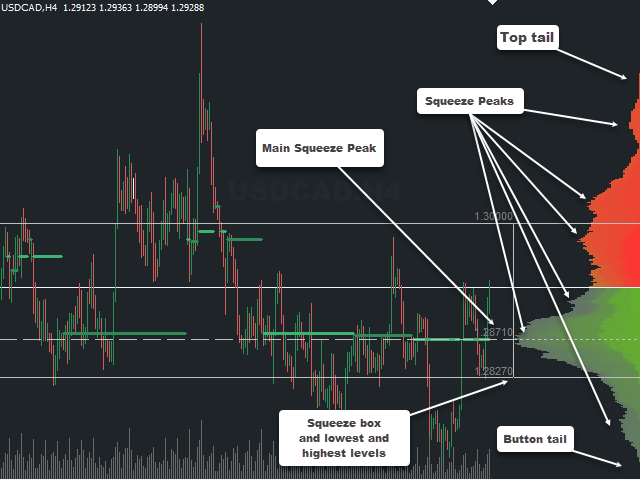
Squeeze Peaks: these areas with more buyers and sellers, Where price is attractive for bargaining between buyer and seller. So, these areas will be the place for the task of the next direction of market movement and can be used as reversal or pullback levels.
Squeeze valleys: All the long valleys, show the lowest attractive prices to buy or sells in the market. At these levels, There aren't enough buyers or sellers to trade. As a result, sellers of higher prices will quickly pass over this valley, in the same way, if strong buyers at the bottom of these valleys take their positions, the price will quickly reach the next top peaks. Because there is no disturbance for their transactions in the middle of the way. these levels are the best area to use as a take profit.
Squeeze box: is the most traded area, that shows you the asset price spends a lot of time there because the market trader acceptance to buy or sell and the price is attractive to them. and you can use the edge of this box, as your strong support or resistance levels.
Main Squeeze Peak, with the biggest peak level and offers a strong pivot point. It serves both as the attractor for the price and as the bounce level. The Main Squeeze is a fair price. If the market is below the level, it is considered undervalued. If it is above the median, it is overvalued and it's a strong level for trend changes and reversal areas.
Top and button tails: are areas where the price areas are rejected by the market. The button tails are telling us of long-term buyers outperform long-term sellers at those price levels. And the top tail is telling us about the long-term sellers, who sell better than buyers at the respective price levels.

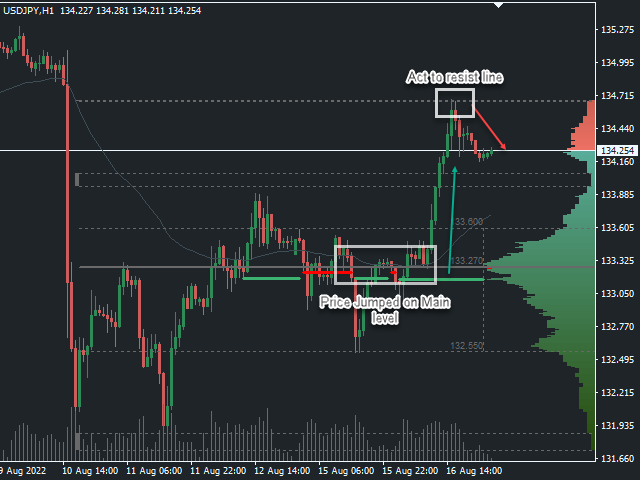
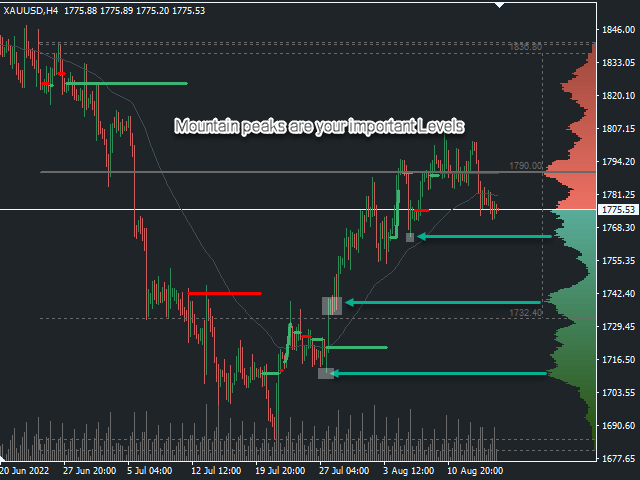
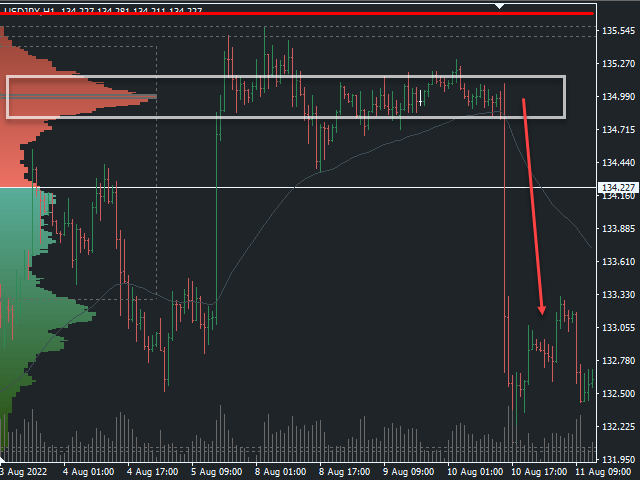























This indicator is very helpful, it gives an idea of the distribution of orders in each area. still haven't explored further, because it's only been used for a few days, there should be more help that can be obtained