• Übersicht
  • Bewertungen (4)
  • Diskussion (15)
  • Neue Funktionen

MR Volume POC Levels 4

5
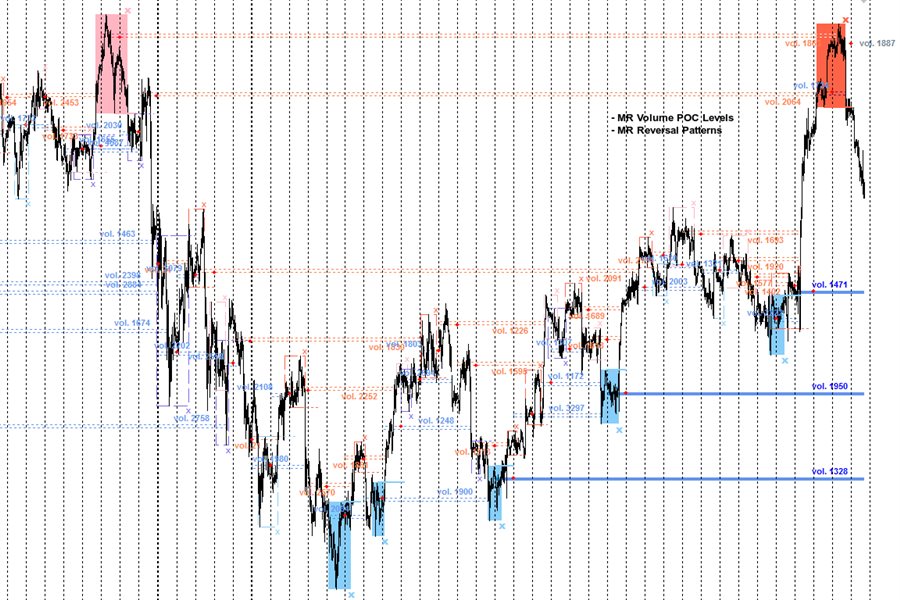
The most crucial price level in any "Volume Profile" is the "Point of Control". Is the price level with the highest traded volume. And mainly, is the level where the big guys start there their positions, so it's an accumulation/distribution level for smart money.

The idea of the indicator arose after the "MR Volume Profile Rectangles" indicator was made. When creating the "MR Volume Profile Rectangles" indicator, we spent a lot of time comparing the volumes with those from the volume profile in NinjaTrader 8 terminal with CQG datafeed. The settings of EURUSD-6E, GBPUSD-6B, AUDUSD-6A and other currency pairs were compared. After making sure that everything is working according to our requirements, we made the "MR Dynamic POC" indicator following the model used in NinjaTrader 8. Ultimately, we decided to take a step forward and create a new generation indicator that will track the actions of the "Big" players in the financial markets. This is how the "MR Volume POC Levels" indicator appeared. Over time, we further developed our idea...

Some of the most important benefits of the indicator are as follows:
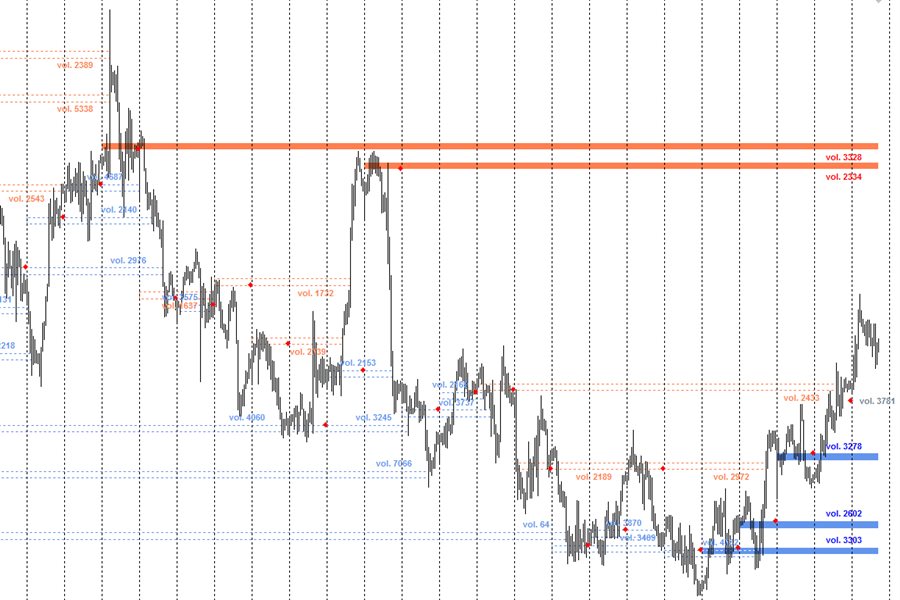
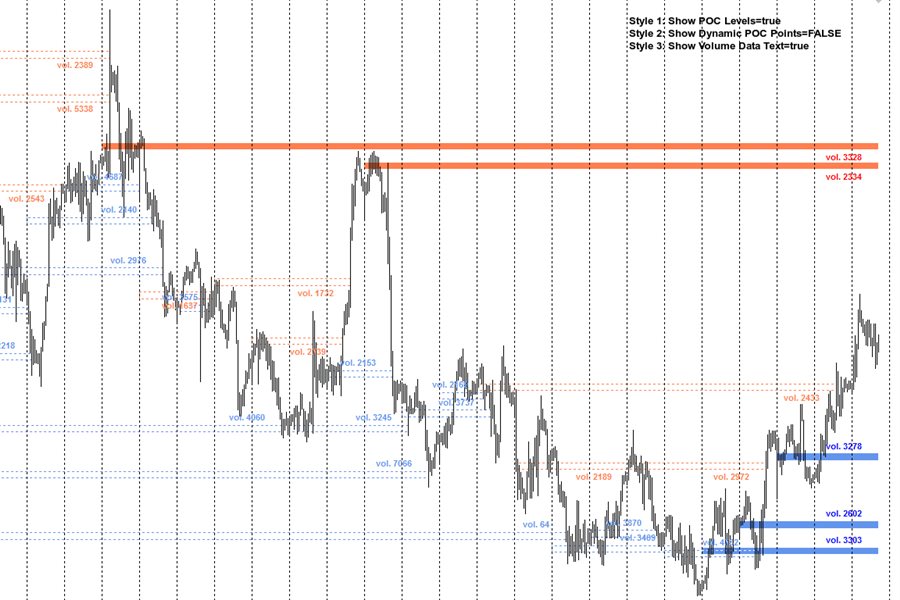
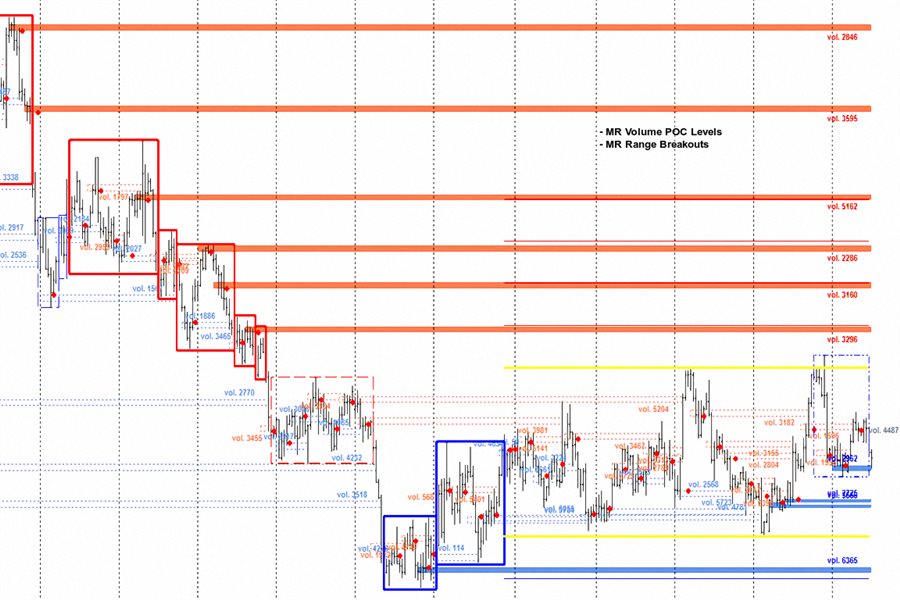
    • Indicator shows the POC (Point of Control) volume levels for the selected period of time.
    • "Point of Control" (POC) are not lines, they are zones.
    • Which zones are relevant and which are not, is determined by the author's methodology.
    • Using the indicator, you can track the actions of "Big" players in the market. At the extreme points of price movement (maximum, minimum), Market-Makers provide liquidity to "Big" players who change the direction of price movement.
    • At Volume POC Levels there is always a reaction. Whether the price movement will reverse its direction is decided only by the "Big" players in the market.
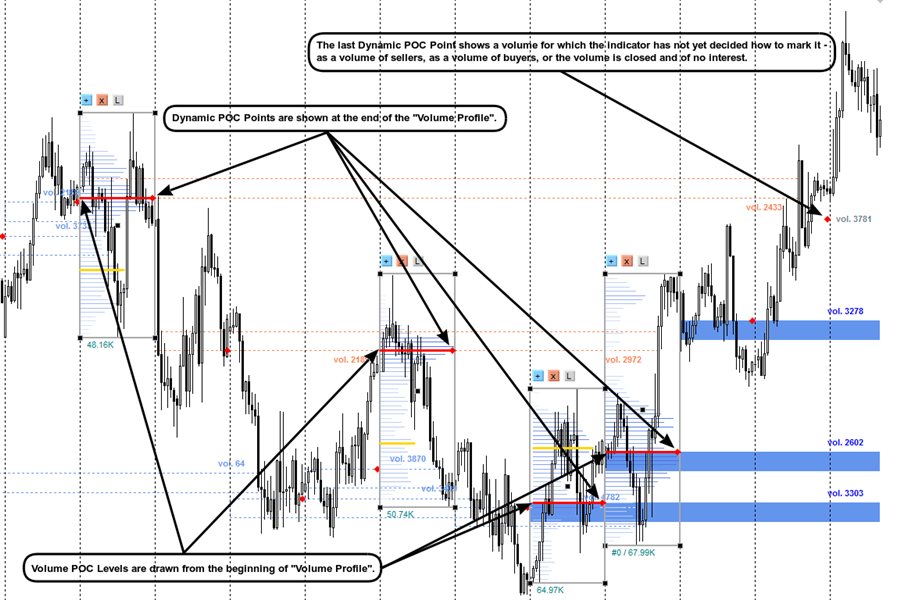
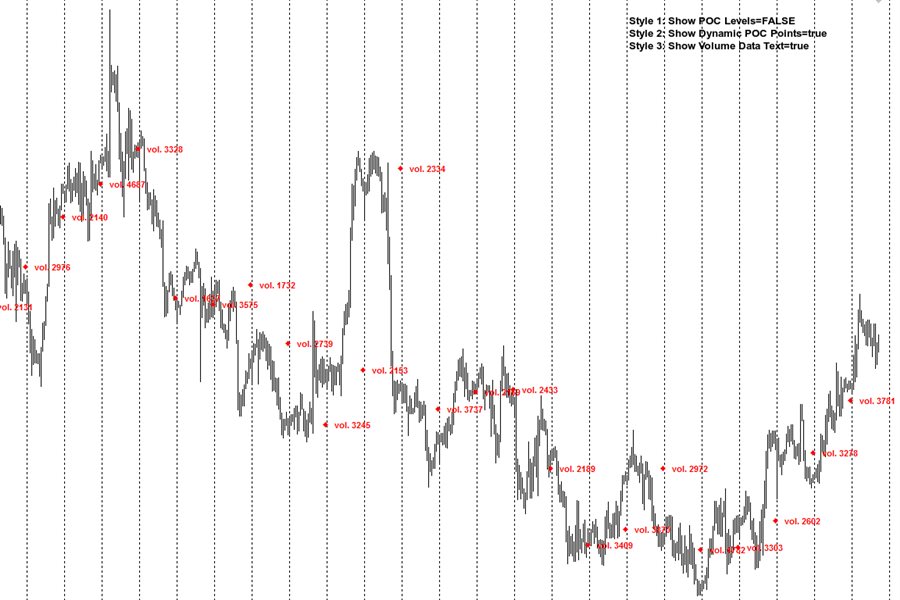
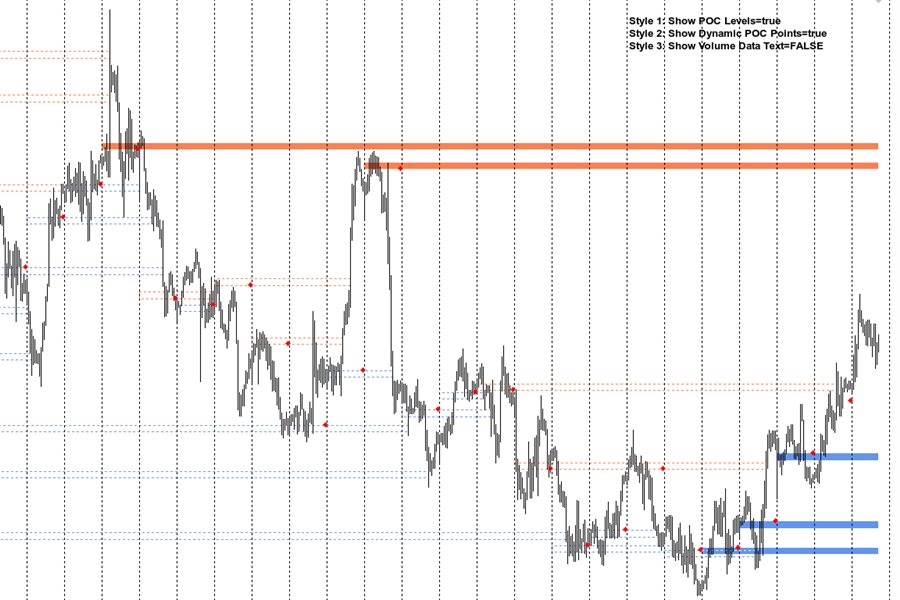
    • The indicator shows "points" from the new concept of the "MR Dynamic POC" indicator. Dynamic POC points are shown from the end of the "Volume Profile".
    • The last Dynamic POC Point (with gray text) shows a volume for which the indicator has not yet decided how to mark it - as a volume of sellers, as a volume of buyers, or the volume is closed and of no interest.
          • In combination with the "MR Range Breakouts" indicator, you can see where important volumes are left after the exit from the "Balances" and "Ranges". In addition, you can see how the volumes are absorbed in the "Range" and accumulate positions of buyers and sellers.
              • In combination with the "MR Reversal Patterns" indicator, you can track key places where volumes are absorbed and then new volumes appear in the opposite direction.
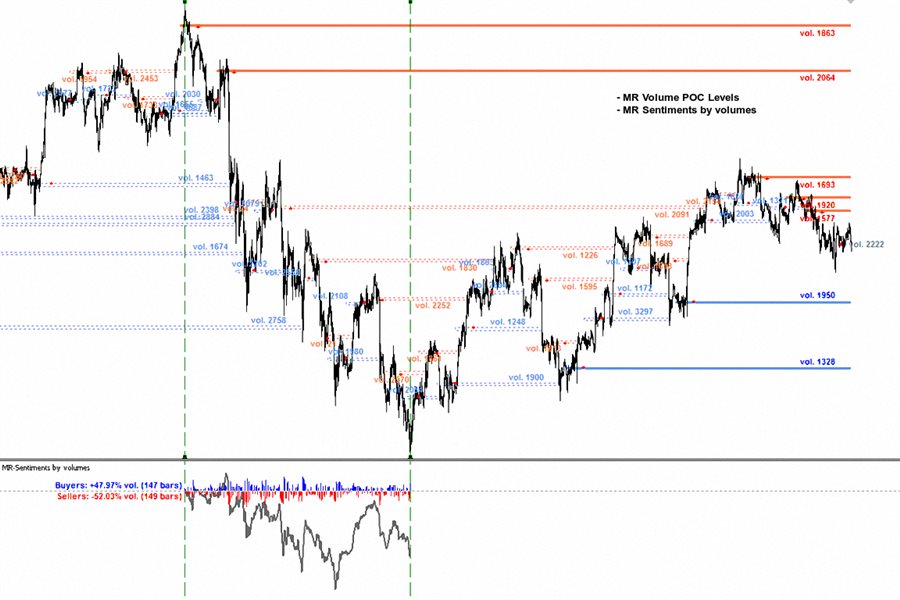
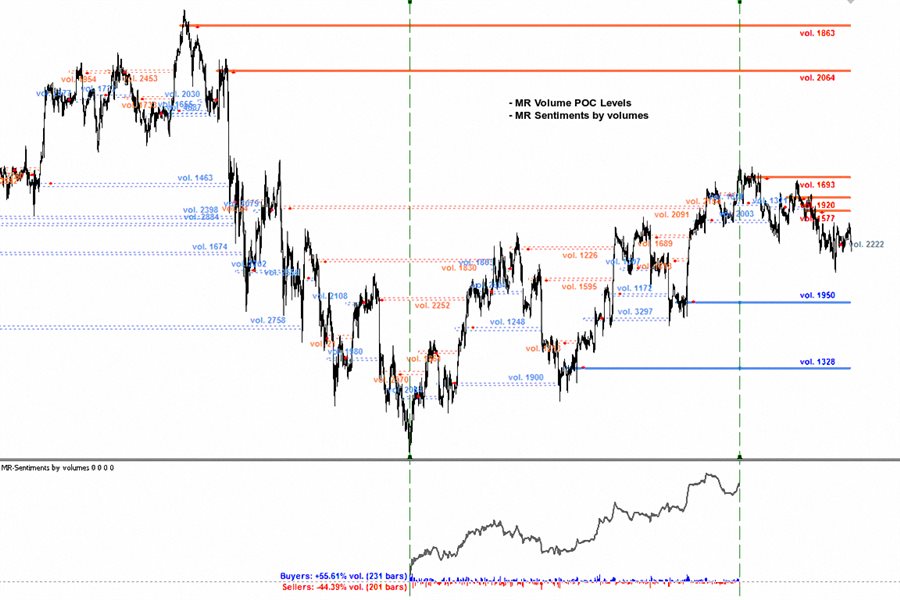
              • In combination with the "MR Sentiments by volumes" indicator, you can see when the volumes are used in the direction of the price movement and when the true reversal of the price movement occurs.
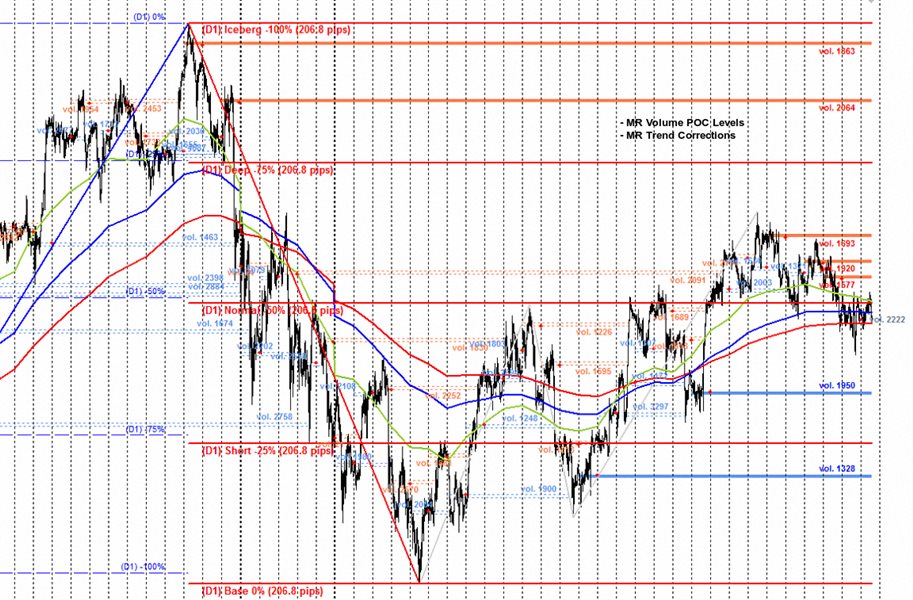
              • In combination with the "MR Trend Corrections" indicator, you can track the places where volumes are absorbed and accumulated. You will notice that in the "Impulse" movements, the volumes participate in the entrainment of the price movement in the direction of the "Impulse", and in the "Corrections" new places arise with volumes that keep the price movement in the range.
                • "MR Volume POC Levels 4" is based on indicator "VP: Volume Profile v6.0. © FXcoder".


                If you liked the indicator, please support our work by giving 5 stars!!!

                For MetaTrader 5 https://www.mql5.com/en/market/product/63565

                How to use indicators - Article


                Indicator settings:

                Points in 1 Pip - Offers you a choice of the number of Points in 1 Pip.
                Volume types - Offers you a choice to use tic volumes or real volumes. Note: To use real volumes, your Broker must provide them in the MetaTrader terminal.

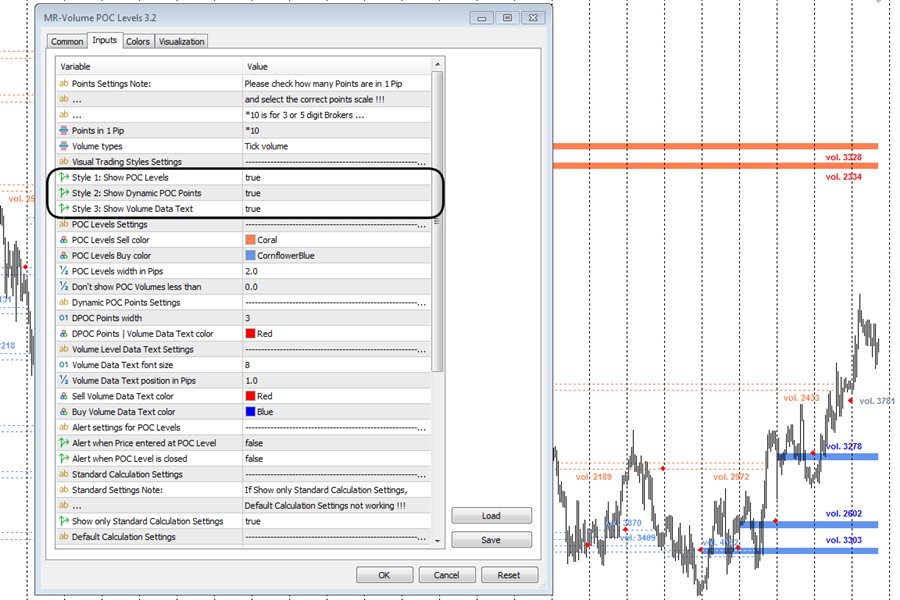
                Section "Visual Trading Styles Settings"
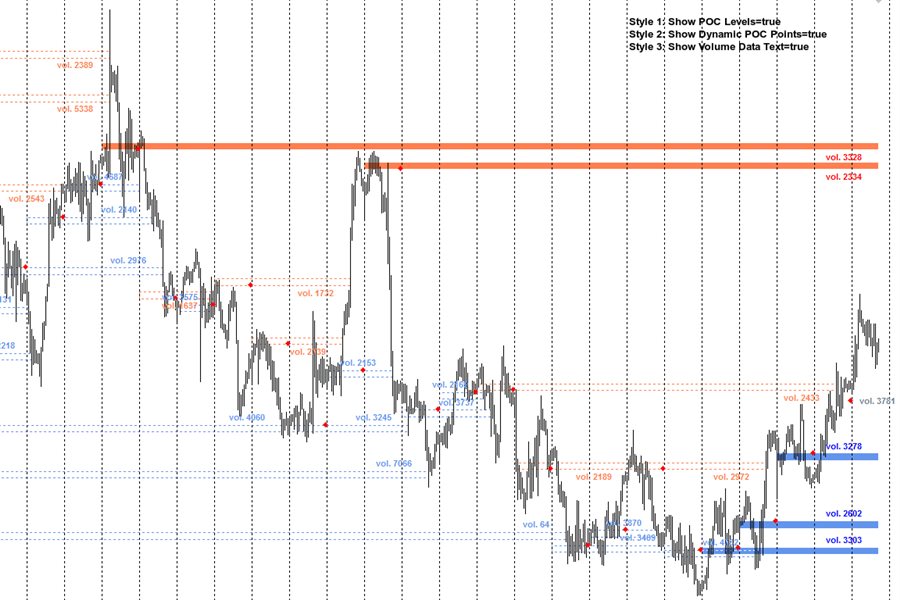
                Style 1: Show POC Levels - Shows or not Volume POC Levels. If the option is turned off, the option to show Dynamic POC Points is turned on by default.
                Style 2: Show Dynamic POC Points - Shows or not Dynamic POC Points.
                Style 3: Show Volume Data Text - Shows or not to display text with information about the amount of volumes for the POC level.

                Section "POC Levels Settings"
                POC Levels Sell color - Background color of POC Levels for Sell.
                POC Levels Buy color - Background color of POC Levels for Buy.
                POC Levels width in Pips - Specifies the width of the zone for POC levels in pips.
                Don't show POC Volumes less than - Filter to show or hide POC levels less than the specified amounts. When selected "0" displays all POC levels.

                Section "Dynamic POC Points Settings"
                DPOC Points width - Specifies the size of Dynamic POC Points.
                DPOC Points | Volume Data Text color - Specifies the color of Dynamic POC Points and data text.

                Section "Volume Level Data Text Settings"
                Volume Data Text font size - You can choose the data text size.
                Volume Data Text position in Pips - Position for displaying data text in pips.
                Sell Volume Data Text color - Data text color for Sell.
                Buy Volume Data Text color - Data text color for Buy.

                Section "Alert settings for POC Levels"
                Alert when Price entered at POC Level - Alert when price entered at POC Level.
                Alert when POC Level is closed - An alert occurs when the price closes the POC level.

                Section "Standard Calculation Settings"
                Show only Standard Calculation Settings - Enables or disables the default settings. If show only Standard calculation settings, Default calculation settings not working.

                Section "Default Calculation Settings"
                Default Number of Bars to calculate - Default number of Bars to calculate indicator.
                Default Volume Choice - You choose the volumes from which time frame to display on all lower time frames.

                Section "Standard Bars Calculation Settings"
                MN - Number of Bars to calculate - The number of monthly Bars to calculate the indicator.
                W1 - Number of Bars to calculate - The number of weekly Bars to calculate the indicator.
                D1 - Number of Bars to calculate - The number of daytime Bars to calculate the indicator.
                H4 - Number of Bars to calculate - The number of 4 hour Bars to calculate the indicator.
                H1 to M1 - Number of Bars to calculate - The number of Bars to calculate the indicator from a time frame lower than 4 hours.

                Section "Standard Volume Choice"
                In this section, you choose on which time frame to display the volumes of the time frame you have chosen for it...
                On D1 show Volumes from - W1
                On H4 show Volumes from - D1
                On H1 show Volumes from - D1
                On M30 show Volumes from - H4
                On M15 show Volumes from - H4
                On M5 show Volumes from - H4
                On M1 show Volumes from - H1

                  Bewertungen 4
                  elite luis
                  3351
                  elite luis 2023.03.27 04:44 
                   

                  Amazing POC indicator, Author is very Supportive and passionate to help user, Thanks alot :)

                  laptoplifestyle
                  1975
                  laptoplifestyle 2022.10.10 23:08 
                   

                  Really awesome indicator, very powerful! I reached out to Sergey and his team regarding a bug fix and he reached out right away and released an update the next day that fixed the issue! Thanks for your support and wanting to help =) Looking forward to using your other products =)

                  Empfohlene Produkte
                  Reverse side scalper is the manual trading system, that works on choppy(anti-trend) market. As a rule markets are on 80% choppy and only 20% is trend phase. System is based on custom step Moving and RSI and reverse pattern. System defines up movement, down movement, trend / choppy phases. Indicator plots Buy signal arrow when current direction is down and phase is trend, Sell signal arrow is plotted when currently is up movement and phase is trend. As a rule it allows to "catch" local maximum/mi
                  This indicator works on MT4 and is very easy to use. When you receive a signal from it, you wait for that candle with the signal to close and you enter your trade at the beginning of the next new candle . A red arrow means sell and a green arrow means buy. All arrows comes with Alert  like for easy identification of trade signal. Are you okay with that? 1 minute candle 1 minute expire
                  ADX Shark Scalper – The Ultimate Hybrid Indicator for Precision Scalping Dive into the markets with the ADX Shark Scalper , a powerful and versatile tool designed for traders who seek precision in every trade. This cutting-edge indicator seamlessly combines multiple advanced technical signals into one streamlined system, allowing you to spot good buy and sell opportunities with ease. At its core, the ADX Shark Scalper leverages the power of trend and momentum detection through the integration of
                  Adjustable Consecutive Fractals  looks for 2 or more fractals in one direction and sends out a on screen alert, sound alert and push notification, for strong reversal points . Adjustable Consecutive Fractals, shows the fractals on chart along with a color changing text for buy and sell signals when one or more fractals appear on one side of price. Adjustable Consecutive Fractals is based Bill Williams Fractals . The standard Bill Williams fractals are set at a non adjustable 5 bars, BUT withe
                  Max Volume
                  Maksim Slovakov
                  Подкрашивает аномально большие тиковые объёмы в красный цвет. Имеет следующие настройки: "Процент" по умолчанию "70"  (Процент на который аномальный объём должен быть больше предыдущего) "Уровень" по умолчанию "500" (Количество тиков, больше которого будем брать во внимание аномальный объём) Внимание! Данный индикатор был разработан для мелких таймфреймов M1,M5,M15. Идея в том, что на таких Таймфреймах увеличение количества тиков говорит об увеличении количество сделок, увеличения интереса к цен
                  The Binary Profit Maker,  This indicator works on MT4 and is very easy to use. When you receive a signal from it, you wait for that candle with the signal to close and you enter your trade at the beginning of the next new candle . A Up Purple arrow means Buy and a Down Purple arrow means Sell. All arrows comes with Alert  like for easy identification of trade signal. Are you okay with that? How To Enter Trade? 1 minute candle 1 minute expire
                  Swing trading is a method in which traders attempt to take advantage of market fluctuations. They buy a security when they believe the market will rise and sell if they feel the market will fall, which, as you can imagine, is common in most trading strategies, irrespective of trading style. The four most frequently occurring patterns in the swing trading domain are reversal, retracement (or pullback), breakouts, and breakdowns. it work all currency pair, and work all timeframe 100% non repa
                  In der Welt des Handels mit binären Optionen, wo präzise Marktanalyse und strategische Entscheidungsfindung von größter Bedeutung sind, ist die Suche nach einem außergewöhnlichen Handelsindikator, der profitable Möglichkeiten erschließen kann, endlos. Treten Sie ein in den Secret Indicator - ein bemerkenswertes MT4-Handelstool für binäre Optionen, das seinen Ruf als das Beste und Stärkste in seiner Klasse erworben hat. Der Secret Indicator ist das Ergebnis jahrelanger akribischer Forschung, E
                  In the age of speed, everyone wants to gets what he/she wants quickly. Trading is all about gaining money, and scalping is a way of doing it in a short time. The "Scorpion Scalper Pro" has been named on the scorpion because of its speed. The indicator serves to provide signals for the M15 timeframe. It also sends Alerts (window alert, email alert, push notification alert) whenever a buy/sell signal occurs, and the alerts are customizable (they can be turned ON or OFF). Indicator inputs : - Buy
                  **Vorstellung des Binary Smart Systems: Ihr ultimativer Handelsbegleiter** Das Binary Smart System ist nicht nur ein Indikator; es ist ein ausgeklügeltes Handelswerkzeug, das sorgfältig entwickelt wurde, um Händlern eine punktgenaue Genauigkeit und rechtzeitige Signale in verschiedenen Märkten zu bieten. Aufgebaut auf einer Grundlage aus hochmodernen Algorithmen und einer umfassenden Sammlung von technischen Indikatoren ist dieses System der Schlüssel, um Handelserfolg zu entfesseln. **Best
                  Urgently
                  Tatiana Savkevych
                  The Urgently indicator is designed to quickly determine the situation in the market, reflect the state of the market and signal profitable levels for opening trades. Market conditions change quickly enough, requiring constant calibration of trading strategies. Recommended for use in conjunction with any of the oscillators. The Urgently forex market trend indicator shows the trend direction and entry points. It smooths out price fluctuations when generating a signal by averaging the data and the
                  PRO Renko System ist ein hochpräzises Handelssystem, das speziell für den Handel mit RENKO-Charts entwickelt wurde. Dies ist ein universelles System, das auf verschiedene Handelsinstrumente angewendet werden kann. Das System neutralisiert effektiv so genannte Marktgeräusche, die Ihnen Zugang zu genauen Umkehrsignalen geben. Der Indikator ist sehr einfach zu bedienen und hat nur einen Parameter, der für die Signalerzeugung verantwortlich ist. Sie können das Tool einfach an jedes Handelsinstr
                  Dear Traders this is my another tool called " Swing Master Indicator ". As the name above the indicator is designed to help you in swing trading by capturing the low and highs of the price. You may us this tool with any trading strategy and style from scalping to position trading. It is made for level of traders including newbies and advanced traders even prop-firms, hedge funds and banks to help them make sold market analysis. I create tools for serious traders who want to make a difference in
                  Night ghost
                  Dmitriy Kashevich
                  Night Ghost - Pfeilanzeige für binäre Optionen. Dies ist ein zuverlässiger Assistent für Sie in der Zukunft! - Kein Neuzeichnen auf dem Diagramm -Funktioniert hervorragend bei allen Währungspaaren! - Anzeigegenauigkeit bis zu 90 % (besonders nachts) -Keine lange Einrichtung erforderlich (perfekt für binäre Optionen eingerichtet) - Keine späten Signale - Das Erscheinen eines Signals auf der aktuellen Kerze -Perfekt für die M1-Periode (nicht mehr!) - Augenfreundliche Kerzenfar
                  OFFER!   OFFER ! After 3 weeks the unlimited price will be 500$ and in the future you will regret why you didn't make a purchase at this lowest price. Dear Traders, the atomic power Entries Indicator is one of the indicators that if used wisely and correctly can help you to find an edge over the market.  The indicator will work for all forex pairs, all markets and all timeframes. Still it is your duty to find the most effective timeframe for you. When the sell or buy arrow appears you will get a
                  Indicator for binary options arrow is easy to use and does not require configuration works on all currency pairs, cryptocurrencies buy signal blue up arrow sell signal red down arrow tips do not trade during news and 15-30 minutes before their release, as the market is too volatile and there is a lot of noise it is worth entering trades one or two candles from the current period (recommended for 1 candle) timeframe up to m 15 recommended money management fixed lot or fixed percentage of the depo
                  Magic Oscilator
                  REIVER YOHAN MOLINA
                  Oszillator basierend auf Datenkonvergenz zwischen Volumen und Liquidität. Es wird empfohlen, es paarweise mit hohem Volumen und hoher Liquidität zu verwenden, z. B. EURUSD. Vorzugsweise in TF 4H oder höher. Wie benutzt man: Wenn die Linien in OVERPURCHASE konvergieren und sich kreuzen, wird empfohlen, zu verkaufen. Wenn die Linien in SURVEY konvergieren und sich kreuzen, wird der Kauf empfohlen. Bei Fragen stehe ich Ihnen gerne per Chat zur Verfügung. Wenn Sie es für eine Fälschung halten o
                  Pips Forex ist ein fertiges Handelssystem. Dieser Indikator zeigt mit Pfeilen im Diagramm an, wann und in welche Richtung Sie eine Order eröffnen müssen. Wenn der Pfeil grün ist, eröffnen wir ein Kaufgeschäft, und wenn der Pfeil rot ist, eröffnen wir ein Verkaufsgeschäft. Alles ist sehr einfach und sehr effektiv. TakeProfit setzt 15-25 Punkte. StopLoss auf Punktniveau eingestellt. Wenn sich die Punkte bewegen, überschreiben wir sofort den StopLoss. Empfohlener Zeitrahmen für den Handel mit M1 u
                  Quantum Currency Array Indicator
                  QUANTUM TRADING SOFTWARE LIMITED
                  This indicator has been developed to identify and display these trends quickly and easily, allowing you to see instantly, those currency pairs which are trending, and those which are not – and in all timeframes, with just one click. The 28 currency pairs are displayed as a fan as they sweep from strong to weak and back again, and this is why we call it the ‘currency array’. All 28 pairs are arrayed before you, giving an instant visual description of those pairs that are trending strongly, those
                  Blahtech VWAP
                  Blahtech Limited
                  5 (2)
                  Was: $69    Now: $34   Blahtech VWAP - Volume Weighted Average Price (VWAP) is the ratio of price to total volume. It provides an average price over a specified time interval.  Links [  Install  |  Update  |  Documentation   ] Feature Highlights Configurable VWAP Line Sessions, intervals, anchored or continuous Previous day settlement line Standard Deviation bands Alerts at bar close or real time Automatic Broker or Tick volumes Significantly reduced CPU usage Input Parameters Expert Advis
                  The indicator scans for stop grabber (special pattern of Joe Dinapoli which gives very high probability buy / sell signals and does not repaint ) signals in multiple timeframes for the all markets filtered and shows the results on Dashboard. Key Features Dashboard can be used for all markets It can scan for stop grabber pattern on MN1, W1, D1, H4, H1, M30, M15 ,M5, M1 timeframes Parameters UseMarketWatch: Set true to copy all symbols available in market watch MarketWatchCount : Set the numbe
                  Deal Trading SPT
                  Sukunthakan Ngernbamrung
                  Deal Trading SPT (Super Trend) is an indicator, shows the market trend direction, entry position, take profit level, stop loss level and trend strength. Utility Help to further filter and develop strategy to trade Market overview on the chart Stop loss and take profit calculation with market volatility Resistance and support for trialing stop No repaint after the finished bar Works in any timeframe and financial instrument, including forex, CFD and crypto etc. Message pop-up, notification wi
                  Scalping Snake Pro is a unique scalping indicator that shows the trader the price reversal moments and does not redraw. This indicator, unlike many others on the Internet, does not redraw its values. It draws signals on the very first bar, which allows you not to be late with opening deals. This indicator sends notifications to the trader by phone and email when a signal appears. You get all this functionality for only $147. How to trade with this indicator? Open the H1 timeframe. Currency pa
                  RelicusRoad Pro
                  Relicus LLC
                  4.64 (103)
                  Jetzt 147 US -Dollar (nach ein paar Aktualisierungen auf 499 US -Dollar) - Unbegrenzte Konten (PCs oder MACs) RelicusRoad Benutzerhandbuch + Schulungsvideos + Zugang zur privaten Discord-Gruppe + VIP-Status EINE NEUE ART, DEN MARKT ZU BETRACHTEN RelicusRoad ist der weltweit leistungsstärkste Handelsindikator für Forex, Futures, Kryptowährungen, Aktien und Indizes und gibt Händlern alle Informationen und Tools, die sie benötigen, um profitabel zu bleiben. Wir bieten technische Analysen un
                  TPO Profile MT4
                  Kyra Nickaline Watson-gordon
                  5 (1)
                  Definition : TPO is a Time Price Opportunity. Instead of using bars or candles with an Open, High, Low, and Close price, each "bar" in a Market Profile is represented by horizontal bars against the price It is called Market Profile terminology. In other words time-price-opportunity (TPO) profiles are histograms of how much time was spent at each price within the span of the profile. By using a TPO chart, you are able to analyze the amount of trading activity, based on time, for each price lev
                  Einführung: In der schnelllebigen Welt des binären Options- und Forex-Handels kann der richtige Werkzeugkasten und die richtigen Strategien den Unterschied zwischen Erfolg und Misserfolg ausmachen. Ein solches Werkzeug ist das BBB Black Blue Binary Option Indicator System, ein revolutionärer Ansatz für den Handel, der eine Kombination aus Chartmustern, Moving Averages und Handelsvolumen nutzt, um Trader bei der Entscheidungsfindung zu unterstützen. In diesem umfassenden Leitfaden werden wir in d
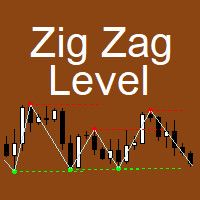
                  The indicator implements the author's approach to the construction of the popular "Zig-Zag" indicator. The advantages of the "ZIgZag Level" indicator is that it filters out market noise and shows levels. "ZIg Zag Level" is based on peaks and troughs, displays levels. These levels can be disabled and configured. The indicator displays the price of the level, the price tag can be disabled. The "zigzag" line between the points can also be disabled. The indicator has a built-in notific
                  The Market Sentiment Meter indicator calculates the saturation levels of the price chart. A signal to exit the oversold zone indicates a buying opportunity, and a signal to exit the overbought zone indicates a selling opportunity. Typically, for this indicator you need to set relative values for the overbought (Top) and oversold (Bottom) levels. Often a good trend can be seen visually on the price chart. However, an experienced trader must clearly understand the current distribution of forces
                  This is an algorithmic signal that mainly diagnoses the current direction based on data analysis, statistical algorithms, price breakout algorithms, and strategies based on some major indicators. This signal will display all the signals from a historical period on the main chart and is a good choice if you like to show the direction of the signals on the chart. Advantage: Suitable for all breeds. Applies to all cycles. Only one adjustable parameter, easy to use. Notice: This signal only provides
                  Oberis
                  Alfredo Jose Garcia Carrero
                  Möchten Sie Ihren Handel mit einem Orderblock-Indikator verbessern? Auftragsblöcke sind Bereiche des Marktes, in denen sich Kauf- oder Verkaufsaufträge anhäufen, die zu Trendänderungen oder starken Bewegungen führen können. Die Identifizierung dieser Orderblöcke kann sehr hilfreich sein, um Ein- und Ausstiegsmöglichkeiten zu finden sowie Risiken und Gewinne zu verwalten. Das manuelle Auffinden dieser Bestellblöcke kann jedoch schwierig und mühsam sein. Aus diesem Grund haben wir Oberis entwickel
                  Käufer dieses Produkts erwarben auch
                  TPSpro RFI Levels
                  Roman Podpora
                  4.82 (22)
                  ANWEISUNGEN    Russland -    ENG    Die Empfehlung basiert auf dem Indikator -   TPSpro   TREND PRO -   Version MT5 Die wichtigsten Elemente in der Branche sind entweder in Zonen oder in der Fabrik enthalten, oder sie führen zu einer Lösung bei einem Kauf oder dem Verkauf eines anderen Instruments. Wenn viele Menschen ihre Rechte nicht auf dem Händlerkonto verschlüsseln, werden die Folgen nicht schnell genug sein. Ich habe es damit abgeschlossen, dass ich diese Folgen nun noch interpretieren un
                  BITTE LESEN SIE DIE INFORMATIONEN UNTEN, BEVOR SIE DAS PRODUKT KAUFEN! Apollo Pips PLUS SP ist ein einzigartiges Produkt! ES IST FÜR ALLE, DIE MEINEN NEUEN „APOLLO PIPS“-INDIKATOR PLUS „SUPER PACK“-BONUS MIT ZUGRIFF AUF ALLE MEINE HANDELSINDIKATOREN ERHALTEN MÖCHTEN! Mit dem Kauf des Produkts Apollo Pips PLUS SP erwerben Sie tatsächlich eine völlig neue Version meines Apollo Pips-Indikators. Diese Version des Indikators verfügt über einen verbesserten Algorithmus und einen benutzerfreundlichen P
                  (Currently 30% OFF) Before reading the description of this indicator, I just want to introduce to you following concept Moving Average Line - Typical moving average which is based on one chart alone.  Currency Strength Line - The moving average of a certain pair in which the strength is based on 28 pairs. Can be said as the real moving average line. Moving Average indeed is one of the most popular indicator which almost every trader use. Currency Strength Meter is also a trend indicator whic
                  How to use Pair Trading Station Pair Trading Station is recommended for H1 time frame and you can use it for any currency pairs. To generate buy and sell signal, follow few steps below to apply Pair Trading Station to your MetaTrader terminal. When you load Pair Trading Station on your chart, Pair Trading station will assess available historical data in your MetaTrader platforms for each currency pair. On your chart, the amount of historical data available will be displayed for each currency pai
                  Bei diesem Indikator handelt es sich um einen Indikator für die automatische Wellenanalyse, der sich perfekt für den praktischen Handel eignet! Fall... Hinweis:   Ich bin es nicht gewohnt, westliche Namen für die Welleneinstufung zu verwenden. Aufgrund des Einflusses der Namenskonvention von Tang Lun (Tang Zhong Shuo Zen) habe ich die Grundwelle als   Stift   und das sekundäre Wellenband als   Segment   bezeichnet Gleichzeitig hat das Segment die   Trendrichtung   benannt (diese Benennungsmet
                  Dynamic Forex28 Navigator
                  Bernhard Schweigert
                  5 (2)
                  Dynamic Forex28 Navigator – Das Forex-Handelstool der nächsten Generation AKTUELL 49 % RABATT. Dynamic Forex28 Navigator ist die Weiterentwicklung unserer seit langem beliebten Indikatoren und vereint die Leistung von drei in einem: Advanced Currency Strength28 Indicator (695 Bewertungen) + Advanced Currency IMPULSE mit ALERT (520 Bewertungen) + CS28 Combo Signals (Bonus) Details zum Indikator https://www.mql5.com/en/blogs/post/758844 Was bietet der Strength Indicator der nächsten Generation?
                  Enigmera
                  Ivan Stefanov
                  5 (3)
                  ENIGMERA: Der Kern des Marktes https://www.enigmera.com Einführung Dieser Indikator und dieses Handelssystem sind ein bemerkenswerter Ansatz für die Finanzmärkte. ENIGMERA nutzt die fraktalen Zyklen zur genauen Berechnung von Unterstützungs- und Widerstandsniveaus. Er zeigt die echte Akkumulationsphase an und gibt Richtung und Ziele vor.  Ein System, das funktioniert, egal ob wir uns in einem Trend oder in einer Korrektur befinden.  Wie funktioniert es? ENIGMERA besteht aus drei Linien: der
                  Derzeit 20% Rabatt! Die beste Lösung für jeden Neueinsteiger oder Expert Händler! Dieses Dashboard arbeitet mit 28 Währungspaaren. Es basiert auf 2 unserer Hauptindikatoren (Advanced Currency Strength 28 und Advanced Currency Impulse). Es bietet einen hervorragenden Überblick über den gesamten Forex-Markt. Es zeigt die Werte der Advanced Currency Strength, die Veränderungsrate der Währungen und die Signale für 28 Devisenpaare in allen (9) Zeitrahmen. Stellen Sie sich vor, wie sich Ihr Hande
                  Currently Price 20% OFF ( for unlimited use )   BONUS  AUX VIP Club 2024 : Include  EA Airbag  and  Load Data History  to enhance the performance of this tool to its maximum potential  Click Here to Download Files   ( for users only )   Hello World! Introducing.. SMCpro VIP tool and Indicator for MetaTrader 4, designed to revolutionize your trading experience with the ICT Smart Money Concept. This system is meticulously crafted to empower traders with advanced insights and precision in
                  System Trend Pro
                  Aleksandr Makarov
                  5 (2)
                  System Trend Pro - This is the best trend trading indicator!!! The indicator no repaint!!!   The indicator has   MTF   mode, which adds confidence to trading on the trend (   no repaint   ). How to trade? Everything is very simple, we wait for the first signal (big arrow), then wait for the second signal (small arrow) and enter the market in the direction of the arrow. (See screens 1 and 2.) Exit on the opposite signal or take 20-30 pips, close half of it, and keep the rest until the oppo
                  Wir stellen Ihnen ON Trade Waves Patterns Harmonic Elliot Wolfe vor, einen fortschrittlichen Indikator, der entwickelt wurde, um verschiedene Markt-Muster mithilfe sowohl manueller als auch automatischer Methoden zu erkennen. Hier ist, wie er funktioniert: Harmonische Muster: Dieser Indikator kann harmonische Muster erkennen, die auf Ihrem Chart erscheinen. Diese Muster sind für Trader, die die Theorie des harmonischen Handels praktizieren, wie sie in Scott Carney's Buch "Harmonic Trading vol 1
                  Gold Channel is a volatility-based indicator, developed with a specific timing algorithm for the XAUUSD pair, which consists of finding possible corrections in the market. This indicator shows two outer lines, an inner line (retracement line) and an arrow sign, where the theory of the channel is to help identify overbought and oversold conditions in the market. The market price will generally fall between the boundaries of the channel. If prices touch or move outside the channel it is a tra
                  Gann Swing Structure
                  Kirill Borovskii
                  5 (1)
                  This indicator is based on the mathematics of the great trader W.D. Ganna. With its help, you can easily find strong levels by analyzing swings to find the optimal entry point. The indicator works on all instruments and all timeframes. The indicator is fully manual and has control buttons. All you need to do is press the NEW button, a segment will appear, which you can place on any movement, swing or even 1 candle that you want to analyze. By placing the segment, press the OK button. A grid (th
                  Der Forex TPA Indikator deckt die wahren Aktionen der Marktmacher auf, immer dann wenn sie passieren. "Kämpfe nicht gegen die Marktmacher an, sondern folge ihnen", ist wohl der beste Rat, den ein Trader bekommen kann. Der TPA Indikator zeigt jedesmal seine Signale an wenn die Bullen definitiv stärker sind als die Bären und umgekehrt. Dieser Indikator wurde VON Tradern FÜR Trader gemacht und ist 100% NICHT NACHZEICHNEND! Signale werden STRENG am Schluss einer Kerze  generiert. Das sagen unsere Ku
                  The Stochastic Basket Currency Strenght  brings the Stochastic indicator to a new level.  Expanding the boundaries of TimeFrames and mono-currency analysis, the SBCS take the movements of each currency that composes the cross and confront them in the whole basket of 7 crosses.  The indicator works with any combination of AUD, CAD, CHF, EUR, GBP, JPY, NZD, USD pairs and with full automation takes in account every stochastic value (main line) for the selected Time Frame.  After that, the indicator
                  Das Handelssystem Double Trend ist ein unabhängiges Handelssystem, das aus mehreren Indikatoren besteht. Bestimmt die Richtung des allgemeinen Trends und gibt Signale in Richtung der Preisbewegung. Kann für Scalping, Intraday- oder Intraweek-Handel verwendet werden. Möglichkeiten Funktioniert mit allen Zeitrahmen und Handelsinstrumenten (Forex, Kryptowährungen, Metalle, Aktien, Indizes). Einfaches visuelles Lesen von Informationen, ohne ein Diagramm laden zu müssen Der Indikator zeichnet
                  ECM Elite Channel is a volatility-based indicator, developed with a specific time algorithm, which consists of finding possible corrections in the market. This indicator shows two outer lines, an inner line (retracement line) and an arrow sign, where the channel theory is to help identify overbought and oversold conditions in the market. The market price will generally fall between the boundaries of the channel. If prices touch or move outside the channel, it's a trading opportunity. The
                  Bomb Bank Signal
                  Igor Pereira Calil
                  5 (1)
                  Bombenbanksignal: Ihr Vertrauensindikator in MetaTrader 4 Bomb Bank Signal ist ein leistungsstarker Indikator für MetaTrader 4, der entwickelt wurde, um die relevantesten Trends auf dem Finanzmarkt zu identifizieren. Wenn Sie nach einem Tool suchen, das Bewegungen genau vorhersieht, ist die Bomb Bank der Verbündete, den Sie brauchen. So funktioniert es: Dieser Indikator kombiniert drei unterschiedliche Methoden – Volumenanalyse, Kerzenschließungen und symmetrischer Trend –, um Kauf- und V
                  XQ Indicator MetaTrader 4
                  Marzena Maria Szmit
                  4 (4)
                  Step into the realm of Forex trading with confidence and precision using XQ, a cutting-edge Forex indicator designed to elevate your trading game to unprecedented heights. Whether you're a seasoned trader or just stepping into the world of currency exchange,   XQ Forex Indicator   empowers you with the insights and signals needed to make informed trading decisions. The signal conditions are a combination of three indicators, and XQ Forex Indicator only display  medium and long-term trends . The
                  Supply and Demand Dashboard PRO
                  Bernhard Schweigert
                  4.8 (20)
                  Derzeit 20% reduziert! Dieses Dashboard ist eine sehr leistungsfähige Software, die mit mehreren Symbolen und bis zu 9 Zeitrahmen arbeitet. Es basiert auf unserem Hauptindikator (Beste Bewertungen: Advanced Supply Demand ).   Das Dashboard gibt einen guten Überblick. Es zeigt: Gefilterte Angebots- und Nachfragewerte einschließlich der Zonenstärkebewertung, Pips-Abstände zu/und innerhalb von Zonen, Es hebt verschachtelte Zonen hervor, Es gibt 4 Arten von Alarmen für die gewählten Symbole in
                  TrendMaestro
                  Stefano Frisetti
                  5 (3)
                  note: this indicator is for METATRADER4, if you want the version for METATRADER5 this is the link:  https://www.mql5.com/it/market/product/108106 TRENDMAESTRO ver 2.4 TRENDMAESTRO recognizes a new TREND in the bud, he never makes mistakes. The certainty of identifying a new TREND is priceless. DESCRIPTION TRENDMAESTRO identifies a new TREND in the bud, this indicator examines the volatility, volumes and momentum to identify the moment in which there is an explosion of one or more of these data a
                  REMINDER: Early buyers hot price discount: Price subject to rise after first 20 copies. Starting price $65 and final price will be $1275. Secure your discounted copy Now! Smart Money Analyser Indicator User Manual 1. Introduction Welcome to the   Smart Money Analyser Indicator This powerful tool provides traders with comprehensive market analysis by combining various technical indicators to generate actionable trading signals. Designed to be user-friendly, this indicator helps traders of a
                  Introducing the South African Sniper indicator created by a small group of traders with a few years trading trading the financial market profitably . This is a plug and play indicator that provides you with  BUY and SELL (SNIPER ENTRY) signals with TARGET and trail stops. The indicator Works with all MT4 trading instruments. The indicator uses previous  chart data as receipt to speculate on future market moves.
                  NAM Order Blocks
                  NAM TECH GROUP, CORP.
                  5 (1)
                  MT4-Erkennungsanzeige für Auftragsblöcke mit mehreren Zeitrahmen. Eigenschaften - Vollständig anpassbar auf dem Diagrammbedienfeld, bietet vollständige Interaktion. - Verstecken und zeigen Sie das Bedienfeld, wo immer Sie möchten. - Erkennen Sie OBs in mehreren Zeiträumen. - Wählen Sie die anzuzeigende OB-Menge aus. - Verschiedene OBs Benutzeroberfläche. - Verschiedene Filter an OBs. - OB-Näherungsalarm. - ADR High- und Low-Leitungen. - Benachrichtigungsdienst (Bildschirmwar
                  Volume by Price MT4
                  Brian Collard
                  4.64 (11)
                  The Volume by Price Indicator for MetaTrader 4 features Volume Profile and Market Profile TPO (Time Price Opportunity). Volume and TPO histogram bar and line charts. Volume Footprint charts. TPO letter and block marker collapsed and split structure charts. Static, dynamic and flexible range segmentation and compositing methods with relative and absolute visualizations. Session hours filtering and segment concatenation with Market Watch and custom user specifications. Graphical layering, positio
                  Sneaky Busters 4
                  Mushfiq Faysal
                  5 (2)
                  This indicator is designed for those familiar with smart money concepts, specifically accumulation and distribution. It tracks subtle moves by institutional traders, not always aligned with traditional strategies. Ensure it fits your trading style by testing thoroughly before purchasing. Sneaky Buster is designed to help retail traders identify smart money moves. Traditional indicators often miss these subtle maneuvers, which inspired the creation of this tool. It effectively detects price cons
                  Indicator : RealValueIndicator Description : RealValueIndicator is a powerful tool designed specifically for trading on the EURUSD pair. This indicator analyzes all EUR and USD pairs, calculates their real currency strength values, and displays them as a single realistic value to give you a head start on price. This indicator will tell you moves before they happen if you use it right. RealValueIndicator allows you to get a quick and accurate overview of the EURUSD currency pair tops and bottoms,
                  Oni Scalper
                  Goh Cheng Wai
                  5 (2)
                  Dear Onis, This Indicator is used for   GBPUSD, US30 and GOLD on 1-Min Chart . For US30 , Depending on your broker, Minimum Lot Size will differ from 0.01 to 1.0 lots. My Current Account is trading at 1.0 lots at $1 per point . Please check with your Broker what's the Margin Required for your Minimum lot sizes before you trade on your Real account. I have Forward Tested the indicator for around 6 months before releasing it to the public. ( No Demo is available for the Indicator, Strategy
                  This indicator is based on the Gann Signal indicator and acts as a market scanner. All you need to do is fill in the selected currency pairs in the settings and that’s it. Next, the indicator itself will view all these currency pairs and time frames from M5 to D1 simultaneously. When a new signal appears, the indicator will give you an Alert and also draw the letter N where this new signal will be.
                  Bars Deflection
                  Victor Golovkov
                  5 (1)
                  The Bars Deflection trend indicator can be used with any trading pair and on any time frame. With this indicator it is impossible to miss the beginning of a trend. Use Bars Deflection as a standalone strategy or as an addition to yours. Signal arrows appear on the chart at the moment the bar opens and are located at the breakout level of the reverse movement. Thus, the arrows not only indicate the possible direction of movement of the quote, but also act as levels for analyzing the placement of
                  Weitere Produkte dieses Autors
                  MR Reversal Patterns 4
                  Sergey Khramchenkov
                  5 (2)
                  In the "Masters of Risk" trading system, one of the main concepts is related to places where markets change direction. In fact, this is a change in priority and a violation of the trend structure at the extremes of the market, where supposedly there are or would be stop-losses of "smart" participants who are outside the boundaries of the accumulation of volume. For this reason, we call them "Reversal Patterns" - places with a lot of weight for the start of a new and strong trend. Some of the imp
                  MR Dynamic POC 4
                  Sergey Khramchenkov
                  The most crucial price level in any "Volume Profile" is the "Point of Control" . Is the price level with the highest traded volume. And mainly, is the level where the big guys start there their positions, so it's an accumulation/distribution level for smart money. The idea of the indicator arose after the "MR Volume Profile Rectangles" indicator was made. When creating the "MR Volume Profile Rectangles" indicator, we spent a lot of time comparing the volumes with those from the volume profil
                  "Sentiments of traders" in the financial markets is a topic that has been of interest to us for a long time. In time, we could not find the right formula to define these sentiments. We went through many stages in the search for the right methodology - from taking data from external sources to calculate open positions of buyers and sellers to calculating tick volumes, but still we were not satisfied with the results. The calculation of open positions of buyers and sellers from external sources ha
                  A "Volume Profile" is an advanced charting indicator that displays total volume traded at every price level over a user specified time period. The main components of the volume profile are POC ( Point Of Control - the price level, at which the maximum number of contracts were executed during a selected period), VAH ( Value Area High - the highest price in the Value Area) and VAL ( Value Area Low - the lowest price in the Value Area). When we settled on the original indicator, we spent a lot o
                  A "Volume Profile" is an advanced charting indicator that displays total volume traded at every price level over a user specified time period. The main components of the volume profile are POC ( Point Of Control - the price level, at which the maximum number of contracts were executed during a selected period), VAH ( Value Area High - the highest price in the Value Area) and VAL ( Value Area Low - the lowest price in the Value Area). When we settled on the original indicator, we spent a lot o
                  MR Range Breakouts 4
                  Sergey Khramchenkov
                  5 (1)
                  " A trading range occurs when a financial instrument trades between constant high and low prices over a period of time. The upper part of the trading range of a financial instrument often provides price resistance, while the lower part of the trading range usually offers price support.  Traders can enter in the direction of a breakout or breakdown from a trading range... " This is the "Classical Theory" understanding of ranges. We have a different understanding of the nature of ranges and th
                  We publish the indicator as a useful tool in trading and call this indicator the "Swiss Army Knife" because it provides many possibilities and combinations to help understand the material on the "Masters of Risk" trading system. The indicator itself is not part of the tools used in the "Masters of Risk" trading system. The indicator consists of 3 separate multi-timeframe indicators, which in combination with each other help to reduce the "noise" of false signals. The first of the indicators ar
                  MR Reversal Patterns 5
                  Sergey Khramchenkov
                  5 (1)
                  In the "Masters of Risk" trading system, one of the main concepts is related to places where markets change direction. In fact, this is a change in priority and a violation of the trend structure at the extremes of the market, where supposedly there are or would be stop-losses of "smart" participants who are outside the boundaries of the accumulation of volume. For this reason, we call them "Reversal Patterns" - places with a lot of weight for the start of a new and strong trend. Some of the im
                  MR Range Breakouts 5
                  Sergey Khramchenkov
                  5 (2)
                  " A trading range occurs when a financial instrument trades between constant high and low prices over a period of time. The upper part of the trading range of a financial instrument often provides price resistance, while the lower part of the trading range usually offers price support.  Traders can enter in the direction of a breakout or breakdown from a trading range... " This is the "Classical Theory" understanding of ranges. We have a different understanding of the nature of ranges and th
                  The most crucial price level in any "Volume Profile" is the "Point of Control" . Is the price level with the highest traded volume. And mainly, is the level where the big guys start there their positions, so it's an accumulation/distribution level for smart money. The idea of the indicator arose after the "MR Volume Profile Rectangles" indicator was made. When creating the "MR Volume Profile Rectangles" indicator, we spent a lot of time comparing the volumes with those from the volume profil
                  MR Dynamic POC 5
                  Sergey Khramchenkov
                  The most crucial price level in any "Volume Profile" is the "Point of Control" . Is the price level with the highest traded volume. And mainly, is the level where the big guys start there their positions, so it's an accumulation/distribution level for smart money. The idea of the indicator arose after the "MR Volume Profile Rectangles" indicator was made. When creating the "MR Volume Profile Rectangles" indicator, we spent a lot of time comparing the volumes with those from the volume profil
                  We publish the indicator as a useful tool in trading and call this indicator the "Swiss Army Knife" because it provides many possibilities and combinations to help understand the material on the "Masters of Risk" trading system. The indicator itself is not part of the tools used in the "Masters of Risk" trading system. The indicator consists of 3 separate multi-timeframe indicators, which in combination with each other help to reduce the "noise" of false signals. The first of the indicators ar
                  "Sentiments of traders" in the financial markets is a topic that has been of interest to us for a long time. In time, we could not find the right formula to define these sentiments. We went through many stages in the search for the right methodology - from taking data from external sources to calculate open positions of buyers and sellers to calculating tick volumes, but still we were not satisfied with the results. The calculation of open positions of buyers and sellers from external sources ha
                  Auswahl:
                  elite luis
                  3351
                  elite luis 2023.03.27 04:44 
                   

                  Amazing POC indicator, Author is very Supportive and passionate to help user, Thanks alot :)

                  Sergey Khramchenkov
                  2153
                  Antwort vom Entwickler Sergey Khramchenkov 2023.03.27 06:41
                  Thank you!!!
                  danmar
                  1556
                  danmar 2022.12.30 09:13 
                   

                  Der Benutzer hat keinen Kommentar hinterlassen

                  Sergey Khramchenkov
                  2153
                  Antwort vom Entwickler Sergey Khramchenkov 2022.12.30 10:34
                  Thank you!!!
                  laptoplifestyle
                  1975
                  laptoplifestyle 2022.10.10 23:08 
                   

                  Really awesome indicator, very powerful! I reached out to Sergey and his team regarding a bug fix and he reached out right away and released an update the next day that fixed the issue! Thanks for your support and wanting to help =) Looking forward to using your other products =)

                  Sergey Khramchenkov
                  2153
                  Antwort vom Entwickler Sergey Khramchenkov 2022.10.11 06:27
                  Thank you !!!
                  Roman Kovalenko
                  1050
                  Roman Kovalenko 2021.10.12 07:36 
                   

                  хорошая работа.Достойный индикатор.

                  Sergey Khramchenkov
                  2153
                  Antwort vom Entwickler Sergey Khramchenkov 2021.10.13 19:26
                  Спасибо !!!
                  Antwort auf eine Rezension
                  Version 3.2 2023.03.15
                  - Fixed some technical details.
                  Version 3.1 2022.12.16
                  - Fixed some technical details in the program code.
                  Version 3.0 2022.12.02
                  - Updated the formula for determining which Volume POC Levels to keep showing.
                  - Added the display of Points from Dynamic POC indicator. Volume POC Levels are drawn from the beginning of the Volume Profile and Dynamic POC Points are shown from the end of the Volume Profile.
                  Version 2.1 2022.10.09
                  - Corrected the problem with determining the history of the indicator calculation bars.
                  Version 2.0 2022.09.01
                  - The indicator automatically selects the data source (from M1, M5, M15 or M30 timeframes).
                  - The indicator automatically determines the height of the Volume POC Levels (zones).
                  - Fixed some technical issues.
                  Version 1.31 2021.03.16
                  Fixed an issue with the alert when selecting a TF lower than H4.