• Übersicht
  • Bewertungen (2)
  • Diskussion (12)
  • Neue Funktionen

SmartMass

5

SMARTMASS INDICATOR

This indicator is different from all known volume indicators. It has a significant distinction; it is an algorithm that relates price movement to volume, attempting to find proportionality and efficient movement while filtering out noise and other movements that are more random and do not follow a trend or reversal. Ultimately, it reveals the true strength of the movement, indicating whether it has genuine support from bulls or bears or if it's merely a high-volume movement that explains trading account balancing, a typical occurrence, for example, at the end of a sessions.

It doesn't matter whether we have real volume or tick volume. If the broker is large enough, tick volumes are correlated with real volume. This indicator provides an approximate but reality-adjusted information that assists you in making better decisions, increasing the probability of success.


INPUT PARAMETERS

General Parmeters:

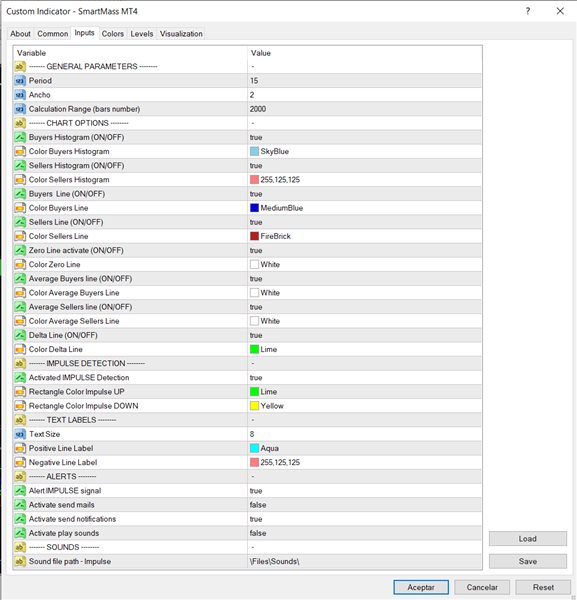
  • Period: Period for the calculation of the SmartMass algorithm. The recommended value is 15. It has been tested on all typical timeframes and on different currency pairs, metals, indices, and commodities.
  • Width:  Line width of the histogram. Default value: 2.
  • Calculation Range: The number of candles that the algorithm will consider to calculate the different lines of the SmartMass indicator. The default value is 2000. This is enough value for chart analysis; a higher value it will require more CPU load.
Chart Options:
  • Active / Inactive (ON/OFF):  To enable or disable each of the lines or objects that are part of the indicator
  • Color: Selection of color for each of the lines or objects
Impulse Detection:
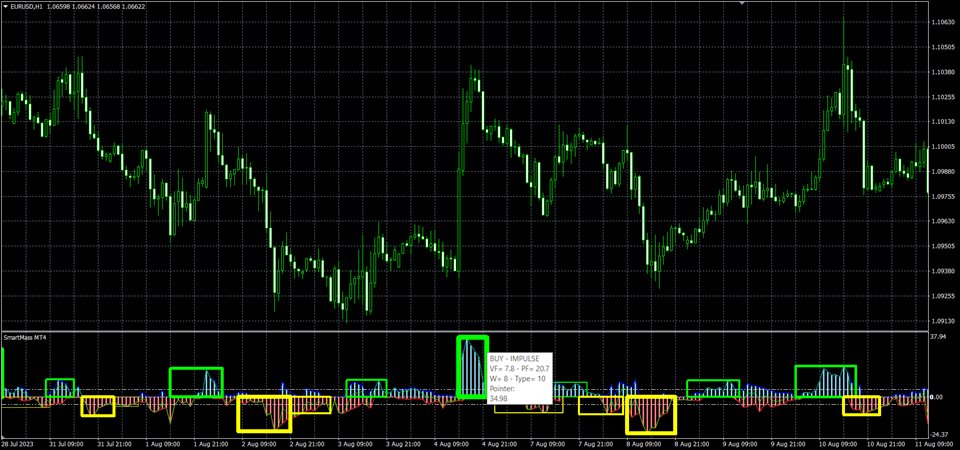
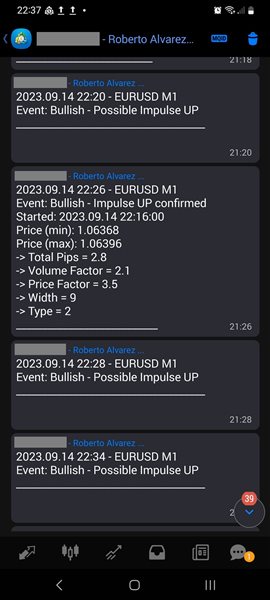
  • Activate Impulse Detection:  Enable or disable the impulse detection algorithm. This algorithm will detect relevant (bearish and bullish) impulses using rectangle-shaped graphical objects
  • Color: Selection of color for bearish rectangle and bullish rectangle

Alerts:

  • Activate Alert impulse signal
  • Activate send mails
  • Activate send Notifications
  • Activate play sounds

    Sounds:

    • Sound file path - Impulse: Specify the file path of the sound file that the user wants to play when an impulse is detected.


      FEATURES

      The indicator is composed of the following lines, curves:

      • Positive volume line
      • Positive volume histogram
      • Negative volume line
      • Negative volume histogram
      • Average positive volume
      • Average negative volume
      • Delta signal (effective volume)
        and the following type of objects;
        • Rectangle objects (Bullish impulses)
        • Rectangle objects (Bearish impulses)
        • Bullish arrow price 
        • Bearish arrow price
        • Labels


          HOW CAN THE SMARTMASS INDICATOR HELP US?

          The SmartMass indicator is a tool that assists traders in the following ways:

          1. Detects significant movements where there is a clear intent by bulls or bears: The SmartMass indicator can identify significant market movements in which participants, whether bulls or bears, display a clear intent. This means it can help traders identify moments when a significant change in price direction is occurring, which can be useful for making trading decisions.

          2. Helps to better understand the balance between volume and price: The SmartMass indicator also provides information about the relationship between volume (whether tick volume or trading volume) and price. This is important because most of the time, the market is in a range or channel where prices move sideways. However, strong breakouts or trend changes occur only about 10% of the time. The indicator allows traders to anticipate when the balance between volume and price is tilting one way or the other, enabling them to prepare strategies accordingly. In other words, it helps identify moments when the market may be on the verge of breaking out of its usual range or channel, presenting an opportunity to capitalize on significant price movements.

          3. The SmartMass indicator can be considered a valuable addition to Price Action analysis in trading. Price Action analysis is based on the study of price movements and patterns on the chart, without relying on external technical or fundamental indicators. In this context, the SmartMass indicator can provide additional and objective information that can assist traders in making more precise and informed decisions.


          IMPULSE CONCEPT IN THE SMARTMASS INDICATOR

          The SmartMass indicator not only helps in detecting impulses on chart but also categorizes it based on three key parameters: amplitude, width, and price effect. These three parameters are used to assign a numerical value to each momentum, ranging from 1 to 10. Here's how this classification works:

          • Amplitude (VF): Amplitude refers to the magnitude or strength of the momentum. The higher the amplitude, the stronger the momentum. In the context of the SmartMass indicator, it evaluates how much the price changes during the momentum and assigns a numerical value based on that magnitude. Larger momentums will receive a higher score.

          • Width (W): Width refers to the duration of the momentum in terms of time (number of candles). A wider momentum is one that extends over a longer period. The SmartMass indicator assesses how long the momentum lasts and assigns a numerical value based on its duration. Longer-lasting momentums will receive a lower score.

          • Price Effect (PF): This parameter evaluates how the momentum affects the price. For example, a momentum that causes a significant price breakout or a trend change will have a stronger effect on the price than a momentum that only leads to a minor movement. The SmartMass indicator analyzes the impact of the momentum on the price and assigns a numerical value based on its significance in price change. Momentums that have a more notable effect on the price will receive a higher score.

          • Classification (Type): The SmartMass indicator uses these three parameters (amplitude, width, and price effect) to classify momentums on a scale from 1 to 10, where 1 represents weaker and less significant momentums, and 10 represents stronger and more significant momentums in the market.

          To view this classification and the different parameters that make up the momentum, simply position the mouse pointer over the rectangle. The information is displayed through a floating label.


          Bewertungen 2
          sastiwoo
          176
          sastiwoo 2022.10.24 20:41 
           

          I like it. I doubt I'm using it in the way it's intended, but as a component in my system it's a useful little tool. The author was also really helpful in assisting with queries. Many thanks!

          jiab
          436
          jiab 2022.10.21 15:09 
           

          new version ok

          Empfohlene Produkte
          FX EurUsd Robot MT4
          Marzena Maria Szmit
          5 (7)
          The EUR/USD Multi-Strategy Trading Robot MT4 is an advanced tool designed to optimize trading by combining 3 key systems:   daily trading, volume analysis, and Fibonacci   retracement levels. This robot works by integrating these different approaches to create a more dynamic and adaptable strategy for trading the   EUR/USD pair . EA adapts to different market conditions, this makes it an ideal solution for traders looking to enhance their trading strategy with a powerful, multi-faceted approach.
          Kill Zones MT4
          Diego Arribas Lopez
          MT5 Version Kill Zones Kill Zones allows you to insert up to 3 time zones in the chart. The visual representation of the Kill Zones in the chart together with an alert and notification system helps you to ignore fake trading setups occurring outside the Kill Zones or specific trading sessions. Using Kill Zones in your trading will help you filter higher probability trading setups. You should select time ranges where the market usually reacts with high volatility. Based on EST time zone, followi
          Bermaui Channel
          Muhammad Elbermawi
          5 (19)
          This is a price channel that shows five important price levels on the chart. Those levels are: 1. The Highest High (HH) of the previous x bars. 2. The Highest Low (HL) of the previous x bars. 3. The Center Line. 4. The Lowest High (LH) of the previous x bars. 5. The Lowest Low (LL) of the previous x bars. How does Bermaui Channels Captures Overbought  area Think of the distance between HH and HL levels as an overbought area. When the price candles or bars crosses the HL to the upside this
          This is a fully automatic Expert Advisor. It can trade any market, any timeframe and any currency pair. The EA uses simple indicators like SMA, RSI and CCI, and a smart martingale system, that does not open systematical new positions, but waits for a new signal for each new order, wich is limiting drawdown compared to other martingale systems. It uses a combination of seven strategies you can select in the parameters to fit your needs. The strategy tester in MetaTrader 4 can give you the setup y
          The Transition Trend indicator shows the points of potential market reversal. The indicator's smart algorithm detects the trend, filters out market noise and generates entry signals and exit levels. Simple, visual and efficient trend detection. Uses just one parameter for settings. The indicator does not redraw and does not lag. You can set up message alerts as sound or email. Works on all currency pairs and all timeframes. Ready-made trading system.
          MaxProfitDz v4
          Hafis Mohamed Yacine
          MaxProfitDZ Expert adviser MaxProfitDz v1.4     Recommendations Symbol: ALL PAIRS ..i Recommended    EURUSD. Time Frame:1M. Brokers: ALL brokers .  low spread/commission, 1:500 leverage Minimum Deposit Recommended :   $500 USD  Lot Size for 500$   : 0.01  Use a broker with good execution and with a spread of 0.1-2 points. A very fast VPS is required Parameters EA TrendON=true (Read the  note ) MMType = 2 LotMultiplikator = 1 LotConst_or_not = TRUE Take profit :5-10 pips  for accounts with fi
          Allows you to find the average volatility / expected price movement for ANY custom period starting at ANY time of day. Simply set a vertical line at the desired entry time and calculate your TP target within the expected volatility range.  Indicator places 5 custom vertical lines on chart at the same times each day throughout the history + gives live alerts with custom text each day. 1. Get the average price movement / volatility of ANY   time period starting at each vertical line, so you know h
          Trend Monitor VZ
          Sergey Ermolov
          3.67 (3)
          MT5-Version  | Valable ZigZag-Indikator |  FAQ Die Elliott-Wellen-Theorie ist eine Interpretation der Vorgänge auf den Finanzmärkten, die auf dem visuellen Modell der Wellen auf den Kurscharts beruht. Nach dieser Theorie können wir genau wissen, welcher Trend am Markt gerade vorherrscht, aufwärts oder abwärts. Der Valable ZigZag-Indikator zeigt die Wellenstruktur des Marktes an und gibt die Richtung des aktuellen Haupttrends auf dem aktuellen Zeitrahmen an. Zu Ihrer Bequemlichkeit zeigt der T
          Graphic Shapes -using history, it projects four types of graphical shapes at the moment, allowing you to determine the main ranges of price movement in the future, as well as gives an understanding of the main market reversals, while giving entry points by priority!The panel contains three types of figure sizes expressed by timeframes. They allow you to conduct a complete market analysis without using additional tools! The indicator is a powerful tool for forecasting price movements in the forex
          PowerXXX
          Marco Fornero Monia
          PowerXXX measures the power of the current candlestick and displays it in numerical format and colors. The indicator can cover multiple timeframes and can be placed on the main chart or on the charts of the underlying indicators. The number of timeframes is selectable, as well as the color levels according to the power expressed. In the latest version, the power can be expressed as a function of the opening of the candle itself or as a function of the opening of the total candles before. There
          The advantages of EA TWO CANDLE SMART are: It is equipped with various filters, including: maxspread, maxlot, takeprofit (4 step), stop loss (3 step), profit target per day, and many more. Open order BUY = If iClose[2] > iOpen[2] && iClose[1] > iOpen[1]. Open order SELL = If iClose[2] < iOpen[2] && iClose[1] < iOpen[1]. Target_profit_perday=50; ==> can work on forward test. lockprofit=2;//Minimal Profit in money Step_LockProfit_in_Money=25; Stoploss_in_Money=1000; Stoploss_in %=50;==> Stoplos
          MicroMini FFMV Dashboard and CSM
          Opengates Success International
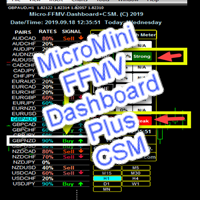
          MicroMini FFMV Dashboard+CSM This is a custom indicator created to give Traders a full view of what is going on in the market. It uses a real time data to access the market and display every bit of information needed to make successful trading. To add value to the trading operation, Currency Strength Meter is added to it in order to consolidate the effective work of this indicator. THIS IS A MicroMini size of the FULL FOREX MARKET VIEW DASHBOARD INDICATOR with CSM added. This is for those who
          Global Trend
          Vitalii Zakharuk
          Global Trend Indicator, shows the signals for entry. Displays both entry points and the trend itself. Shows statistically calculated moments for entering the market with arrows. When using the indicator, the risk factor can be optimally distributed. Settings: Uses all one parameter for settings. Choosing a parameter, it is necessary to visually resemble it so that the appropriate graph has a projection of extremes. Parameters: Length - the number of bars for calculating the indicator.
          Cuervo Candles Scalping II
          Cristobal Hidalgo Soriano
          Características principales: Estrategia de scalping : El Crow Candles Scalping EA se enfoca en aprovechar movimientos rápidos en el mercado . La estrategia se basa en la identificación de patrones de velas y análisis técnico para tomar decisiones de entrada y salida. 2.Gestión de riesgos avanzada: El EA incorpora una gestión de riesgos sólida para proteger tu cuenta de operaciones. Puedes ajustar los parámetros de stop-loss y take-profit para adaptar el nivel de riesgo a tus preferencias. 3.Co
          MQL Trendline EA
          Martin Eshleman
          1 (1)
          Summary This EA will trade semi-automatically based on trend lines or horizontal lines that are manually plotted on the chart by the user. It can handle any number of lines per chart and each line can have its own adjustable settings. This EA manages every line separately based on specific user 'keywords' set for each line. Since each line has it's own independent settings, this is why there are very few shared inputs in this EA. Doing it this way allows for a single EA to manage many lines and
          FREE
          Euro Trend es un EA que opera en el par EURUSD,en temporalidad de 15 minutos. Es un robot que busca encontrar puntos de entrada cuando se producen cambios en la tendencia, usando dos indicadores técnicos principalmente, el RSI y el Bull/Bear Power.  Para máximizar el beneficio y aprovechar los movimientos fuertes de la tendencia no se usa Profit fijo,dejando así  correr las ganancias.  No se usan sistemas de GRID,ni martingala,así como estrategias de entrada en las aperturas de mercado,ni moment
          Mr Beast Trend Reverse
          Luis Mariano Vazquez Marcos
          MR BEAST TREND REVERSE RECOMENDED H1 EUR USD La estrategia "Trend Reverse" en el mercado de divisas (Forex) es un enfoque utilizado para identificar puntos de reversión de tendencias y capturar cambios de dirección en los precios de los pares de divisas. Esta estrategia se basa en la premisa de que las tendencias del mercado no duran para siempre y que se producirán puntos de inflexión. Este robot de trading de Forex ha sido desarrollado por MRBEAST como una herramienta para facilitar el trading
          Signal Eskiya
          Vitalii Zakharuk
          Signal Eskiya, in addition to channel lines, reflects entry signals in the form of arrows. Trading strategies using the channel indicator belong to the classic methods of technical analysis, are easy to execute, and therefore available even to beginners. Price ranges work equally well on any trading assets and timeframes, they can be used both independently and with additional confirmation from oscillators and market volumes. American traders say: “Trend is your friend”, which means “Trend is
          Long term stats is a trend indicator.  As the name suggests, it computes long term running average, standard deviation and min/max values Average and standard deviation are plotted on the graph and deviation value is taken as input parameter (similarly to bollinger bands). Historical minimum and maximum are plotted on the graph and updated for each bar, considering historical time series slope. (this is to somehow account for inflation/deflation) Can be used as filter for signals, as trigger to
          FREE
          This product makes your trend lines perfectly horizontal and brings them to present automatically. SPEND YOUR TIME TRADING AND NOT FORMATTING TREND LINES! Makes for the cleanest of charts! This product is ideal for S/D, S/R, and other technical analysis styles! The most important part is that you won't know how you ever traded with out it! First month is free!
          Targets
          Jose Ramon Miranda Ramos
          5 (1)
          Targets is an indicator to determine potential turning  points , targets  are calculated to determine levels in which the sentiment of the market could change from "bullish" to "bearish." This indicator can be used in any timeframe and any currency pair: IN CASE YOU DON'T SEE THE INDICATOR WHEN YOU ADD IT TO YOUR CHARTS JUST OPEN THE INDICATOR MENU AND CLOSE THE MENU AGAIN PLEASE TAKE NOTICE: For best results use this indicator as an extra tools after you have completed your regular analysis an
          FREE
          TrendSurfer OsMa
          Augustine Kamatu
          2 (1)
          Introducing TrendSurfer OsMa: Elevating Your Forex Trading Experience. TrendSurfer OsMa is a cutting-edge automated trading system meticulously crafted to harness the power of the MetaTrader 4 indicator, Moving Average of Oscillator (OsMa), revolutionizing your approach to forex trading. The Moving Average of Oscillator (OsMa) is a derivative of the MACD (Moving Average Convergence Divergence) indicator. It represents the difference between the MACD line and its signal line. The OsMa provid
          XFibo Auto Fibonacci
          Welinton Dos Reis Goncalves
          Use with disciplined risk management. Fibonacci entry system based on the golden zone 38.2 - 61.8 where the entry is confirmed at 23.6 with indications of Take Profit 3:1. Automatically plotted Fibonacci contains retracement and expansion Fibonacci in a single indicator. Up to 77% win rate with this system. FTMO challenge pass with 0.50% risk and 1.50% R:R.
          Fibonacci strategies EA trades Fibonacci levels. You can choose whether the EA should trade a manually plotted fibonacci or whether it should automatically plot a fibonacci. In automatic fibonacci drawing mode, the EA automatically plots a fibonacci retracement based on the number of bars you select on the BarsToScan setting in the indicator. The fibonacci is automatically updated in real time as new highest and lowest values appears amongst the selected bars. You can select which level values
          The correlation coefficient reflects the relationship between two values. It shows the dependence of changes in one value on changes in another. For example, from changes in the price of EURUSD and EURNZD. The correlation coefficient in trade, currency relations is constantly changing. Special indicators of correlation help to define it, trace changes, draw correct conclusions. One of them is the Hubbles Correlator indicator. The indicator allows you to simultaneously display several other char
          SentimentEA
          Sergii Onyshchenko
          This is a rarely working EA.  I recommend this EA for institutional funds. I recommend it only for pair EURUSD. Working timeframe M1 . Orders 1-3 series per month - is optimal. Public monitoring https://www.mql5.com/en/signals/616195 Strategy EA sells when is expensive and buys when cheap. If % bulls in a moment  <x   EA is searching for buys. If % bulls in a moment  >y  EA is searching for sells. For opening EA orders, used Market Structure High (MSH) - Market Structure Low (MSL). Paramete
          Neon Bot EA
          Aleksandr Ivanov
          They say that currency market is flat most of the time.  NEON Bot EA based on this principle namely on the logic price's return to average value with filtering entry due to custom indicator. EA uses the strategy of martingale therefore it sets stop-loss for each position separately. Also the quantity of orders in the grid is limited. Don't try to change recommended MM to avoid a large drawdown.  Signals:   https://www.mql5.com/ru/users/samivanov/seller !Attention! EA is sensitive to chart peri
          Sensitive Signal
          Aleksey Ivanov
          5 (2)
          Der Indikator für empfindliches Signal (SS) verwendet vom Autor entwickelte Filtermethoden. Mit SS können Sie den Beginn einer echten Trendbewegung mit hoher Wahrscheinlichkeit einstellen. SS filtert nach zufälligen Kursbewegungen, was für den Handel an der Börse sehr effektiv ist. Die vom Autor entwickelte Filtration wird in mehreren Iterationen durchgeführt und zeigt die wahre Flugbahn der regulären Preisbewegung  und zeichnet diese.                Indikatorablesungen sind visuel
          Detroit Trade v2
          Johnneid Amme Gomes E Silva
          https://lucrandoemdolares.com/ Funciona em todos os pares de moeda e metais, pode incluir vários ao mesmo tempo, recomendo usar 4 pares à cada 250usd de saldo disponível. sets >  https://www.mql5.com/en/blogs/post/740296 Recomendações O depósito mínimo recomendado é de $ 500. Use um corretor ECN com um spread baixo e execução rápida de ordens.  Símbolos principais: EURUSD, GBPUSD, XAUUSD, XAGUSD e USDJPY.     Prazos: H1 Para obter os melhores resultados de negociação, use   VPS   com conexão
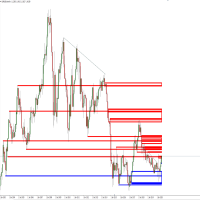
          OVERVIEW The Vector Candle Zones Render indicator automatically renders boxes for vector candle zones that are yet to be recovered. The indicator is an implementation of an existing PVA candles indicator. Combine it with PVSRA and MarketMakerMethod strategy. FEATURES Software: MetaTrader4 - MT4 - 600+ build Timeframes: Multi-Timeframe Markets: Forex/Cryptos/Energies/Bonds/Metals/Indices/Futures/Commodities Customizable style parameters: Change Color style Chan
          Käufer dieses Produkts erwarben auch
          Gann Made Easy
          Oleg Rodin
          4.83 (93)
          Gann Made Easy ist ein professionelles und einfach zu bedienendes Forex-Handelssystem, das auf den besten Handelsprinzipien unter Verwendung der Theorie von Mr. basiert. W.D. Gann. Der Indikator liefert genaue KAUF- und VERKAUFSsignale, einschließlich Stop-Loss- und Take-Profit-Levels. Mit PUSH-Benachrichtigungen können Sie auch unterwegs handeln. Bitte kontaktieren Sie mich nach dem Kauf! Ich werde meine Handelstipps und tolle Bonusindikatoren kostenlos mit Ihnen teilen! Wahrscheinlich haben Si
          Bull versus Bear
          Mohamed Hassan
          4.75 (8)
          Official Release price of $65 for the first 56 /60   copies ( 4  copies left). Next price is $120 !  Send us a message after your purchase to receive more information on how to get your  BONUS  for FREE  that works in great combination with Bull vs Bear ! Bull versus Bear is an easy-to-use Forex indicator that gives traders clear and accurate signals based on clear trend retests . Forget about lagging indicators or staring at charts for hours because  Bull vs Bear provides real-time entries
          TPSpro RFI Levels
          Roman Podpora
          4.82 (22)
          ANWEISUNGEN    Russland -    ENG    Die Empfehlung basiert auf dem Indikator -   TPSpro   TREND PRO -   Version MT5 Die wichtigsten Elemente in der Branche sind entweder in Zonen oder in der Fabrik enthalten, oder sie führen zu einer Lösung bei einem Kauf oder dem Verkauf eines anderen Instruments. Wenn viele Menschen ihre Rechte nicht auf dem Händlerkonto verschlüsseln, werden die Folgen nicht schnell genug sein. Ich habe es damit abgeschlossen, dass ich diese Folgen nun noch interpretieren un
          Gold Stuff
          Vasiliy Strukov
          4.89 (242)
          Gold Stuff-Ein Trendindikator, der speziell für Gold entwickelt wurde, kann auch auf allen Finanzinstrumenten verwendet werden. Der Indikator wird nicht neu gezeichnet und verzögert sich nicht. Empfohlener Zeitrahmen H1. Nach diesem Indikator geschrieben EA Gold Stuff Berater, können Sie es in meinem Profil finden. WICHTIG! Kontaktieren Sie mich sofort nach dem Kauf, um Anweisungen und Bonus zu erhalten!   Sie können eine kostenlose Kopie unseres Strong Support- und Trendscanner-Indikators
          BITTE LESEN SIE DIE INFORMATIONEN UNTEN, BEVOR SIE DAS PRODUKT KAUFEN! Apollo Pips PLUS SP ist ein einzigartiges Produkt! ES IST FÜR ALLE, DIE MEINEN NEUEN „APOLLO PIPS“-INDIKATOR PLUS „SUPER PACK“-BONUS MIT ZUGRIFF AUF ALLE MEINE HANDELSINDIKATOREN ERHALTEN MÖCHTEN! Mit dem Kauf des Produkts Apollo Pips PLUS SP erwerben Sie tatsächlich eine völlig neue Version meines Apollo Pips-Indikators. Diese Version des Indikators verfügt über einen verbesserten Algorithmus und einen benutzerfreundlichen P
          Trend Screener
          STE S.S.COMPANY
          4.81 (88)
          Trendindikator, bahnbrechende, einzigartige Lösung für Trendhandel und -filterung mit allen wichtigen Trendfunktionen in einem Tool! Es handelt sich um einen 100 % nicht neu zu malenden Multi-Timeframe- und Multi-Währungs-Indikator, der für alle Symbole/Instrumente verwendet werden kann: Forex, Rohstoffe, Kryptowährungen, Indizes und Aktien. ZEITLICH BEGRENZTES ANGEBOT: Der Support- und Resistance-Screener-Indikator ist für nur 50 $ und lebenslang verfügbar. (Ursprünglicher Preis 250 $) (Angebot
          FX Volume
          Daniel Stein
          4.58 (33)
          Erhalten Sie Ihr tägliches Marktupdate mit Details und Screenshots über unser Morning Briefing hier auf mql5 und auf Telegram ! FX Volume ist der ERSTE und EINZIGE Volumenindikator, der einen ECHTEN Einblick in die Marktstimmung aus Sicht eines Brokers bietet. Es bietet fantastische Einblicke in die Positionierung von institutionellen Marktteilnehmern, wie z.B. Brokern, auf dem Forex-Markt, viel schneller als COT-Berichte. Diese Informationen direkt auf Ihrem Chart zu sehen, ist der wahre Game
          TPSproTREND PrO
          Roman Podpora
          4.79 (19)
          TPSpro TREND PRO   ist ein Trendindikator, der den Markt automatisch analysiert und Informationen über den Trend und jede seiner Änderungen liefert sowie Signale für den Einstieg in Geschäfte ohne Neuzeichnung gibt! Der Indikator verwendet jede Kerze und analysiert sie separat. bezieht sich auf verschiedene Impulse – Aufwärts- oder Abwärtsimpuls. Exakte Einstiegspunkte in Transaktionen für Währungen, Krypto, Metalle, Aktien, Indizes! Version MT5                   VOLLSTÄNDIGE BESCHREIBUNG DES
          Scalper Inside PRO
          Alexey Minkov
          4.73 (56)
          An exclusive indicator that utilizes an innovative algorithm to swiftly and accurately determine the market trend. The indicator automatically calculates opening, closing, and profit levels, providing detailed trading statistics. With these features, you can choose the most appropriate trading instrument for the current market conditions. Additionally, you can easily integrate your own arrow indicators into Scalper Inside Pro to quickly evaluate their statistics and profitability. Scalper Inside
          FX Power MT4 NG
          Daniel Stein
          5 (13)
          Erhalten Sie Ihr tägliches Marktupdate mit Details und Screenshots über unser Morning Briefing hier auf mql5 und auf Telegram ! FX Power MT4 NG ist die nächste Generation unseres langjährig sehr beliebten Währungsstärkemessers FX Power. Und was bietet dieser Stärkezähler der nächsten Generation? Alles, was Sie am ursprünglichen FX Power geliebt haben PLUS GOLD/XAU-Stärkeanalyse Noch präzisere Berechnungsergebnisse Individuell konfigurierbare Analysezeiträume Anpassbares Berechnungslimit für noc
          Trend Punch
          Mohamed Hassan
          4.95 (21)
          This indicator is unstoppable when combined with our other indicator called  Support & Resistance . After purchase, send us a message and you will get it   for  FREE as a BONUS! Introducing Trend Punch , the revolutionary forex trend indicator that will transform the way you trade! Trend Punch is uniquely designed to provide precise buy and sell arrows during strong market trends, making your trading decisions clearer and more confident. Whether you're trading major currency pairs or exotic sym
          Black dragon indicator
          Ramil Minniakhmetov
          4.86 (114)
          Der Trenderkennungsindikator ergänzt jede Strategie und kann auch als unabhängiges Werkzeug verwendet werden. Empfehlungen für die Arbeit mit dem Indikator können Sie in Kommentar #8 herunterladen Vorteile Einfach zu bedienen, überfrachtet das Diagramm nicht mit unnötigen Informationen; Kann als Filter für jede Strategie verwendet werden; Verfügt über eingebaute dynamische Unterstützungs- und Widerstandsebenen, die sowohl zur Gewinnmitnahme als auch zum Setzen von Stop-Loss verwendet werd
          Atomic Analyst
          Issam Kassas
          5 (2)
          Zunächst einmal ist es erwähnenswert, dass dieser Handelsindikator nicht neu malt, nicht neu zeichnet und keine Verzögerung aufweist, was ihn sowohl für manuellen als auch für Roboterhandel ideal macht. Benutzerhandbuch: Einstellungen, Eingaben und Strategie. Der Atom-Analyst ist ein PA-Preisaktionsindikator, der die Stärke und das Momentum des Preises nutzt, um einen besseren Vorteil auf dem Markt zu finden. Ausgestattet mit fortschrittlichen Filtern, die helfen, Rauschen und falsche Signale z
          (Currently 30% OFF) Before reading the description of this indicator, I just want to introduce to you following concept Moving Average Line - Typical moving average which is based on one chart alone.  Currency Strength Line - The moving average of a certain pair in which the strength is based on 28 pairs. Can be said as the real moving average line. Moving Average indeed is one of the most popular indicator which almost every trader use. Currency Strength Meter is also a trend indicator whic
          Currency Strength Exotics
          Bernhard Schweigert
          4.87 (31)
          Stärke von 8 Währungen plus EIN EXOTISCHES Paar oder Rohstoffe oder Indexe! Jedes Produkt kann als 9. Linie hinzugefügt werden. Fügen Sie Rohstoffe, Indexes oder exotische Währungen hinzu (Gold, Silber, Öl, DAX, US30, MXN, TRY, CNH ...). Eine neue noch nie dagewesene TRADING STRATEGIE  !!! Dieser Indikator ist einzigartig, weil wir eine Reihe von proprietäre Funktionen und neue Formeln eingebaut haben. Es funktioniert für alle Zeitrahmen. Basierend auf neuen zugrunde liegenden Algorithmen ist
          Hinterlassen Sie nach dem Kauf einen Kommentar, um 4 hochwertige Indikatoren als Bonus zu erhalten. Der Chart Patterns All-in-One Indikator hilft Tradern, verschiedene Chartmuster, die häufig in der technischen Analyse verwendet werden, zu visualisieren. Dieser Indikator unterstützt die Identifizierung möglicher Marktbewegungen, garantiert jedoch keine Rentabilität. Es wird empfohlen, den Indikator vor dem Kauf im Demomodus zu testen. Aktuelles Angebot : 50 % Rabatt auf den "Chart Patterns All i
          How to use Pair Trading Station Pair Trading Station is recommended for H1 time frame and you can use it for any currency pairs. To generate buy and sell signal, follow few steps below to apply Pair Trading Station to your MetaTrader terminal. When you load Pair Trading Station on your chart, Pair Trading station will assess available historical data in your MetaTrader platforms for each currency pair. On your chart, the amount of historical data available will be displayed for each currency pai
          TakePropips Donchian Trend Pro
          Eric John Pajarillaga Aldana
          4.44 (16)
          TakePropips Donchian Trend Pro   (MT4) ist ein leistungsstarkes und effektives Tool, das mithilfe des Donchian-Kanals automatisch die Richtung des Trends erkennt und Ihnen Handelssignale für den Ein- und Ausstieg liefert! Dieser Multifunktionsindikator umfasst einen Trendscanner, Handelssignale, ein statistisches Panel, einen Screener, Handelssitzungen und ein Dashboard für den Verlauf von Warnungen. Es wurde entwickelt, um Ihnen Handelssignale zu liefern und Ihnen Stunden beim Analysieren der C
          Bei diesem Indikator handelt es sich um einen Indikator für die automatische Wellenanalyse, der sich perfekt für den praktischen Handel eignet! Fall... Hinweis:   Ich bin es nicht gewohnt, westliche Namen für die Welleneinstufung zu verwenden. Aufgrund des Einflusses der Namenskonvention von Tang Lun (Tang Zhong Shuo Zen) habe ich die Grundwelle als   Stift   und das sekundäre Wellenband als   Segment   bezeichnet Gleichzeitig hat das Segment die   Trendrichtung   benannt (diese Benennungsmet
          Wir stellen vor       Quantum Trend Sniper Indicator   , der bahnbrechende MQL5-Indikator, der die Art und Weise, wie Sie Trendumkehrungen erkennen und handeln, verändert! Entwickelt von einem Team erfahrener Händler mit über 13 Jahren Handelserfahrung,       Quantum Trend Sniper-Indikator       wurde entwickelt, um Ihre Trading-Reise mit seiner innovativen Methode zur Identifizierung von Trendumkehrungen mit extrem hoher Genauigkeit auf ein neues Niveau zu heben. ***Kaufe Quantum Trend Snipe
          Dieses Dashboard zeigt die neuesten verfügbaren harmonischen Muster für die ausgewählten Symbole, so dass Sie Zeit sparen und effizienter sein werden / MT5-Version . Kostenloser Indikator: Basic Harmonic Pattern Spalten des Indikators Symbol: die ausgewählten Symbole werden angezeigt Trend: bullish oder bearish Pattern : Art des Musters (Gartley, Schmetterling, Fledermaus, Krabbe, Hai, Cypher oder ABCD) Entry : Einstiegskurs SL: Stop-Loss-Kurs TP1: 1. Take-Profit-Kurs TP2: 2. Gewinnmitnah
          Currency Strength Matrix
          Raymond Gilmour
          4.5 (26)
          THE ONLY CURRENCY STRENGTH INDICATOR THAT IS BASED ON PRICE ACTION. DESIGNED FOR TREND, MOMENTUM & REVERSAL TRADERS This indicator  reads price action to confirm trend and strength . Advanced multi-currency and multi-time frame indicator that shows you simply by looking at one chart, every currency pair that is trending and the strongest and weakest currencies driving those trends. For full details on how to use this indicator, and also how to get a FREE chart tool, please see user manual HER
          Advanced Supply Demand
          Bernhard Schweigert
          4.91 (295)
          Derzeit 33% Rabatt! Die beste Lösung für jeden Anfänger oder erfahrenen Händler! Dieser Indikator ist ein einzigartiges, qualitativ hochwertiges und erschwingliches Trading-Tool, da wir eine Reihe von proprietären Funktionen und eine neue Formel integriert haben. Mit diesem Update werden Sie in der Lage sein, doppelte Zeitrahmenzonen anzuzeigen. Sie können nicht nur einen höheren TF (Zeitrahmen) anzeigen, sondern sowohl den Chart-TF als auch den höheren TF: SHOWING NESTED ZONES. Alle Supply Dema
          FX Levels ist ein außergewöhnlich präziser Unterstützungs- und Widerstandsindikator, der die traditionelle Lighthouse-Methode mit einem innovativen dynamischen Ansatz verbindet und für alle Handelssymbole einwandfrei funktioniert. Dazu gehören Währungspaare, Indizes, Aktien oder Rohstoffe. FX Levels identifiziert Umkehrpunkte und zeigt sie auf dem Chart an, die Sie ideal als Gewinnziele für Ihre Handelsaktivitäten nutzen können. Bei der Entwicklung von FX Levels haben wir unsere umfangreichen E
          Dynamic Forex28 Navigator
          Bernhard Schweigert
          5 (2)
          Dynamic Forex28 Navigator – Das Forex-Handelstool der nächsten Generation AKTUELL 49 % RABATT. Dynamic Forex28 Navigator ist die Weiterentwicklung unserer seit langem beliebten Indikatoren und vereint die Leistung von drei in einem: Advanced Currency Strength28 Indicator (695 Bewertungen) + Advanced Currency IMPULSE mit ALERT (520 Bewertungen) + CS28 Combo Signals (Bonus) Details zum Indikator https://www.mql5.com/en/blogs/post/758844 Was bietet der Strength Indicator der nächsten Generation?
          DERZEIT 26% RABATT Die beste Lösung für jeden Newbie oder Expert Trader! Dieser Indikator ist ein einzigartiges, qualitativ hochwertiges und erschwingliches Trading-Tool, da wir eine Reihe von proprietären Funktionen und eine neue Formel integriert haben. Mit nur EINEM Chart können Sie die Währungsstärke für 28 Forex-Paare ablesen! Stellen Sie sich vor, wie sich Ihr Handel verbessern wird, weil Sie in der Lage sind, den genauen Auslösungspunkt eines neuen Trends oder einer Scalping-Gelegenh
          Enigmera
          Ivan Stefanov
          5 (3)
          ENIGMERA: Der Kern des Marktes https://www.enigmera.com Einführung Dieser Indikator und dieses Handelssystem sind ein bemerkenswerter Ansatz für die Finanzmärkte. ENIGMERA nutzt die fraktalen Zyklen zur genauen Berechnung von Unterstützungs- und Widerstandsniveaus. Er zeigt die echte Akkumulationsphase an und gibt Richtung und Ziele vor.  Ein System, das funktioniert, egal ob wir uns in einem Trend oder in einer Korrektur befinden.  Wie funktioniert es? ENIGMERA besteht aus drei Linien: der
          DERZEIT 31% RABATT! Die beste Lösung für jeden Newbie oder Expert Trader! Dieser Indikator ist ein einzigartiges, qualitativ hochwertiges und erschwingliches Handelsinstrument, da wir eine Reihe von proprietären Funktionen und eine geheime Formel eingebaut haben. Mit nur EINEM Chart liefert er Alerts für alle 28 Währungspaare. Stellen Sie sich vor, wie sich Ihr Handel verbessern wird, weil Sie in der Lage sind, den genauen Auslösepunkt eines neuen Trends oder einer Scalping-Gelegenheit zu e
          Derzeit 20% Rabatt! Die beste Lösung für jeden Neueinsteiger oder Expert Händler! Dieses Dashboard arbeitet mit 28 Währungspaaren. Es basiert auf 2 unserer Hauptindikatoren (Advanced Currency Strength 28 und Advanced Currency Impulse). Es bietet einen hervorragenden Überblick über den gesamten Forex-Markt. Es zeigt die Werte der Advanced Currency Strength, die Veränderungsrate der Währungen und die Signale für 28 Devisenpaare in allen (9) Zeitrahmen. Stellen Sie sich vor, wie sich Ihr Hande
          Currently Price 20% OFF ( for unlimited use )   BONUS  AUX VIP Club 2024 : Include  EA Airbag  and  Load Data History  to enhance the performance of this tool to its maximum potential  Click Here to Download Files   ( for users only )   Hello World! Introducing.. SMCpro VIP tool and Indicator for MetaTrader 4, designed to revolutionize your trading experience with the ICT Smart Money Concept. This system is meticulously crafted to empower traders with advanced insights and precision in
          Weitere Produkte dieses Autors
          SMARTMASS INDICATOR This indicator is different from all known volume indicators. It has a significant distinction; it is an algorithm that relates price movement to volume, attempting to find proportionality and efficient movement while filtering out noise and other movements that are more random and do not follow a trend or reversal. Ultimately, it reveals the true strength of the movement, indicating whether it has genuine support from bulls or bears or if it's merely a high-volume movemen
          TrackingLevels MT4
          Roberto Alvarez
          5 (1)
          TRACKINGLEVELS (SUPPORTS AND RESISTANCES) TrackingLevels is a useful indicator that saves considerable time when a trader starts analyzing a chart. This indicator draw on the chart all the resistances and supports that the market is creating. The resistance and support levels are very important, this levels define areas where there can be a considerable accumulation of sell or buy orders. These are a key areas that every trader must know and keep in mind all the time. This indicator helps th
          TRACKINGLEVELS (SUPPORTS AND RESISTANCES) TrackingLevels is a useful indicator that saves considerable time when a trader starts analyzing a chart. This indicator draw on the chart all the resistances and supports that the market is creating. The resistance and support levels are very important, this levels define areas where there can be a considerable accumulation of sell or buy orders. These are a key areas that every trader must know and keep in mind all the time. This indicator helps the
          Auswahl:
          sastiwoo
          176
          sastiwoo 2022.10.24 20:41 
           

          I like it. I doubt I'm using it in the way it's intended, but as a component in my system it's a useful little tool. The author was also really helpful in assisting with queries. Many thanks!

          jiab
          436
          jiab 2022.10.21 15:09 
           

          new version ok

          Antwort auf eine Rezension
          Version 4.13 2024.01.22
          1. Improved impulse size management
          2. Bug fixed
          Version 4.12 2024.01.12
          1. Bug fixes and other minor improvements
          Version 4.11 2023.12.03
          1. Enhancements implemented in detecting impulses.
          2. Minor bugs fixed
          Version 4.10 2023.11.11
          1. Bug fixes and other minor improvements
          Version 4.9 2023.10.29
          1. The impulses detection algorithm is improved when they are consecutive
          2. Minor errors fixed
          Version 4.8 2023.10.07
          1. Improvements on the impulse detection algorithm.
          2. Optimization of the rectangle objects size
          Version 4.7 2023.10.01
          1. Improved the algorithm for calculating impulse width
          Version 4.6 2023.09.30
          1. The algorithm for impulse detection has been improved
          2. Bugs caused by session end and start gaps have been fixed
          Version 4.5 2023.09.17
          1. Updated impulse detection algorithm
          2. Bugs fixed
          Version 4.4 2023.09.16
          1. The impulse detection algorithm has been improved
          2. Rectangle objects have been optimized according to impulse relevance
          3. Floating levels with more data
          4. Icon added
          5. Minor bugs fixed
          Version 4.3 2023.09.14
          1. Some problems with arrowprice objects fixed
          Version 4.2 2023.09.11
          1. Fixed color selection bug
          2. Improved color selection in the parameters window
          Version 4.1 2023.09.10
          1. Improvements on alerts management.
          2. Some little bugs are fixed on drawing rectangle objets
          Version 4.0 2023.09.02
          1. New feature for detecting bullish and bearish impulses.
          2. New alerts with valuable information about the detected impulses.(push notifications, sounds, emails)
          3. The arrows will be removed and replaced by new rectangular objects for visual assistance for each impulse.
          Mouse labels to describe impulse characteritics
          4. Data provided for each impulse that displays its own characteristics with floating labels.
          - Volumen factor: Measurement of the intensity of the impulse compared to the average value
          - Pips factor: pips variation from the start price to the end price of the impulse compared to the average candle body value.
          - Width of the impulse: Number of candles that make up the impulse.
          5. New line (Delta Line) to display the net value of both bullish and bearish forces."
          6. More efficient code
          Version 3.4 2023.04.24
          1. Fixed a issues with push notifications
          2. Minor improvements
          Version 3.3 2023.04.23
          1. Improvements in the position of the objets on graph
          2. Minor fixes and improvements
          Version 3.2 2023.04.22
          1. Improvement code that management divergences detection
          Version 3.1 2023.04.16
          1. Improve arrows precision
          2. Fixed a little bug
          Version 3.0 2023.04.15
          1. Alerts (sounds, push notifications and email messages) added.
          2. Text labels of both volumes (actual candle) added.
          3. Arrow objects from lowest to highest probability (weak, medium and premium signals) added
          4. Divergences price-smartmass detection
          5. Improved volumen calculates
          6. Fixed some minor errors
          Version 2.3 2022.10.24
          1. Enhancement to display indicator data on the current candle
          Version 2.2 2022.10.22
          1. Fixed some erros
          2. Draw indicator only when stabilized (initial candles)
          Version 2.1 2022.08.12
          Compiled to version 4.00 build 1359
          Version 2.0 2022.04.24
          Compiled to versión 4.00 build 1355
          Version 1.1 2014.10.03
          Improvements in the automatic update of the indicator's drawing. There was a bug and sometimes it was necessary to update the indicator manually, the indicator was blocked and didn't follow the price.