TIL Pivot Points Indicator
- Indikatoren
- Viktor Macariola
- Version: 1.1
- Aktualisiert: 21 November 2021
- Aktivierungen: 20
Pivot Point is a technical indicator widely used by traders to predict major price movements by calculating various levels of support and resistance. Investopedia defines the pivot point as follows:
A technical analysis indicator used to determine the overall trend of the market over different time frames. The pivot point itself is simply the average of the high, low and closing prices from the previous trading day. On the subsequent day, trading above the pivot point is thought to indicate ongoing bullish sentiment, while trading below the pivot point indicates bearish sentiment.
A pivot point analysis is often used in conjunction with calculating support and resistance levels, similar to a trend line analysis. In a pivot point analysis, the first support and resistance levels are calculated by using the width of the trading range between the pivot point and either the high or low prices of the previous day. The second support and resistance levels are calculated using the full width between the high and low prices of the previous day.
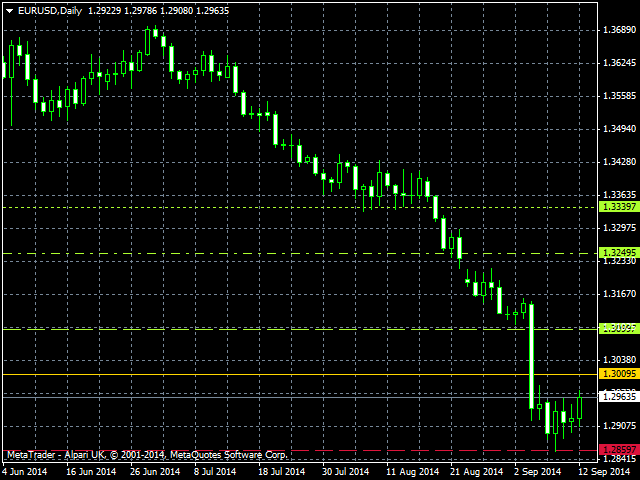
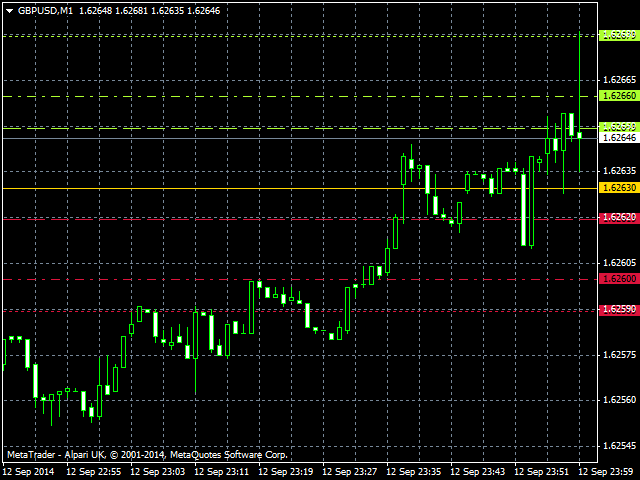
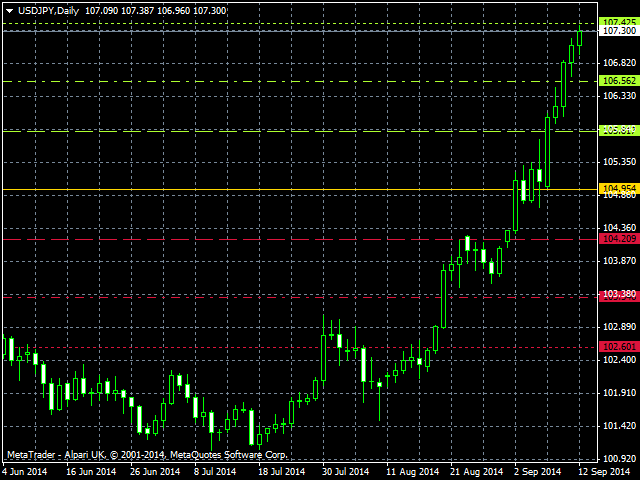
TIL Pivot Points indicator employs the seven point system:
- Resistance 3 (R3) – dotted green line
- Resistance 2 (R2) – dash-dotted green line
- Resistance 1 (R1) – dashed green line
- Pivot Point (P) – solid yellow line
- Support 1 (S1) – dashed red line
- Support 2 (S2) – dash-dotted red line
- Support 3 (S3) – dotted red line
TIL Pivot Points indicator also allows you to select the base timeframe from which the pivot points and its levels are calculated. You can do this by changing the HLC (stands for High, Low, and Close) parameter. There are eleven timeframes to choose from:
- NEXT_TIMEFRAME – this is the default setting. For example, if the current chart is H4, the pivot point is calculated from values on D1. However, if the current chart is MN, the pivot point is calculated from the values on MN as well.
- CURRENT_TIMEFRAME – the pivot point is calculated from the values on the current timeframe.
- M1 – the pivot point is calculated from the values on M1.
- M5 – the pivot point is calculated from the values on M5.
- M15 – the pivot point is calculated from the values on M15.
- M30 – the pivot point is calculated from the values on M30.
- H1 – the pivot point is calculated from the values on H1.
- H4 – the pivot point is calculated from the values on H4.
- D1 – the pivot point is calculated from the values on D1.
- W1 – the pivot point is calculated from the values on W1.
- MN – the pivot point is calculated from the values on MN.

