ZigZag Sniper
- Indikatoren
- Natasha Diedericks
- Version: 1.1
- Aktualisiert: 9 Juni 2022
- Aktivierungen: 20
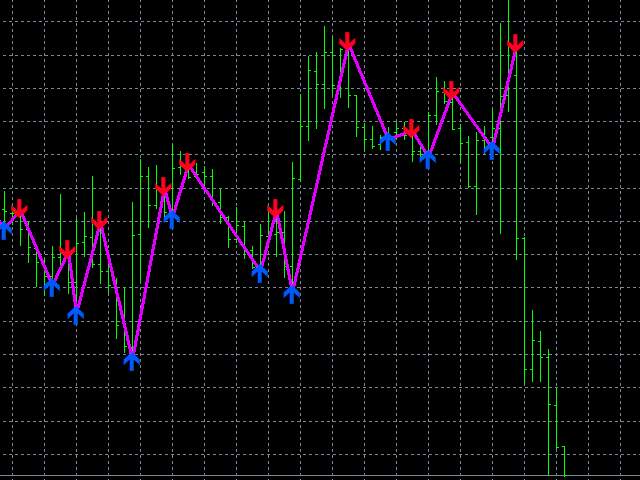
This indicator gives you a modified ZigZag, combined with a special algorithm.
Great for scalping.
Perfect for channel trading.
Parameter TrendPeriod.
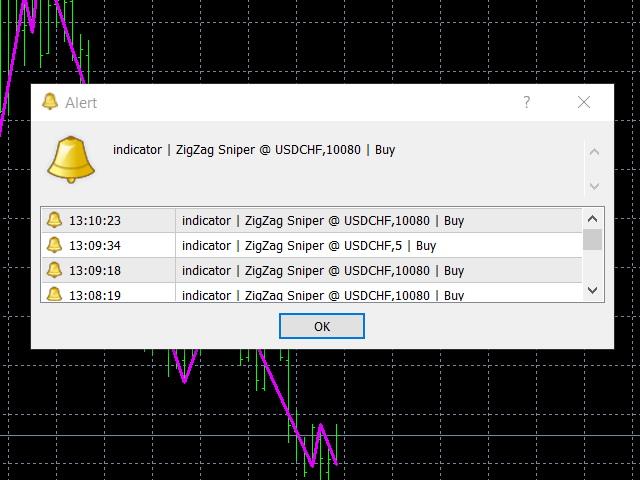
Features alert functions.
How to use:
- Simply attach to any chart with default settings.
- Buy when the line crosses below the price, and blue arrow.
- Sell when the line crosses above the price, and red arrow.
- It helps to keep the audible alert set to true.
- Best results when checking two or more timeframes before entering trades. (See comment #1 for example MTF trade setup)
- Use as you see fit for your strategy.
- Best results on Major pairs, but can also be used on other pairs.
Important to note:
- Please combine this indicator with your other tools for best results.
- Always test your strategy on a demo account before using a new indicator on a live account.
- You use this indicator at your own risk.
- Do not risk money you cannot afford to lose.