TrendWatch
- Indikatoren
- Matous Bartl
- Version: 2.0
- Aktualisiert: 7 Dezember 2020
- Aktivierungen: 5
Brief description
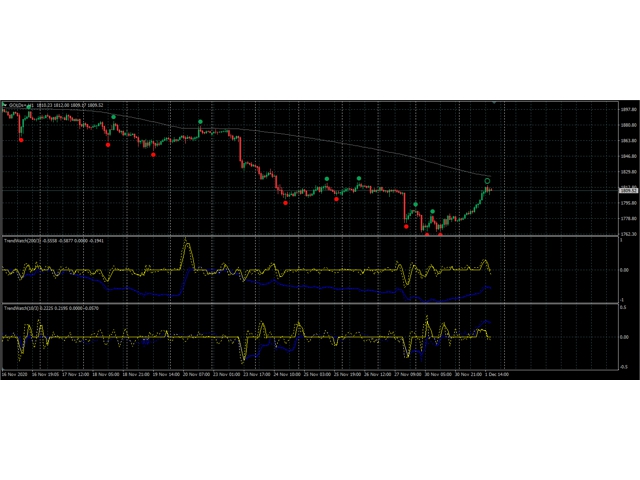
TrendWatch indicator analyze chart trend strength and acceleration. Analysis is based on close price SMA with configurable period. Result is given as set of two curves in the indicator window. Blue (default color) curve identify trend direction and strength. Yellow curve (default color) identify trend tendency to accelerate/deceleare. Scale of curves is normed to maximal value in given time period. Both curves can be additionally smoothed using configurable SMA and/or set to zero if absolute value below set limit (to blank insignificant values). Raw and processes curves can be show simultaneously.
Ver. 2.0 update
Divergency mode has been added. Newly, slope and acceleration of two SMA can be shown. To enable the divergency mode, set "SMA period for base of divergency" parameter to required base SMA period. To detect pull-backs "SMA period for trend detection = 10", "SMA period for base of divergency = 200" is good choice. When "SMA period for base of divergency = 0", feature is dissabled.
Parameters
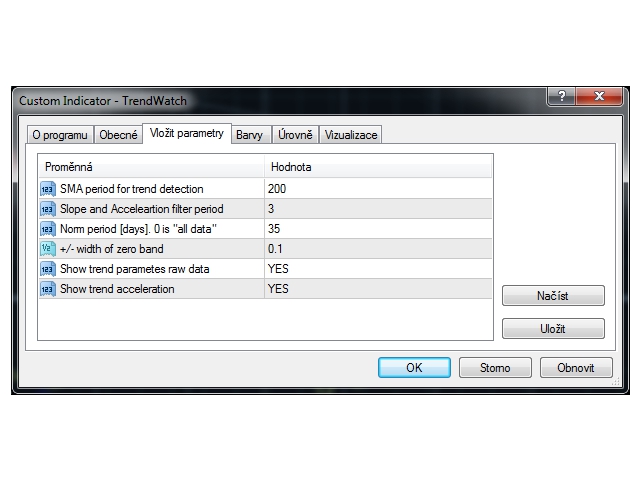
- SMA period for trend detection: Period of analyzed SMA. The higher value the more stable trend you get, but with higher time delay and less sensitivity for quick changes. Recomended range is <10, 200>.
- SMA period for base of divergency: Period of divergency base SMA. If set to 0, feature is dissabled. For any other positive value the indicator show slope and acceleration of Trend SMA and Base SMA difference.
- Slope filter period: Slope curve processing SMA filter period. Higher value - smoother curve, but higher time delay. Recomended range is <2, 25>. WARNING! slope filter period causes also acceleration curve shift.
- Acceleration filter period: Acceleration curve processing SMA filter period. Higher value - smoother curve, but higher time delay. Recomended range is <2, 25>.
- Norm period [days]. 0 is "all data": Time interval (from now) for trend and trend acceleration/deceleration maximum/minimum evaluation in [days]. Paramater has influence on curve scale. If set to "0", all available data rates will be used to detect max/min. There's following risk for "0" setting: If there's strong trend in the past, it will be taken as a norm and other trends will look "weak" in comparision.
- +/- width of zero band: Size of band considered as zero value. Processed curve will be set to 0 if its absolute value below this limit. Recomended range is <0,0.1>
- Show trend parametes raw data: Raw data curves (without additional SMA filtering and zero band nulls) will be also shown in the chart (as dot lines) if parameter set to "YES"
- Show trend acceleration: Yellow (acceleration/deceleration) curve will be hidden, when set to "NO"
Meaning of values and combinations
Positive range of blue curve indicate up-trend, negative range indicate down-trend. Value of 1 (-1) indicate strongest up (down) trend in the selected time period.
Positive range of yellow curve indicate tendency of trend to get possitive: For up-trend it means acceleration and getting stronger, for down-trend it means deceleration and weakening.
Negative range of yellow curve indicate tendency of trend to get negative: For down-trend it means acceleration and getting stronger, for up-trend it means deceleration and weakening.
Range of yellow acceleration/deceleration curve is <-1, 1>. It's normed to the maximal acceleration/deceleration in selected time period.
Due to automatic curve scaling, values in range of aprox. <-0.1, 0.1> can be considered as zero on borh curves.
How to use
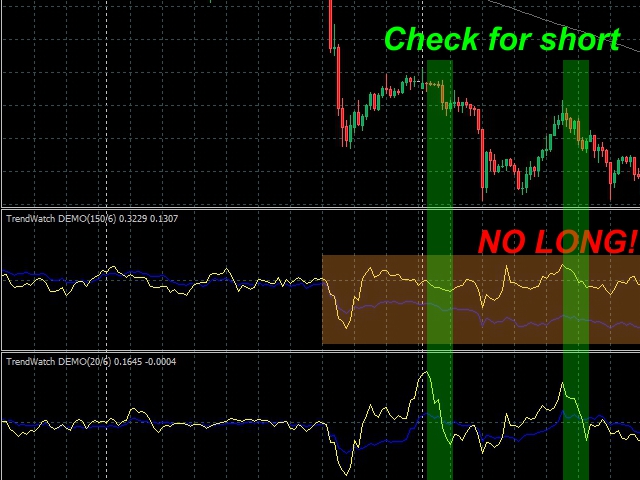
Good idea is to use two TrendWatch indicators with different SMA period setting. For example 150 for long-term trend and 20 for short-term trend. Trend is your friend: Don't try to go short when the long-term blue curve is positive; Don't try to go long, when the long-term blue curve is negative. For particular trade enter check the short-term blue and yellow curve. For short trade you want to see slightly positive to negative transition or zero on blue curve and ending positive impulse on yellow curve (and vice versa for long trade). Example is shown on screenshot
Free DEMO available:
For first experiences find restricted free version TrendWatch DEMO in free section.

