• Übersicht
  • Bewertungen (2)
  • Diskussion (8)
  • Neue Funktionen

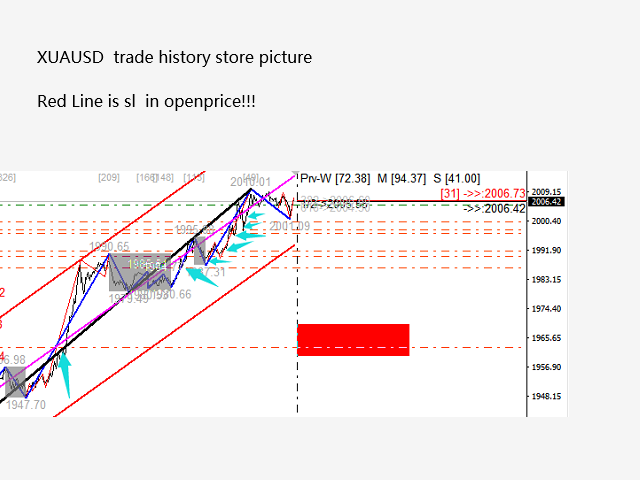
WaveTheory Fully automatic calculation

5

Dieser Indikator ist ein perfekter automatischer Wellenanalyse-Indikator für den praktischen Handel!

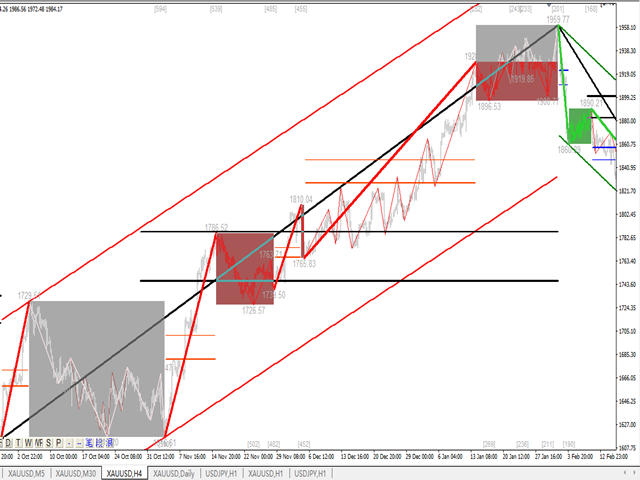
Die standardisierte Definition des Bandes ist nicht mehr eine Welle von verschiedenen Leuten, und das Ziehen von menschengemachten Interferenzen wird eliminiert, was eine Schlüsselrolle bei der gründlichen Analyse des Ansatzes spielt. =>Increase the choice of international style mode, (red fall green rise style)

⭐⭐⭐      Derzeit Kaufrabatt! ⭐⭐⭐

Inhalt des Index:

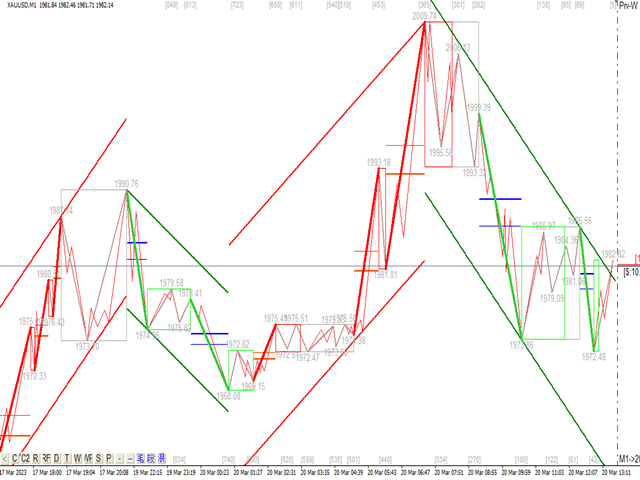
1.    Grundwelle: Zuerst haben wir den Wendepunkt der Grundschwankung im Preisschwankungsprozess gefunden, seine Order ist natürlich nicht zu stark, was eine Grundlage für die nächste Berechnung liefert.

2.    Sekundärband : Auf der Basis der Grundwelle wird durch Algorithmusanalyse ein offensichtlicheres Sekundärband erhalten, und das Sekundärband bietet eine Grundlage für die Wellenanalyse

3.    Welle: Es gibt einen klareren Trend und eine klarere und intuitivere Richtung. Um zu analysieren, ob eine Welle anhält, müssen Sie sich die Form des sekundären Wellenbandes ansehen und die Zusammensetzung der sekundären Welle analysieren, um die anschließende Vorhersage der Welle.

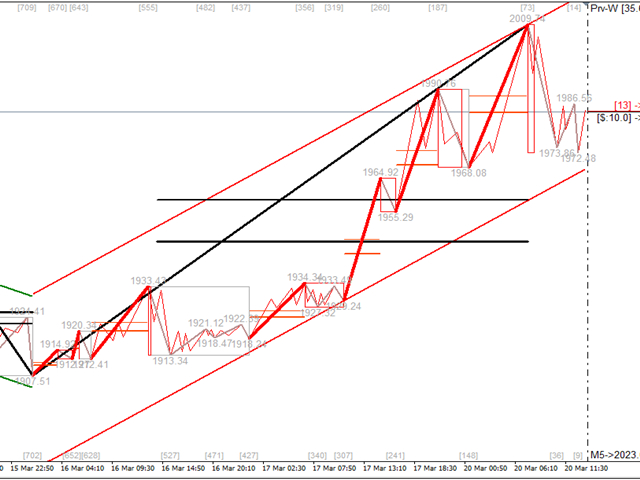
4.    Kanal: Die Kanalberechnung verwendet eine lineare Regressionsmethode zur Berechnung.

5.    Retracement: Die beiden wichtigen Retracements in der Welle werden am Ende jeder Welle angezeigt. Die relative Stärke dieser wichtigen Retracements im tatsächlichen Kampf und das tatsächliche Retracement bestimmt die Dynamik des Trends

6.    Schwingungsintervall: Das Schwingungsintervall ist im Indikator markiert

Indikator Kampf:

1. Die Quelle der aktuellen Kampftheorie ist die grundlegende Wellentheorie, die taoistische Theorie.

2. Die Theorie des tatsächlichen Kampfes leitet sich mehr vom tatsächlichen Kampf ab, und Sie werden immer davon profitieren, wenn Sie Bilder tausendmal lesen.

3. Wollte ursprünglich einige praktische Erfahrungen schreiben, aber ich habe festgestellt, dass der Operationsplan in verschiedenen Varianten und Stärken leicht angepasst wurde. Die Transaktion wird ständig geschrieben und aktualisiert. Die Transaktion ist wie eine im Sand vergrabene Linie, auch wenn sie greift das Seil, aber der Sand verändert ständig seine Form.

4. Wenn die Welle durch Quantifizierung definiert wird, wird die Transaktion einfach und effektiv, der Trend wird sehr klar, es gibt den allgemeinen Trend im Herzen und alles wird einfach und effektiv.

5. Ob Links- oder Rechtshandel, ob Trendhandel oder oszillierendes Trading, diese Indikatoren haben ihre Antworten: Jeder muss den Rhythmus, das Niveau, die Dynamik und die Zeit des Trends und des Schocks spüren ist extrem wichtig.

6. Um die Wellen und Handelswellen zu verstehen, müssen wir die Multi-Level- und Multi-Periode analysieren.


Tatsächliche Kampferfahrung:

1. Die Wellentheorie und die taoistische Theorie sind geschrieben, aber sie stimmen nicht vollständig mit den Gesetzen der natürlichen Schwankungen überein.Viele schwierige Situationen werden im eigentlichen Transaktionsanalyseprozess gefunden.

2. Im Folgenden können wir den Markt in zwei Typen unterteilen, den geordneten analysierbaren Markt und den ungeordneten Markt.

3. Es gibt Trends und Schocks auf dem geordneten und analysierbaren Markt. Dieses Marktsegment kann von uns analysiert werden, dh der grafische Teil und der handelbare Teil. Sobald dieser Teil bestellt ist, wird er die geordneten Eigenschaften beibehalten Wir können genug Gewinn damit erzielen

4. Ungeordneter Markt, Schwankungen werden ungeordnet erscheinen, anders als Schocks, ungeordneter Markt kann nicht teilnehmen Geld in der richtigen Reihenfolge aufheben, in Unordnung vermeiden.


Ich hoffe, Menschen zu treffen, die dazu bestimmt sind, die Freude am gemeinsamen Handel zu teilen und zusammen zu wachsen!

Es eignet sich eher für Gold, Rohöl, Pfund-Tage, Bitcoin und andere Trendsorten.

von kjoin.


Bewertungen 2
Peng Jin
320
Peng Jin 2023.03.20 04:36 
 

这套波浪系统非常棒,解决了缠论的画线段问题,从级别的不断递推,分析行情有帮助,感谢作者

elite luis
3331
elite luis 2023.03.08 17:15 
 

Amazing indicator, another quality product from Author, Big Thank you! Author is super friendly and responsive, any issue he get it fix fast also he is open to idea suggestions and continously updating to improve his indicators, he is extremely passionate in what he is doing, deserved more than 5 stars for his dedication! Well Done!

Empfohlene Produkte
Seasonal Pattern Trader
Dominik Patrick Doser
Disclaimer:   Bedenken Sie, dass saisonale Muster nicht immer zuverlässig sind. Deshalb ist ein durchdachtes Risikomanagement entscheidend, um Verluste zu minimieren. Saisonale Muster in der Finanzwelt sind wie ein gut gehütetes Geheimnis, das erfolgreiche Investoren für ihren Vorteil nutzen.  Diese Muster sind wiederkehrende Preisbewegungen, die in bestimmten Zeiträumen oder um besondere Ereignisse auftreten. Hier sind einige Beispiele und Hinweise zur optimalen Nutzung dieser Muster: Beispie
Introduction to Fractal Pattern Scanner Fractal Indicator refers to the technical indicator that makes use of the fractal geometry found in the financial market. Fractal Pattern Scanner is the advanced Fractal Indicator that brings the latest trading technology after the extensive research and development work in the fractal geometry in the financial market. The most important feature in Fractal Pattern Scanner is the ability to measure the turning point probability as well as the trend probabil
Utilities
Douglas Lucio De Araujo
Indicator with 3 features - Clock : Clock independent of the chart, counting continues even when the market is closed. - Template : After setting up a configuration in any graphic, be it color patterns, indicators, zoom ... The configuration will be copied to all active graphics. - TimeFrame : Set the TimeFrame on a chart, and with just one click all the active charts will be changed to the same TimeFrame.
Market Chopper Indicator - is the manual system for market scalping. Indicator uses most accurate points to enter, when current trend has lost it's power and new one starts. Indicator shows : Enter points(buy/sell arrows), Exit points(Stoploss/Takeprofit arrows). Indicator makes market analysis and adapts to any market, any timeframe showing most relevant strategy for exact conditions. Main Indicator's Features Signals are NOT repaint, late or disappear; Every signal comes at the open of new bar
Introduction This indicator detects volume spread patterns for buy and sell opportunity. The patterns include demand and supply patterns. You might use each pattern for trading. However, these patterns are best used to detect the demand zone (=accumulation area) and supply zone (=distribution area). Demand pattern indicates generally potential buying opportunity. Supply pattern indicates generally potential selling opportunity. These are the underlying patterns rather than direct price action. T
Cobalto MT5
Jorge Waldron
This is an automatic system that manages input signals correlating the price, places a market order and adds a stop order contrary to the opposite signal at the distance determined by the parameter "Space between orders". The concept of Cobalto is based on the volatility of the market - it looks for strong movements for buying or selling. This system is designed to be used on ECN accounts with a leverage of 1:300. Parameters Lot_Management Initial_lot: In this parameter the size of the initial
To get access to MT4 version please click   here . This is the exact conversion from TradingView: QQE MT4 Glaz-modified by JustUncleL This is a light-load processing and non-repaint indicator. All input options are available. This is not a multi time frame indicator. Buffers are available for processing in EAs. You can message in private chat for further changes you need.
Afribold Cybernetic Affluence
Itumeleng Mohlouwa Kgotso Tladi
AfriBold Cybernetic Affluence  Your Key to Autonated Trading In the dynamic world of financial markets, navigating the intricate patterns and making informed decisions can be a daunting task. Even seasoned traders face challenges in consistently outperforming the market. This is where the AfriBold Cybernetic Affluence emerges as a powerful tool, designed to automate your trading strategies. Harnessing the Power of AI The AfriBold Cybernetic Wealth Expert Advisor is a cutting-edge trading too
Dieser Indikator prognostiziert Preisumkehrungen und analysiert den Aufwärts- und Abwärtsdruck auf dem Markt. Der Kaufdruck ist die Summe aller Akkumulationsbalken über eine bestimmte Anzahl von Tagen, multipliziert mit dem Volumen. Der Verkaufsdruck ist die Summe aller Verteilungen über die gleiche Anzahl von Barren, multipliziert mit dem Volumen. [ Installationsanleitung | Update-Anleitung | Fehlerbehebung | FAQ | Alle Produkte ] Das Indikatorverhältnis gibt Ihnen ein Maß für den Kaufdruck al
Descriptions A point point is a technical analysis indicator, or calculations, used to determine the overall trend of market over different time frames. This indicator calculate the highest or lowest pivots among left x and right y bars and show the high/low level during that period.   From that, you could clearly see the top resistance & bottom support level and how market goes break out. Instructions pivotLeft - pivot left bar count pivotRight - pivot right bar count pivotHighColor - c
【Super Scanner】Indicator Introduction : The color of the Super Scanner which is green and climbing up means that the price trend is going up.The color of the Super Scanner is red and going down means that the price trend is going down. It is very simple to use it to judge the market trend! What's even better is that the open parameters of the indicators allow investors to adjust. You can adjust【Super Scanner】according to your needs. Adjust it faster to be closer to short-term market fluctuati
Oneiroi
Oleksandr Powchan
5 (1)
Oneiroi trades hard oversold and overbought conditions. On M15 you can achieve a very high hitrate. The system does not trade a lot because meeting the three conditions is quite hard. It will work on any pair and any broker but some are better than others. The EA will work also on small accounts but i would highly recomend to use a 100kcent account. Our Goal is to help you be way more profitable and way more stress free, so you can enjoy the things that are important to you and your fa
Flag MT5
Dmitry Fedoseev
An indicator of patterns #21, #22, #23 ("Flag") from Encyclopedia of Chart Patterns by Thomas N. Bulkowski. Parameters: Alerts - show alert when an arrow appears Push - send a push notification when an arrow appears (requires configuration in the terminal) PeriodBars - period in bars K - an additional parameter that influences the accuracy of pattern shape recognition. The influence of the parameter will be visible if not all of the pattern variants are enabled (not all three parameters Expandin
Hello Seasonal Traders! The seasonality trading strategy works because the smart money is doing the same thing every single year more often than not. The month of the year or the day of the week and the time of the day can call the shots in any market.   The seasonal cycle is another useful tool in your trading arsenal. I'm not saying to trade solely off of seasonality and forget anything else. I'm only giving you another trading tool that you can incorporate into your own trading strategy to ga
The Rainbow Multiple Moving Average (MMA) is a technical analysis tool used to identify trends and potential reversal points in financial markets. It is based on a system of moving averages that are designed to be used together, with each moving average having a different time frame. The Rainbow MMA consists of multiple exponential moving averages (EMAs) of different lengths, with each EMA plotted in a different color. Typically, the Rainbow MMA includes EMAs of 2, 3, 4, 5, 6, 7, 8, 9, 10, 11, a
Phoenix MT5
Volodymyr Hrybachov
Expert Advisor ohne Indikatoren, verwendet keine Indikatoren, kein Ordnungsraster oder Martingal. Die Anzahl der Trades pro Tag kann streng limitiert werden, es kann immer nur 1 Order gleichzeitig im Markt sein. Trades sind durch einen Stop-Loss geschützt, er kann entweder real oder virtuell (vor dem Broker versteckt) sein. Funktioniert während der asiatischen Sitzung in einem ruhigen Markt. Hat einen eingebauten Schutz gegen Verrutschen und Spreizen. Überträgt keine Geschäfte von Montag bis Fr
Candle EA MT5
Mansour Babasafary
4.38 (45)
This expert is based on patterns The main patterns of this specialist are candlestick patterns Detects trends with candlestick patterns It has a profit limit and a loss limit, so it has a low risk The best time frame to use this expert is M30 time frame The best currency pairs to use with this expert is the EURUSD, GBPUSD, AUDUSD, USDCAD currency pairs Attributes: Can be used in the EURUSD, GBPUSD, AUDUSD, USDCAD  currency pairs Can be used in M30, H1, H4 time frames Has profit limit an
The indicator determines a special pattern of Joe Dinapoli. It gives very high probability buy and sell signals. Indicator does not repaint. Indicator Usage Buy Signal ''B'' Entry : Market buy order at signal bar close Stop : Low of signal bar Take Profit : First swing high Sell Signal ''S'' Entry : Market sell order at signal bar close Stop : High of signal bar Take Profit : First swing low Indicator Parameters Fast EMA : External Parameter (should be kept as default) Slow EMA: External Param
Индикатор Magneto Weekly Pro отображает: Недельные важные линии поддержки и сопротивления (выделены желтым, красным и синим цветами). Основные недельные цели (выделены белым цветом). Недельные паттерны возврата цены (обозначаются красными флажками). Применение индикатора Magneto Pro можно использовать и как дополнение к существующей стратегии, и как самодостаточную торговую стратегию. Данный продукт состоит из двух индикаторов, работающих на разных временных промежутках, и предназначен для скал
TrendDecoder Scanner MT5
Christophe Pa Trouillas
5 (1)
Erhalten Sie TrendDECODER-Signale für mehrere Vermögenswerte und Zeiteinheiten | Bestimmen Sie die beste Zeiteinheit zum Einstieg | Maximieren Sie Ihre Gewinne und gewinnbringenden Trades Nicht nachzeichnender, nicht verzögerter Indikator und Screener - ideal für manuellen und automatisierten Handel - für alle Anlagen und alle Zeiteinheiten 49 $  für die ersten 50 Exemplare - danach 99 $ Nach Ihrem Kauf hinterlassen Sie bitte einen Kommentar oder eine Bewertung , und wir senden Ihnen einen zusät
I do not have the exact indicator for MT4 but the nearest possible look alike can be downloaded from here . Also you may check this link . This is the exact conversion from TradingView: "Donchian Trend Ribbon" By "LonesomeTheBlue". One of the coolest indicators out there to detect trend direction and strength. As a trader you always need such indicator to avoid getting chopped in range markets. There are ten buffers as colors to use in EAs also. The indicator is loaded light and non-repaint. Not
Percent
Raphael Moretti
The indicator will plot a line on the chart that corresponds to the closing price of the previous day, and based on this, it will plot the percentage levels of change in the price of the asset in question. It can be used on any asset. Period: Determine whether the closing price should be daily, weekly or monthly Minimum percentage: Determine the percentage for the indicator to plot the levels and sub-levels on the chart, eg 0.5 it will plot on the chart a line for every 0.5% variation and the su
Introduction to Harmonic Volatility Indicator Harmonic Volatility Indicator is the first technical analysis applying the Fibonacci analysis to the financial volatility. Harmonic volatility indicator is another level of price action trading tool, which combines robust Fibonacci ratios (0.618, 0.382, etc.) with volatility. Originally, Harmonic Volatility Indicator was developed to overcome the limitation and the weakness of Gann’s Angle, also known as Gann’s Fan. We have demonstrated that Harmonic
[ MT4 Version ]  [ Kill Zones ]  [ SMT Divergences ] How to trade using Order Blocks:  Click here User Interface Performance:  During testing in the strategy tester, the UI may experience lag. Rest assured, this issue is specific to the testing environment and does not affect the indicator's performance in live trading. Elevate your trading strategy with the  Order Blocks ICT Multi TF  indicator, a cutting-edge tool designed to enhance your trading decisions through advanced order block analysis
The robot is built upon a neural network, offering various functionalities like training the system during initialization and within the strategy tester for optimization. In both scenarios, the robot generates an SQLLight database for future use. If you opt for optimization, you'll need to save the file for later use. The creation of the database is automated and doesn't require any additional user actions. However, if you wish to skip this process, particularly optimization, simply activate the
Gartley Projections D
Oleksandr Medviediev
3 (2)
Der Indikator identifiziert die harmonischen Muster (XABCD) gemäß den Entwicklungen von H.M. Gartley („Profits in the Stock Market“, 1935г). Der D-Punkt wird als Punkt in der perspektivischen Projektion projiziert (geben Sie in den Einstellungen ProjectionD_Mode = true an). Wird nicht neu gezeichnet. Wenn ein Balken des Arbeitszeitraums schließt und sich der identifizierte Musterpunkt während der Balken von Patterns_Fractal_Bars nicht bewegt hat, erscheint ein Pfeil auf dem Diagramm (in Ric
Matreshka
Dimitr Trifonov
5 (1)
Matreshka self-testing and self-optimizing indicator: 1. Is an interpretation of the Elliott Wave Analysis Theory. 2. Based on the principle of the indicator type ZigZag, and the waves are based on the principle of interpretation of the theory of DeMark. 3. Filters waves in length and height. 4. Draws up to six levels of ZigZag at the same time, tracking waves of different orders. 5. Marks Pulsed and Recoil Waves. 6. Draws arrows to open positions 7. Draws three channels. 8. Notes support and re
!! FLASH SALE !!   Over 80% off !!     For ONE week only. Now only $47 - normally $297! >>>      Ends on 30 June 2023 - Don't miss it! The Consolidation Breakout Alerts Indicator will revolutionize your trading strategy. Our innovative indicator offers unique buy and sell arrows when price breaks out from consolidation, allowing you to get in at the most optimal entry with minimal risk and maximum reward potential. Never again will you miss out on the lucrative trading opportunities available
An indicator of pattern #31 ("Long Island") from Encyclopedia of Chart Patterns by Thomas N. Bulkowski. Parameters: Alerts - show alert when an arrow appears   Push - send a push notification when an arrow appears (requires configuration in the terminal) GapSize - minimum gap size in points ArrowType - a symbol from 1 to 17 ArrowVShift - vertical shift of arrows ShowLevels - show levels ColUp - color of an upward line ColDn - color of a downward line   Auto5Digits - automatic multiplication of
Elliott Wave Trend was designed for the scientific wave counting. This tool focuses to get rid of the vagueness of the classic Elliott Wave Counting using the guideline from the template and pattern approach. In doing so, firstly Elliott Wave Trend offers the template for your wave counting. Secondly, it offers Wave Structural Score to assist to identify accurate wave formation. It offers both impulse wave Structural Score and corrective wave Structure Score. Structural Score is the rating to sh
Käufer dieses Produkts erwarben auch
Atomic Analyst MT5
Issam Kassas
4.79 (19)
Zunächst einmal ist es erwähnenswert, dass dieser Handelsindikator nicht neu malt, nicht neu zeichnet und keine Verzögerung aufweist, was ihn sowohl für manuellen als auch für Roboterhandel ideal macht. Benutzerhandbuch: Einstellungen, Eingaben und Strategie. Der Atom-Analyst ist ein PA-Preisaktionsindikator, der die Stärke und das Momentum des Preises nutzt, um einen besseren Vorteil auf dem Markt zu finden. Ausgestattet mit fortschrittlichen Filtern, die helfen, Rauschen und falsche Signale z
Zunächst einmal ist es wichtig zu betonen, dass dieses Handelssystem ein Nicht-Repainting-, Nicht-Redrawing- und Nicht-Verzögerungsindikator ist, was es sowohl für manuelles als auch für automatisches Trading ideal macht. Online-Kurs, Handbuch und Vorlagen herunterladen. Das "Smart Trend Trading System MT5" ist eine umfassende Handelslösung, die für neue und erfahrene Trader maßgeschneidert ist. Es kombiniert über 10 Premium-Indikatoren und bietet mehr als 7 robuste Handelsstrategien, was es zu
TPSpro RFI Levels MT5
Roman Podpora
4.67 (9)
Reversal First Impulse levels (RFI)      INSTRUCTIONS        RUS       -       ENG              R ecommended to use with an indicator   -   TPSpro  TREND PRO -  Version MT4                 A key element in trading is zones or levels from which decisions to buy or sell a trading instrument are made. Despite attempts by major players to conceal their presence in the market, they inevitably leave traces. Our task was to learn how to identify these traces and interpret them correctly. Main functi
Introduction to X3 Chart Pattern Scanner X3 Cherart Pattern Scanner is the non-repainting and non-lagging indicator detecting X3 chart patterns including Harmonic pattern, Elliott Wave pattern, X3 patterns, and Japanese Candlestick patterns. Historical patterns match with signal patterns. Hence, you can readily develop the solid trading strategy in your chart. More importantly, this superb pattern scanner can detect the optimal pattern of its kind. In addition, you can switch on and off individu
AT Forex Indicator MT5
Marzena Maria Szmit
5 (4)
The AT Forex Indicator MT5 is a sophisticated trading tool designed to provide traders with a comprehensive analysis of multiple currency pairs. This powerful indicator simplifies the complex nature of the forex market, making it accessible for both novice and experienced traders. AT Forex Indicator uses advanced algorithms to detect trends, patterns and is an essential tool for traders aiming to enhance their forex trading performance. With its robust features, ease of use, and reliable signal
IVISTscalp5
Vadym Zhukovskyi
5 (5)
Wir stellen Ihnen den iVISTscalp5-Indikator vor, der nicht nur einzigartig, sondern auch effektiv im Handel ist. Dieser Indikator basiert auf Zeitdaten und ist das Ergebnis jahrelanger Erfahrung und eingehender Analyse der Finanzmärkte. Der iVISTscalp5-Indikator ist ein ausgezeichnetes Werkzeug für manuellen Handel. Bequemlichkeit, Einfachheit und Visualisierung - die gesamte Komplexität ist verborgen. Wir haben die Einstellungen und Verwendung des iVISTscalp5-Indikators auf das Maximum vereinfa
Dies ist wahrscheinlich der vollständigste Indikator für die automatische Erkennung der harmonischen Preisbildung, den Sie für die MetaTrader-Plattform finden können. Es erkennt 19 verschiedene Muster, nimmt Fibonacci-Projektionen genauso ernst wie Sie, zeigt die potenzielle Umkehrzone (PRZ) an und findet geeignete Stop-Loss- und Take-Profit-Werte. [ Installationsanleitung | Update-Anleitung | Fehlerbehebung | FAQ | Alle Produkte ] Es erkennt 19 verschiedene harmonische Preisbildungen Dar
Bill Williams Advanced
Siarhei Vashchylka
5 (7)
Bill Williams Advanced is designed for automatic chart analysis using Bill Williams' "Profitunity" system. The indicator analyzes four timeframes at once. Manual (Be sure to read before purchasing) Advantages 1. Automatically analyzes the chart using the "Profitunity" system of Bill Williams. The found signals are placed in a table in the corner of the screen. 2. Equipped with a trend filter based on the Alligator indicator. Most of the system signals are recommended to be used only accordi
PZ Trend Trading MT5
PZ TRADING SLU
3.67 (3)
Trend Trading ist ein Indikator, der so weit wie möglich von den Markttrends profitiert, indem er Pullbacks und Breakouts zeitlich festlegt. Sie findet Handelsmöglichkeiten, indem sie analysiert, was der Preis während etablierter Trends tut. [ Installationsanleitung | Update-Anleitung | Fehlerbehebung | FAQ | Alle Produkte ] Handeln Sie mit Zuversicht und Effizienz an den Finanzmärkten Profitieren Sie von etablierten Trends, ohne ins Wanken zu geraten Profitable Pullbacks, Ausbrüche und vor
FxaccurateLS
Shiv Raj Kumawat
WHY IS OUR FXACCCURATE LS MT5 THE PROFITABLE ? PROTECT YOUR CAPITAL WITH RISK MANAGEMENT Gives entry, stop and target levels from time to time. It finds Trading opportunities by analyzing what the price is doing during established trends. POWERFUL INDICATOR FOR A RELIABLE STRATEGIES We have made these indicators with a lot of years of hard work. It is made at a very advanced level. Established trends provide dozens of trading opportunities, but most trend indicators completely ignore them!
PZ Swing Trading MT5
PZ TRADING SLU
5 (4)
Swing Trading ist der erste Indikator, der Schwankungen in Trendrichtung und mögliche Umkehrschwankungen erkennt. Es wird der in der Handelsliteratur weit verbreitete Baseline-Swing-Trading-Ansatz verwendet. Der Indikator untersucht mehrere Preis- und Zeitvektoren, um die aggregierte Trendrichtung zu verfolgen und erkennt Situationen, in denen der Markt überverkauft oder überkauft ist und zur Korrektur bereit ist. [ Installationsanleitung | Update-Anleitung | Fehlerbehebung | FAQ | Alle Produkte
PZ Day Trading MT5
PZ TRADING SLU
2.83 (6)
Dieser Indikator erkennt Preisumkehrungen im Zick-Zack, wobei nur Preisaktionsanalysen und ein Donchian-Kanal verwendet werden. Es wurde speziell für den kurzfristigen Handel entwickelt, ohne dass ein Nachlackieren oder ein Backpainting erforderlich ist. Es ist ein fantastisches Werkzeug für clevere Trader, die darauf abzielen, das Timing ihrer Operationen zu verbessern. [ Installationsanleitung | Update-Anleitung | Fehlerbehebung | FAQ | Alle Produkte ] Erstaunlich einfach zu handeln Es bi
The iChannels
BeeXXI Corporation
5 (1)
Ultra-fast recognition of parabolic channels (as well as linear, horizontal and wavy channels) throughout the depth of history, creating a hierarchy of channels. Required setting: Max bars in chart: Unlimited This indicator is designed primarily for algorithmic trading, but can also be used for manual trading.  This indicator will have a very active evolution in the near future and detailed descriptions on how to apply to create robots
Dragon Multi Indicator MT5
Mansour Babasafary
5 (5)
3 Indicators in 1 indicator Strategy based on price action Made specifically for the best forex currency pairs Can be used in the best time frame of the market at a very reasonable price This indicator is basically 3 different indicatos . But we have combined these 3 indicators in 1 indicator so that you can use 3 indicators at the lowest price. All three strategies are based on price action. But based on different trends. Long term, medium term and short term Attributes : No repaintin
[ MT4 Version ] Only the next 10 units at current price! Final price: $299 Are you tired of spending months on demo or live accounts to test your trading strategies? The Backtesting Simulator is the ultimate tool designed to elevate your backtesting experience to new heights. Utilizing Metatrader historical symbol information, it offers an unparalleled simulation of real market conditions. Take control of your testing speed, test ideas quickly or at a slower pace, and witness remarkable improve
How to use Pair Trading Station Pair Trading Station is recommended for H1 time frame and you can use it for any currency pairs. To generate buy and sell signal, follow few steps below to apply Pair Trading Station to your MetaTrader terminal. When you load Pair Trading Station on your chart, Pair Trading station will assess available historical data in your MetaTrader platforms for each currency pair. On your chart, the amount of historical data available will be displayed for each currency pai
Piranha version 2
Maria Strudov
5 (1)
"Piranha" - an autonomous trading system that determines overbought and oversold levels on the chart. Red and blue zones represent overbought and oversold levels respectively. Entry points are marked with arrows: a downward arrow in the red zone for "sell" and an upward arrow in the blue zone for "buy". The Take profit level is indicated by the green moving average. Key features: Adjusting the Take profit level as the green moving average changes position. Averaging ability when a new market e
Introducing the South African Sniper indicator created by a small group of traders with a few years trading trading the financial market profitably . This is a plug and play indicator that provides you with  BUY and SELL (SNIPER ENTRY) signals with TARGET and trail stops. The indicator Works with all MT5 trading instruments. The indicator uses previous  chart data as receipt to speculate on future market moves.  "The South African Sniper indicator community are very happy with the indicator an
Divergenzen sind schwierig zu finden und seltener anzutreffen. Sie sind eines der zuverlässigsten Handelsszenarien. Dieser Indikator sucht automatisch mit Ihrem bevorzugten Oszillator nach regelmäßigen und versteckten Abweichungen. [ Installationsanleitung | Update-Anleitung | Fehlerbehebung | FAQ | Alle Produkte ] Einfach zu handeln Findet regelmäßige und versteckte Abweichungen Unterstützt viele bekannte Oszillatoren Implementiert Handelssignale basierend auf Ausbrüchen Zeigt geeignete
Limited Offer:    Take advantage of our limited-time offer on the FxBears Powers Indicator! When you purchase this powerful tool, you'll also receive the renowned FxBears EA, an expert advisor that automatically executes the indicator's signals. Don't miss out on this unbeatable combination to enhance your trading strategy! No more losses with this indicator, test it for years ago and see if there is losses in one day results. but before testing it please see the explaining video down here. 
Contact us to receive a comprehensive user guide after purchasing. William Delbert Gann, commonly known as W.D. Gann, was an exceptional market analyst renowned for his unique trading style in the early 20th century.  His trading techniques were based on a blend of mathematics, geometry, astrology, and ancient mathematics. Gann believed that stock market movements followed specific patterns and cycles, rather than being random. His methodologies, celebrated for their accuracy and relevance, con
MetaForecast M5
Vahidreza Heidar Gholami
5 (2)
MetaForecast prognostiziert und visualisiert die Zukunft eines beliebigen Marktes basierend auf den Harmonien in den Preisdaten. Obwohl der Markt nicht immer vorhersehbar ist, kann MetaForecast, wenn es ein Muster im Preis gibt, die Zukunft so genau wie möglich voraussagen. Im Vergleich zu ähnlichen Produkten kann MetaForecast durch die Analyse von Markttrends genauere Ergebnisse erzeugen. Eingabeparameter Past size (Vergangene Größe) Gibt an, wie viele Balken MetaForecast verwendet, um ein Mo
The indicator is designed to close positions on the market in time. For example: to take profits ahead of schedule if the price has not reached TakeProfit, and the market is turning around. The indicator analyzes the momentum, not the trend. He does not give any information about the trend. The indicator is well suited for finding divergence. The Ershov 38 Parrots indicator dynamically adjusts to the market and detects price movement impulses of medium and high amplitude. It almost does not rea
Mega Spikes Max
Niccyril Chirindo
Boom and Crash Indicator - MT5 Spike Detector with Trade Alerts "Unlock the secrets of trading Boom and Crash spikes with our powerful MT5 indicator! This spike detection tool provides accurate buy and sell signals, trade alerts, and profit maximization. Perfect for scalping, day trading, and swing trading. Get the best Boom and Crash strategy with our Deriv Boom and Crash spike indicator. Key Features & Benefits: Accurate Boom and Crash spike detection Reliable buy and sell signals with no
Golden Gate Algo MT5
James David Lane
4 (6)
40% RABATT ZU WEIHNACHTEN! PREISERHÖHUNG AUF $250 AM 1. JANUAR! Vorstellung von GoldenGate Entries: Eine hochmoderne Handelslösung! Entdecken Sie einen revolutionären Ansatz zum Handel mit GoldenGate Entries (GGE), einem fortschrittlichen Indikator, der entwickelt wurde, um Ihr Handelserlebnis zu verbessern. GGE bietet eine umfassende Palette von Funktionen, um Benutzer mit Präzision und Vertrauen in ihren Handelsentscheidungen auszustatten. Paare: Beliebig (FX - Rohstoffe - Aktien - Akti
Go Way TREND
Ywsf Hsyn Hmad Alrsh
Gehen Sie mit dem Trend. Ja, warten Sie in einem 15-Minuten-Frame auf das Einstiegssignal, ob Kauf oder Verkauf, und überprüfen Sie das Signal, wenn es in einem 30-Minuten-Frame erscheint (manchmal dauert es eine Stunde oder länger, bis das Signal erscheint. Sie können zurückkehren Gehen Sie zum 15-Minuten-Rahmen und kehren Sie zum 30-Minuten-Rahmen zurück und wiederholen Sie dies, bis das Hauptsignal für Sie erscheint. Wenn das Signal im 30-Minuten-Rahmen erscheint, steigen Sie mit dem Preis e
VIP Buy Sell Signals
Hapu Arachchilage Tharindu Lakmal
Here is a Live DEMO testing account for the indicator. ( Profit proofs ) Login (MT5) - 100246 Server - FusionMarkets-Demo Investor PW - VIPindicator@2024 Click bellow link to download the FREE strategy PDF for this indicator   (Google Drive) Download Strategy Introduction   The   "Buy Sell Signals"   is designed to provide BUY and SELL trade signals based on the current market conditions.   A   Profitable   Trading Strategy   (Chee sheet)   is provided for this trading indicator.   (Read the
Noize Absorption Index - is the manual trading system that measures the difference of pressure between bears forces and bulls forces. Green line - is a noize free index that showing curent situation. Zero value of index shows totally choppy/flat market.Values above zero level shows how powerfull bullish wave is and values below zero measures bearish forces.Up arrow appears on bearish market when it's ready to reverse, dn arrow appears on weak bullish market, as a result of reverse expectation.
TrendMaestro5
Stefano Frisetti
note: this indicator is for METATRADER4, if you want the version for METATRADER5 this is the link:  https://www.mql5.com/it/market/product/108106 TRENDMAESTRO ver 2.4 TRENDMAESTRO recognizes a new TREND in the bud, he never makes mistakes. The certainty of identifying a new TREND is priceless. DESCRIPTION TRENDMAESTRO identifies a new TREND in the bud, this indicator examines the volatility, volumes and momentum to identify the moment in which there is an explosion of one or more of these data a
SMCpro
Arief
5 (1)
Currently Price  20% OFF  ( for unlimited use ) Indicator   USER MANUAL , trade setups, solving issues, etc :  Direct Download Here     (  for users only  ) Hello World! Introducing.. SMCpro tool and Indicator for  MetaTrader 5 , a cutting-edge feature designed to revolutionize your trading experience. With innovative ICT Smart Money Concept, you gain unparalleled insight into market dynamics, empowering you to make informed trading decisions like never before. SMC Indicator built on th
Weitere Produkte dieses Autors
[跟单系统] T he most friendly Copier interactive interface, the most abundant easy-to-use functions, and the best Copy solution.    EASY   : Easy to use, load and select the Master or SLAVE to use easily  FAST:   Quickly copy orders, algorithmic optimal follow-up mechanism, priority calculation of new signals, priority queue processing received special signals Multiple:   1. Support multiple signals to be sent at the same time, multiple accounts can select multiple accounts to copy at the same time
[跟单系统] T he most friendly Copier interactive interface, the most abundant easy-to-use functions, and the best Copy solution.    EASY   : Easy to use, load and select the Master or SLAVE to use easily FAST:   Quickly copy orders, algorithmic optimal follow-up mechanism, priority calculation of new signals, priority queue processing received special signals Multiple:   1. Support multiple signals to be sent at the same time, multiple accounts can select multiple accounts to copy at the same time 2
Fit Channel MT5
Kaijun Wang
3.67 (3)
The market price usually falls between the borders of the channel    .   If the price is out of range , it is a trading signal or trading opportunity  . Basically , Fit Channel can be used to help determine overbought and oversold conditions in the market. When the market price is close to the upper limit, the market is considered overbought (sell zone). Conversely, when the market price is close to the bottom range, the market is considered oversold (buy zone). However, the research can
Торговля пивотами: 1.pp pivot 2. r1 r2 r3, s1 s2 s3 Necessary for traders: tools and indicators Waves automatically calculate indicators, channel trend trading Perfect trend-wave automatic calculation channel calculation , MT4 Perfect trend-wave automatic calculation channel calculation , MT5 Local Trading copying Easy And Fast Copy , MT4 Easy And Fast Copy , MT5 Local Trading copying For DEMO Easy And Fast Copy , MT4 DEMO Easy And Fast Copy , MT5 DEMO Empfehlen dringend Trendindikatoren,
FREE
Necessary for traders: tools and indicators Waves automatically calculate indicators, channel trend trading Perfect trend-wave automatic calculation channel calculation , MT4 Perfect trend-wave automatic calculation channel calculation , MT5 Local Trading copying Easy And Fast Copy , MT4 Easy And Fast Copy , MT5 Local Trading copying For DEMO Easy And Fast Copy , MT4 DEMO Easy And Fast Copy , MT5 DEMO 砖图 Renko PRO->>>   The display of the brick map on the main map. The Renko chart ideal
FREE
K Trade Assistant MT5
Kaijun Wang
4.67 (21)
Die       bester Partner für Händler!       Handelsassistent: Dies ist eine sehr funktionsreiche Handelshilfe. Die Entwicklung ist nicht einfach, bitte unterstützen Sie Pro. Klicken Sie, um zu springen K Trade Assistant Pro MT5 Bedienungsanleitung für den Trading Assistant Grundlegende Nutzungseinstellungen Basic: Sprachauswahlschalter unterstützen (unterstützt derzeit Chinesisch und Englisch)           automatische Spracherkennung Unterstützen Sie die Bindung von       Hotkey z
FREE
Pivot Trading 4
Kaijun Wang
5 (17)
Торговля пивотами: 1.pp pivot 2. r1 r2 r3, s1 s2 s3 Necessary for traders: tools and indicators Waves automatically calculate indicators, channel trend trading Perfect trend-wave automatic calculation channel calculation , MT4 Perfect trend-wave automatic calculation channel calculation , MT5 Local Trading copying Easy And Fast Copy , MT4 Easy And Fast Copy , MT5 Local Trading copying For DEMO Easy And Fast Copy , MT4 DEMO Easy And Fast Copy , MT5 DEMO Empfehlen dringend Trendindikatoren,
FREE
Necessary for traders: tools and indicators Waves automatically calculate indicators, channel trend trading Perfect trend-wave automatic calculation channel calculation , MT4 Perfect trend-wave automatic calculation channel calculation , MT5 Local Trading copying Easy And Fast Copy , MT4 Easy And Fast Copy , MT5 Local Trading copying For DEMO Easy And Fast Copy , MT4 DEMO Easy And Fast Copy , MT5 DEMO MACD называется скользящей средней конвергенции и расхождения, которая создается на основе дво
FREE
Der beste Partner für Händler!       Bedienungsanleitung für den Trading Assistant Grundlegende Nutzungseinstellungen Basic: Sprachauswahlschalter unterstützen (unterstützt derzeit Chinesisch und Englisch)           automatische Spracherkennung Unterstützen Sie die Bindung von       Hotkey zum Öffnen und Schließen von Positionen       , verwenden Sie Tastenkombinationen, um Positionen schnell zu öffnen und zu schließen ...       Tastenkombinationen zum Schließen von Positionen
Necessary for traders: tools and indicators Waves automatically calculate indicators, channel trend trading Perfect trend-wave automatic calculation channel calculation , MT4 Perfect trend-wave automatic calculation channel calculation , MT5 Local Trading copying Easy And Fast Copy , MT4 Easy And Fast Copy , MT5 Local Trading copying For DEMO Easy And Fast Copy , MT4 DEMO Easy And Fast Copy , MT5 DEMO Fortgeschrittene Bollinger Bands: 1. Die Bollinger-Schiene ändert ihre Farbe mit der Richtun
FREE
Fit Channel
Kaijun Wang
5 (5)
The market price usually falls between the borders of the channel. If the price is out of range, it is a trading signal or trading opportunity. Basically, Fit Channel can be used to help determine overbought and oversold conditions in the market. When the market price is close to the upper limit, the market is considered overbought (sell zone). Conversely, when the market price is close to the bottom range, the market is considered oversold (buy zone). However, the research can be used to
Necessary for traders: tools and indicators Waves automatically calculate indicators, channel trend trading Perfect trend-wave automatic calculation channel calculation , MT4 Perfect trend-wave automatic calculation channel calculation , MT5 Local Trading copying Easy And Fast Copy , MT4 Easy And Fast Copy , MT5 Local Trading copying For DEMO Easy And Fast Copy , MT4 DEMO Easy And Fast Copy , MT5 DEMO 砖图Renko PRO->>> The display of the brick map on the main map. The Renko chart ideally remo
FREE
Necessary for traders: tools and indicators Waves automatically calculate indicators, channel trend trading Perfect trend-wave automatic calculation channel calculation , MT4 Perfect trend-wave automatic calculation channel calculation , MT5 Local Trading copying Easy And Fast Copy , MT4 Easy And Fast Copy , MT5 Local Trading copying For DEMO Easy And Fast Copy , MT4 DEMO Easy And Fast Copy , MT5 DEMO Fortgeschrittene Bollinger Bands: 1. Die Bollinger-Schiene ändert ihre Farbe mit der Richtun
FREE
K Trade Assistant
Kaijun Wang
4.77 (26)
Der beste Partner für Händler!     Handelsassistent: Dies ist eine sehr funktionsreiche Handelshilfe. Die Entwicklung ist nicht einfach, bitte unterstützen Sie Pro. Klicken Sie, um zu springen K Trade Assistant Pro     Bedienungsanleitung für den Trading Assistant Grundlegende Nutzungseinstellungen Basic: Sprachauswahlschalter unterstützen (unterstützt derzeit Chinesisch und Englisch)       um die Sprache automatisch zu identifizieren Unterstützen Sie die Bindung
FREE
KDJ Index For MT5
Kaijun Wang
4.29 (14)
Necessary for traders: tools and indicators Waves automatically calculate indicators, channel trend trading Perfect trend-wave automatic calculation channel calculation , MT4 Perfect trend-wave automatic calculation channel calculation , MT5 Local Trading copying Easy And Fast Copy , MT4 Easy And Fast Copy , MT5 Local Trading copying For DEMO Easy And Fast Copy , MT4 DEMO Easy And Fast Copy , MT5 DEMO "Cooperative QQ:556024"  "Cooperation wechat:556024"  "Cooperative email:556024@qq.com" Strong
FREE
KDJ Index 4
Kaijun Wang
5 (11)
Necessary for traders: tools and indicators Waves automatically calculate indicators, channel trend trading Perfect trend-wave automatic calculation channel calculation , MT4 Perfect trend-wave automatic calculation channel calculation , MT5 Local Trading copying Easy And Fast Copy , MT4 Easy And Fast Copy , MT5 Local Trading copying For DEMO Easy And Fast Copy , MT4 DEMO Easy And Fast Copy , MT5 DEMO "Cooperative QQ: 556024"  "Kooperation wechat: 556024"  "Genossenschaftliche E-Mail: 556024@qq
FREE
Indikatoren sind für Trendfolger! Ein Handelssystem, das aus drei gleitenden Durchschnitten aufgebaut ist. Handeln Sie mit dem Trend und lassen Sie die Gewinne laufen. Necessary for traders: tools and indicators Waves automatically calculate indicators, channel trend trading Perfect trend-wave automatic calculation channel calculation , MT4 Perfect trend-wave automatic calculation channel calculation , MT5 Local Trading copying Easy And Fast Copy , MT4 Easy And Fast Copy , MT5 Local Trading c
FREE
KTrade Fibo For MT5
Kaijun Wang
4.9 (10)
Necessary for traders: tools and indicators Waves automatically calculate indicators, channel trend trading Perfect trend-wave automatic calculation channel calculation , MT4 Perfect trend-wave automatic calculation channel calculation , MT5 Local Trading copying Easy And Fast Copy , MT4 Easy And Fast Copy , MT5 Local Trading copying For DEMO Easy And Fast Copy , MT4 DEMO Easy And Fast Copy , MT5 DEMO Fibo: from KTrade 1. Automatically calculate and analyze the band. -> Get the desired band 2.
FREE
Indikatoren sind für Trendfolger! Ein Handelssystem, das aus drei gleitenden Durchschnitten aufgebaut ist. Handeln Sie mit dem Trend und lassen Sie die Gewinne laufen. Necessary for traders: tools and indicators Waves automatically calculate indicators, channel trend trading Perfect trend-wave automatic calculation channel calculation , MT4 Perfect trend-wave automatic calculation channel calculation , MT5 Local Trading copying Easy And Fast Copy , MT4 Easy And Fast Copy , MT5 Local Trading c
FREE
Necessary for traders: tools and indicators Waves automatically calculate indicators, channel trend trading Perfect trend-wave automatic calculation channel calculation , MT4 Perfect trend-wave automatic calculation channel calculation , MT5 Local Trading copying Easy And Fast Copy , MT4 Easy And Fast Copy , MT5 Local Trading copying For DEMO Easy And Fast Copy , MT4 DEMO Easy And Fast Copy , MT5 DEMO The homeopathic indicator is also called the CCI indicator. The CCI indicator was propos
FREE
Necessary for traders: tools and indicators Waves automatically calculate indicators, channel trend trading Perfect trend-wave automatic calculation channel calculation , MT4 Perfect trend-wave automatic calculation channel calculation , MT5 Local Trading copying Easy And Fast Copy , MT4 Easy And Fast Copy , MT5 Local Trading copying For DEMO Easy And Fast Copy , MT4 DEMO Easy And Fast Copy , MT5 DEMO Can set the cycle for other varieties of K line graph covered this window, fluctuations obse
FREE
XM Channel
Kaijun Wang
4.67 (3)
The market price usually falls between the borders of the channel . If the price is out of range, it is a trading signal or trading opportunity . Basically, Fit Channel can be used to help determine overbought and oversold conditions in the market. When the market price is close to the upper limit, the market is considered overbought (sell zone). Conversely, when the market price is close to the bottom range, the market is considered oversold (buy zone). However, the research can be used
Necessary for traders: tools and indicators Waves automatically calculate indicators, channel trend trading Perfect trend-wave automatic calculation channel calculation , MT4 Perfect trend-wave automatic calculation channel calculation , MT5 Local Trading copying Easy And Fast Copy , MT4 Easy And Fast Copy , MT5 Local Trading copying For DEMO Easy And Fast Copy , MT4 DEMO Easy And Fast Copy , MT5 DEMO Strongly recommend trend indicators,   automatic calculation of wave standard   and   MT5 ve
FREE
Donchian通道(唐奇安通道指标)是用于交易突破的最古老、最简单的技术指标之一。 一般来说,唐奇安通道的宽度越宽,市场波动就越大,而唐奇安通道越窄,市场波动性也就越小 。此外,价格走势可以穿过布林带,但你看不到唐奇安通道的这种特征,因为其波段正在测量特定时期的最高价和最低价。 交易实用必备工具指标 波浪自动计算指标,通道趋势交易 完美的趋势-波浪自动计算通道计算 , MT4版本 完美的趋势-波浪自动计算通道计算 , MT5版本 本地跟单复制交易 Easy And Fast Copy , MT4版本 Easy And Fast Copy , MT5版本 本地跟单复制交易 模拟试用 Easy And Fast Copy , MT4 模拟账号运行 Easy And Fast Copy , MT5 模拟账号运行 唐奇安通道指标计算: 唐奇安上阻力线 - 由过去N天的当日最高价的最大值形成。 唐奇安下支撑线 - 由过去N天的当日最低价的最小值形成。 中心线 - (上线 + 下线)/ 2   唐奇安通道信号   唐奇安通道常用作突破指标。它提供了两种主要类型的突破信号,一个是上阻力线或下支撑线
FREE
Necessary for traders: tools and indicators Waves automatically calculate indicators, channel trend trading Perfect trend-wave automatic calculation channel calculation , MT4 Perfect trend-wave automatic calculation channel calculation , MT5 Local Trading copying Easy And Fast Copy , MT4 Easy And Fast Copy , MT5 Local Trading copying For DEMO Easy And Fast Copy , MT4 DEMO Easy And Fast Copy , MT5 DEMO MACD is called Convergence and Divergence Moving Average, which is developed from the double e
FREE
Indicators are professional data statistics, position orders, historical order analysis->>>>>> <This version is in Chinese -> English version please move> Necessary for traders: tools and indicators Waves automatically calculate indicators, channel trend trading Perfect trend-wave automatic calculation channel calculation , MT4 Perfect trend-wave automatic calculation channel calculation , MT5 Local Trading copying Easy And Fast Copy , MT4 Easy And Fast Copy , MT5 Local Trading copying For DEMO
FREE
Indicators are professional data statistics, position orders, historical order analysis->>>>>> <This version is in Chinese -> English version please move> Necessary for traders: tools and indicators Waves automatically calculate indicators, channel trend trading Perfect trend-wave automatic calculation channel calculation , MT4 Perfect trend-wave automatic calculation channel calculation , MT5 Local Trading copying Easy And Fast Copy , MT4 Easy And Fast Copy , MT5 Local Trading copying For DE
FREE
Donchian通道(唐奇安通道指标)是用于交易突破的最古老、最简单的技术指标之一。   一般来说,唐奇安通道的宽度越宽,市场波动就越大,而唐奇安通道越窄,市场波动性也就越小 。此外,价格走势可以穿过布林带,但你看不到唐奇安通道的这种特征,因为其波段正在测量特定时期的最高价和最低价。 交易实用必备工具指标 波浪自动计算指标,通道趋势交易 完美的趋势-波浪自动计算通道计算 , MT4版本 完美的趋势-波浪自动计算通道计算 , MT5版本 本地跟单复制交易 Easy And Fast Copy , MT4版本 Easy And Fast Copy , MT5版本 本地跟单复制交易 模拟试用 Easy And Fast Copy , MT4 模拟账号运行 Easy And Fast Copy , MT5 模拟账号运行 唐奇安通道指标计算: 唐奇安上阻力线 - 由过去N天的当日最高价的最大值形成。 唐奇安下支撑线 - 由过去N天的当日最低价的最小值形成。 中心线 - (上线 + 下线)/ 2   唐奇安通道信号   唐奇安通道常用作突破指标。它提供了两种主要类型的突破信号,一个是上阻力线或下支
FREE
MACD divergence signals   MACD is called Convergence and Divergence Moving Average, which is developed from the double exponential moving average. The fast exponential moving average (EMA12) is subtracted from the slow exponential moving average (EMA26) to get the fast DIF, and then 2× (Express DIF-DIF's 9-day weighted moving average DEA) Get the MACD bar. The meaning of MACD is basically the same as the double moving average, that is, the dispersion and aggregation of the fast and slow moving a
九转序列,源自于TD序列,是因TD序列的9天收盘价研判标准而得名。 汤姆·德马克(Tom DeMark)技术分析界的着名大师级人物,创建了以其名字首字母命名的TD系列的很多指标,价格反转的这个指标就是其中重要的一个,即TD序列。 德马克原版TD序列指标要复杂一些,想研究就自行看关于德马克的资料吧。 这里只说简单的TD序列(九转序列)。 九转序列分为两种结构,低九买入结构和高九卖出结构。 TD高九卖出结构:连续出现的九根K线,这些K线的收盘价都比各自前面的第四根K线的收盘价高,如果满足条件,就在各K线上方标记相应的数字,最后1根就标记为9,如果条件不满足,则K线计数中断,原计数作废重新来数K线。如出现高9,则股价大概率会出现转折。 TD低九买入结构:连续出现的九根K线,这些K线的收盘价都比各自前面的第四根K线的收盘价低,如果满足条件,就在各K线下方标记相应的数字,最后1根就标记为9,如果条件不满足,则K线计数中断,原计数作废重新来数K线。如出现低9,则股价大概率会出现转折。 结构的本质是时间和空间的组合,时间是横轴,空间是纵轴,不同的时间周期和空间大小的组合,形成不同的结构形态,不同
Auswahl:
Peng Jin
320
Peng Jin 2023.03.20 04:36 
 

这套波浪系统非常棒,解决了缠论的画线段问题,从级别的不断递推,分析行情有帮助,感谢作者

elite luis
3331
elite luis 2023.03.08 17:15 
 

Amazing indicator, another quality product from Author, Big Thank you! Author is super friendly and responsive, any issue he get it fix fast also he is open to idea suggestions and continously updating to improve his indicators, he is extremely passionate in what he is doing, deserved more than 5 stars for his dedication! Well Done!

Kaijun Wang
137564
Antwort vom Entwickler Kaijun Wang 2023.03.09 03:04
Thank you for your support.
Antwort auf eine Rezension
Version 7.10 2023.04.11
>>>>>>>>>>>>>>>
Version 6.83 2023.03.17
>>>>>>>>>>
Version 6.82 2023.03.09
>>>>>>>>>>>
Version 6.81 2023.03.08
>>>>>>>>>>>>>>
Version 6.8 2023.03.08
>>>>>
1.增加动态组件的大小调整,和自适应大小
2.增加小组件控制,可以删除屏幕中的各项组件,可以多样化加载图表
3.增加国际交易风格的自动切换,自适应国际交易习惯
4.增加震荡区闪烁控制,可以设置关闭.
5.优化更新算法逻辑,优化判断条件细节
6.增加主趋势浪显示
Version 3.3 2022.03.21
>>>>>>>>>>>
Version 3.2 2022.03.19
>>>>
1.算法更新
2.纠错更新
Version 3.1 2021.11.22
>>>>>>>>>>>>
Version 2.88 2021.06.19
>>>>>
1.更新第一次图表计算计算K限制,0为取消限制....
2.更新指标加载后,关闭指标后复原图表的各项设置
Version 2.6 2021.03.29
>>>>>>
修复长时间间隔运行未计算的空白段
Version 2.5 2020.12.28
>>>>>>>>>>
Version 2.2 2020.12.27
>>>>>>增加风格自动设置为白底,可关闭
Version 2.0 2020.12.19
>>>>>>>>>>
updata alert function...
Version 1.20 2020.12.06
>>>>>>>>>算法优化
Version 1.10 2020.10.20
>>>>更新通道显示不友好