WaveTheoryFully automatic calculation
- Indikatoren
- Kaijun Wang
- Version: 7.10
- Aktualisiert: 11 April 2023
- Aktivierungen: 5
Dieser Indikator ist ein perfekter automatischer Wellenanalyse-Indikator für den praktischen Handel!
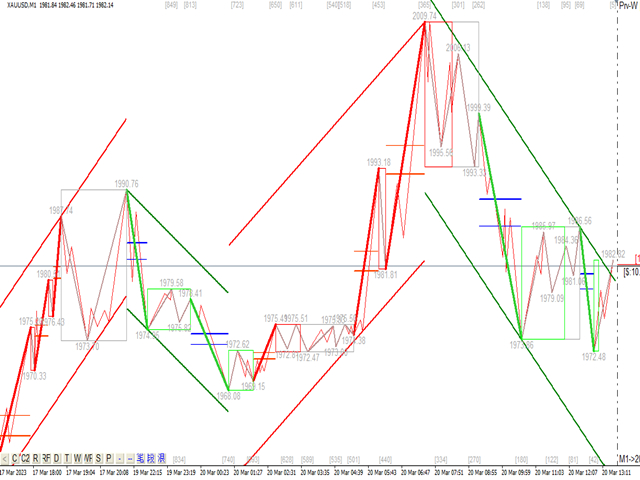
Die standardisierte Definition des Bandes ist nicht mehr eine Welle von verschiedenen Leuten, und das Ziehen von menschengemachten Interferenzen wird eliminiert, was eine Schlüsselrolle bei der gründlichen Analyse des Ansatzes spielt. =>Increase the choice of international style mode, (red fall green rise style)
⭐⭐⭐ Derzeit Kaufrabatt! ⭐⭐⭐
Inhalt des Index:
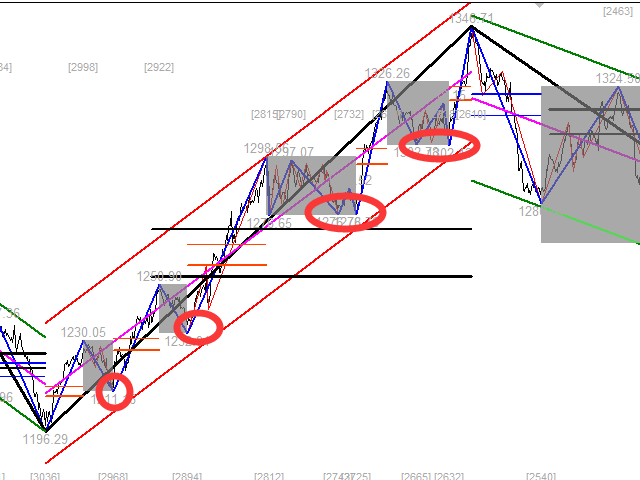
1. Grundwelle: Zuerst haben wir den Wendepunkt der Grundschwankung im Preisschwankungsprozess gefunden, seine Order ist natürlich nicht zu stark, was eine Grundlage für die nächste Berechnung liefert.
2. Sekundärband : Auf der Basis der Grundwelle wird durch Algorithmusanalyse ein offensichtlicheres Sekundärband erhalten, und das Sekundärband bietet eine Grundlage für die Wellenanalyse
3. Welle: Es gibt einen klareren Trend und eine klarere und intuitivere Richtung. Um zu analysieren, ob eine Welle anhält, müssen Sie sich die Form des sekundären Wellenbandes ansehen und die Zusammensetzung der sekundären Welle analysieren, um die anschließende Vorhersage der Welle.
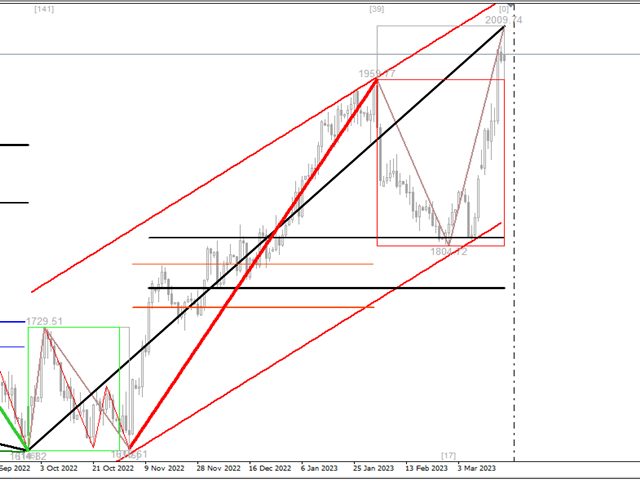
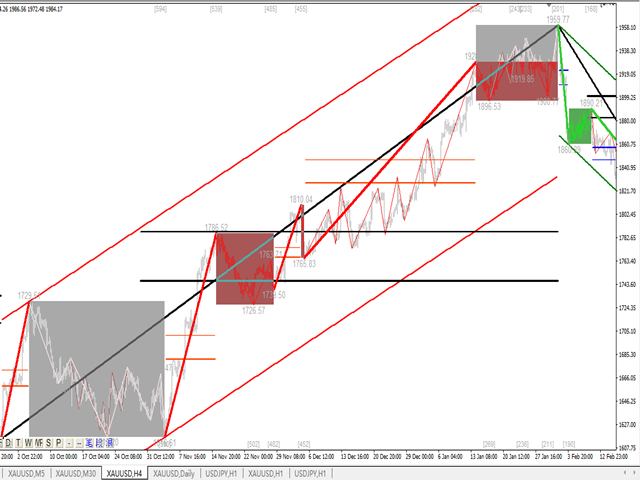
4. Kanal: Die Kanalberechnung verwendet eine lineare Regressionsmethode zur Berechnung.
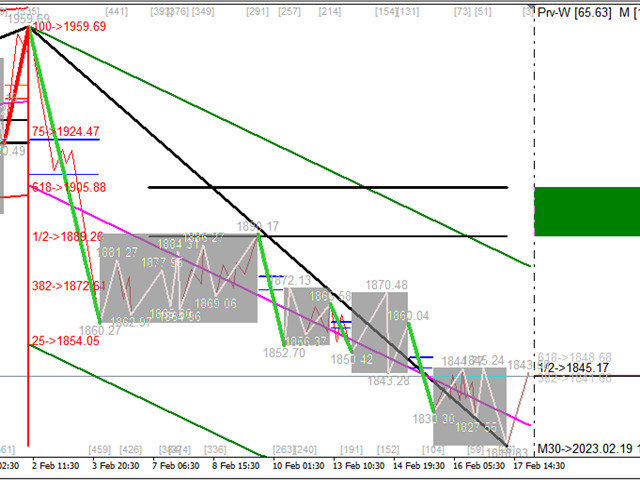
5. Retracement: Die beiden wichtigen Retracements in der Welle werden am Ende jeder Welle angezeigt. Die relative Stärke dieser wichtigen Retracements im tatsächlichen Kampf und das tatsächliche Retracement bestimmt die Dynamik des Trends
6. Schwingungsintervall: Das Schwingungsintervall ist im Indikator markiert
Indikator Kampf:
1. Die Quelle der aktuellen Kampftheorie ist die grundlegende Wellentheorie, die taoistische Theorie.
2. Die Theorie des tatsächlichen Kampfes leitet sich mehr vom tatsächlichen Kampf ab, und Sie werden immer davon profitieren, wenn Sie Bilder tausendmal lesen.
3. Wollte ursprünglich einige praktische Erfahrungen schreiben, aber ich habe festgestellt, dass der Operationsplan in verschiedenen Varianten und Stärken leicht angepasst wurde. Die Transaktion wird ständig geschrieben und aktualisiert. Die Transaktion ist wie eine im Sand vergrabene Linie, auch wenn sie greift das Seil, aber der Sand verändert ständig seine Form.
4. Wenn die Welle durch Quantifizierung definiert wird, wird die Transaktion einfach und effektiv, der Trend wird sehr klar, es gibt den allgemeinen Trend im Herzen und alles wird einfach und effektiv.
5. Ob Links- oder Rechtshandel, ob Trendhandel oder oszillierendes Trading, diese Indikatoren haben ihre Antworten: Jeder muss den Rhythmus, das Niveau, die Dynamik und die Zeit des Trends und des Schocks spüren ist extrem wichtig.
6. Um die Wellen und Handelswellen zu verstehen, müssen wir die Multi-Level- und Multi-Periode analysieren.
Tatsächliche Kampferfahrung:
1. Die Wellentheorie und die taoistische Theorie sind geschrieben, aber sie stimmen nicht vollständig mit den Gesetzen der natürlichen Schwankungen überein.Viele schwierige Situationen werden im eigentlichen Transaktionsanalyseprozess gefunden.
2. Im Folgenden können wir den Markt in zwei Typen unterteilen, den geordneten analysierbaren Markt und den ungeordneten Markt.
3. Es gibt Trends und Schocks auf dem geordneten und analysierbaren Markt. Dieses Marktsegment kann von uns analysiert werden, dh der grafische Teil und der handelbare Teil. Sobald dieser Teil bestellt ist, wird er die geordneten Eigenschaften beibehalten Wir können genug Gewinn damit erzielen
4. Ungeordneter Markt, Schwankungen werden ungeordnet erscheinen, anders als Schocks, ungeordneter Markt kann nicht teilnehmen Geld in der richtigen Reihenfolge aufheben, in Unordnung vermeiden.
Ich hoffe, Menschen zu treffen, die dazu bestimmt sind, die Freude am gemeinsamen Handel zu teilen und zusammen zu wachsen!
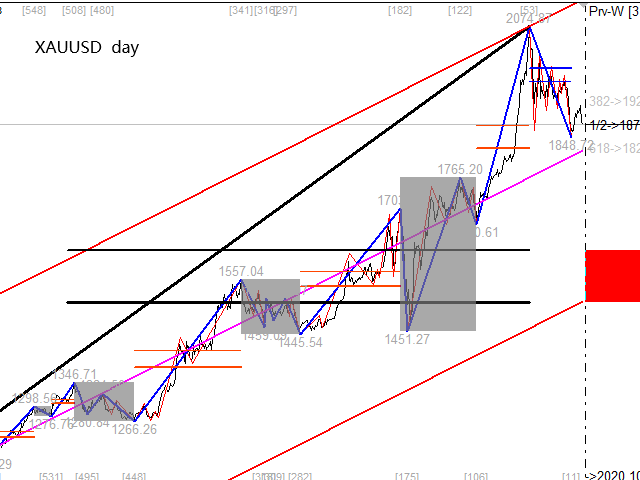
Es eignet sich eher für Gold, Rohöl, Pfund-Tage, Bitcoin und andere Trendsorten.
von kjoin.


I like your indicator but I need to know more on the answer to my question, appreciate your answer to all my question in the comment page so that I can decide to buy your MT5 soon, Thank you.
*Author is very fast he immediately made all the improvement and updated to new version 6.8* the new version 6.8 latest is Amazing, we can diy to customise what information to display and hide on chart, it is 3-in-1 with Support/Resistant + Zig Zag + Trend Channel + all the useful information like Daily Range, Fibo Golden Ratio, it is the indispensable swiss knife multipurpose for trading! very powerful tool, worth every penny Best Buy for 2023! Big Thank you to Author for being so passionate and dedicated to his indicator, deserve more than 5 stars!