Angulation
- Indikatoren
- Alexey Topounov
- Version: 2.3
- Aktualisiert: 30 November 2021
- Aktivierungen: 7
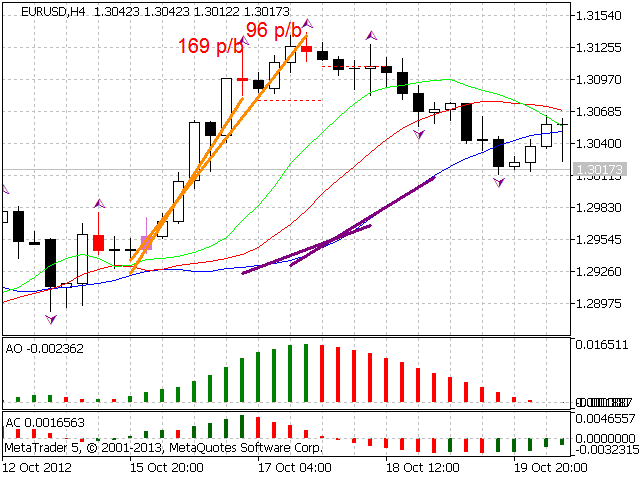
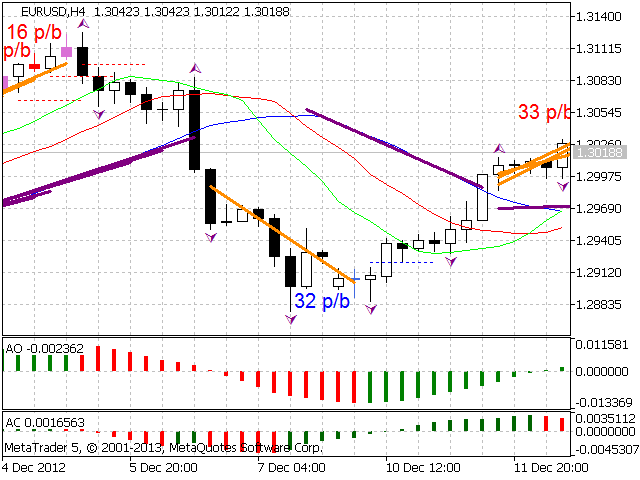
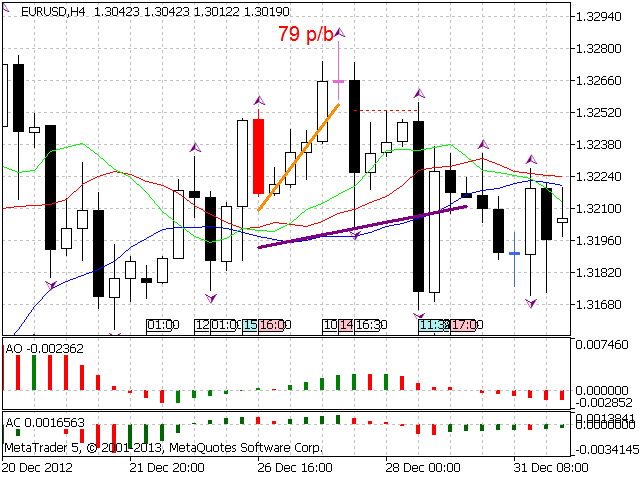
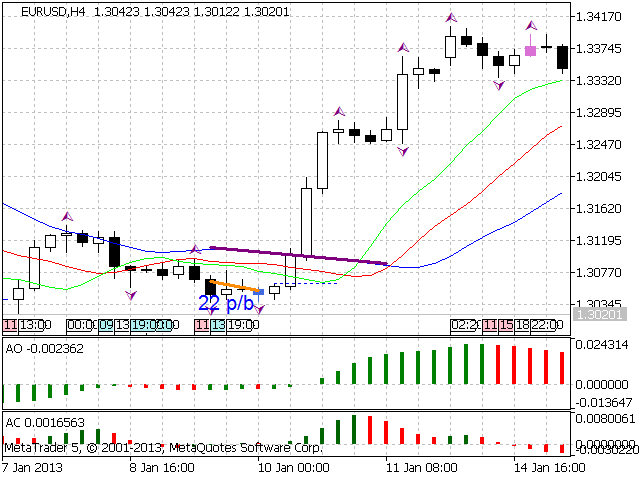
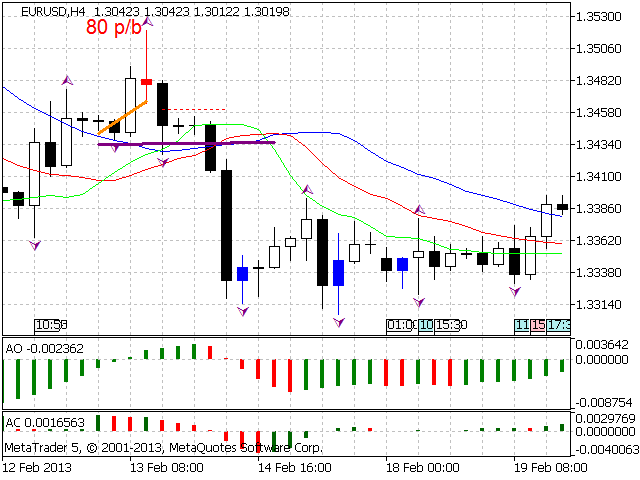
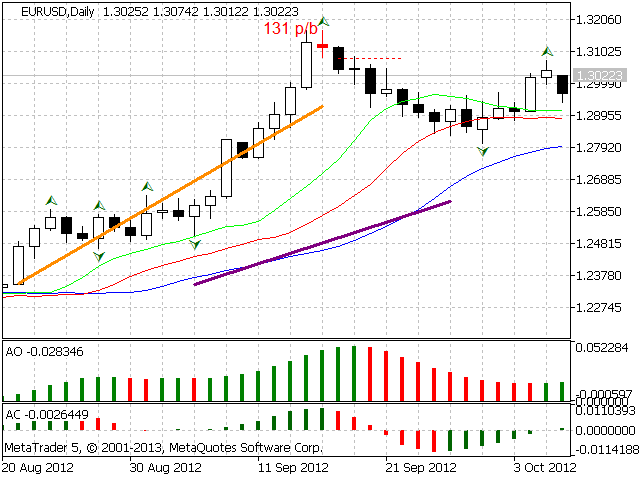
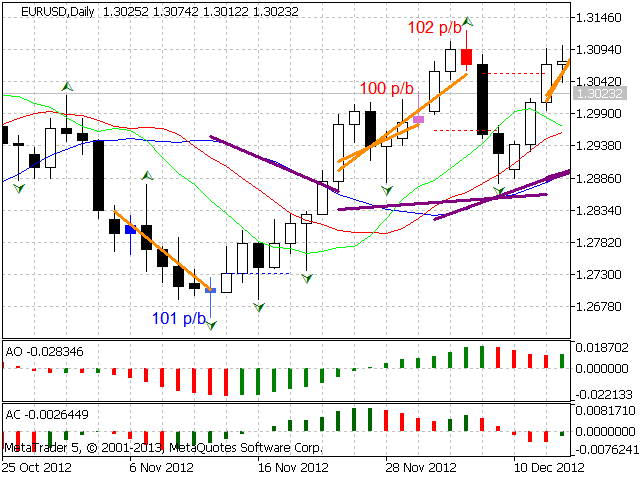
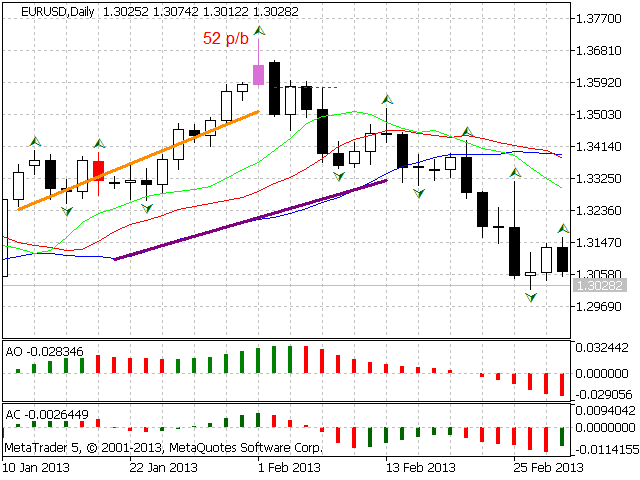
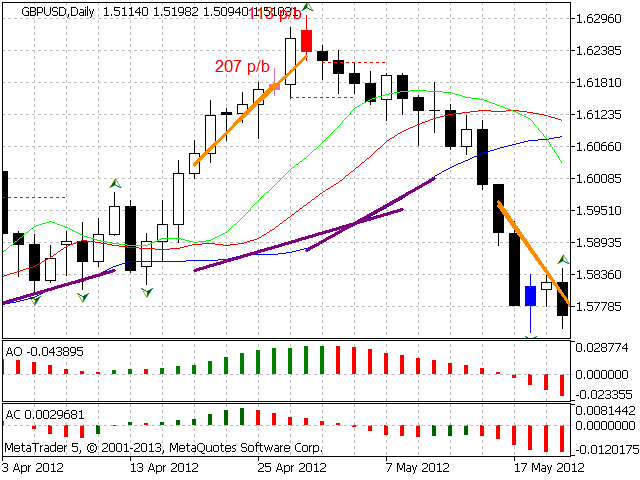
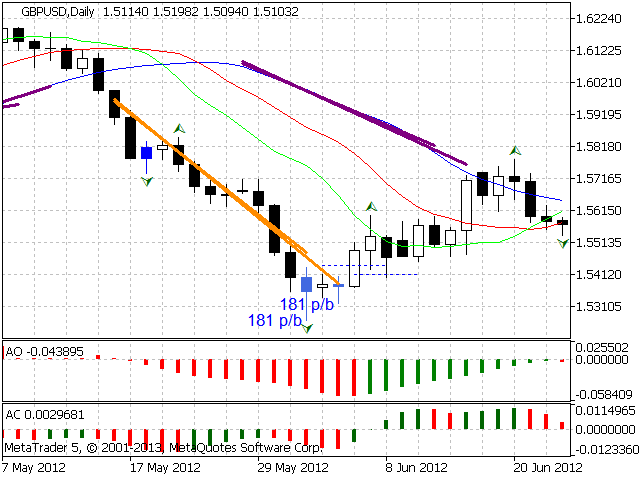
According to Bill Williams' trading strategy described in the book "Trading Chaos: Maximize Profits with Proven Technical Techniques" the indicator displays the following items in a price chart:
1.Bearish and bullish divergent bars:
- Bearish divergent bar is colored in red or pink (red is a stronger signal).
- Bullish divergent bar is colored in blue or light blue color (blue is a stronger signal).
2. "Angulation" formation with deviation speed evaluation.
3. The level for placing a pending order (displayed as a dashed line).
Angulation is formed by divergence of two lines:
- price line that passes through the borders of bars. Lower borders of bars are used during upward motion upper borders are used during downward motion
- balance line that passes through the Alligator jaw (blue line).
Angulation is formed after forming a divergent bar outside the Alligator jaws.
Deviation speed is displayed next to the divergent bar. There is a filter in the settings on the minimum deviation speed as well as an option to select the displayed measurement unit.
You can select one of two algorithms of drawing the balance lines:
Simple - the line is drawn from the crossing bar to the point of the corresponding divergent bar (moved 8 bars ahead);
Advanced - the algorithm considers the duration of formed Angulation. When a boundary value is reached it draws the balance line so that the probability of a false angulation is minimal when the price price moves parallel.
Settings:
- Max Bars – number of bars calculated on the chart;
- Set Divergent Bar – settings for divergent bars;
- Show Divergent Bar – display divergent bars for which the Angulation hasn't been formed;
- Divergent Bar Alert – use alerts for divergent bars;
- Set Angulation – settings for Angulation;
- Angulation Aler – use alerts for Angulation;
- Comments for missed Divergent Bars – comment the reason why the Angulation to the divergent bar wasn't formed;
- Check Awesome Oscillator – check the values of the Awesome Oscillator histogram according to Bill Williams's trading strategy;
- Min duration of Angulation – minimum formation duration (possible minimum=2);
- Max duration of Angulation – maximum formation duration;
- Type of Algorithm – type of the algorithm used to draw the balance line;
- Start checking parallel motion – boundary value of formation duration, only for the Advanced algorithm (see description);
- Show Speed Differences – display deviation speed;
- Show Speed in – selection of the deviation speed unit in pips/bar or pips/h;
- Min Speed – minimum deviation speed filter;
- Font Size – font size to display deviation speed;
- Set Line Color – price and balance line color and style settings;
- Price Line Color – price line color;
- Balance Line Color – balance line color;
- Style Line – line style;
- Width Line – line width;
- Set Alligator – the Alligator indicator parameters;
- Jaw Period – jaw period;
- Jaw Shift – jaw shift;
- Teeth Period – teeth period;
- Teeth Shift – teeth shift;
- Lips Period – lips period;
- Lips Shift – lips shift;
- MA Method – method of averaging;
- Applied Price – price type;
- Set Order Level – display settings of pending order level;
- Show Order Lever – display the level for placing a pending order (the level is set without considering spread);
- Indent Level – order level offset from the divergent bar (in points);
- Buy Stop Order Level – color of "Buy Stop Order" level line;
- Sell Stop Order Level – color of "Sell Stop Order" order line;
- Style Line – line style;
- Width Line – line width.
It is recommended to use the indicator on H4 and higher timeframes.

