KT Renko Patterns MT4
- Indikatoren
- KEENBASE SOFTWARE SOLUTIONS
- Version: 2.3
- Aktualisiert: 15 Februar 2021
- Aktivierungen: 5
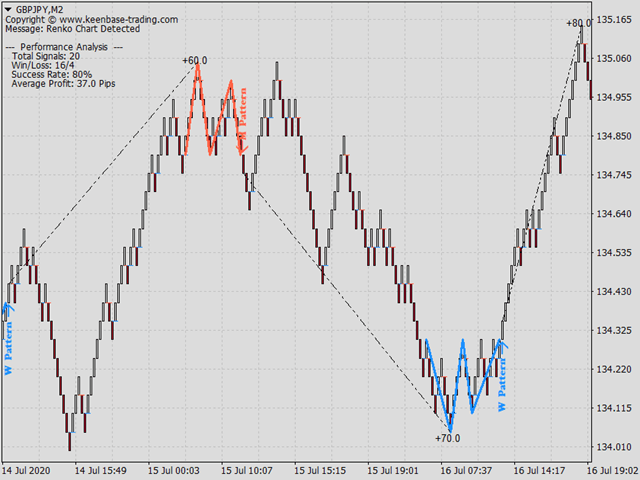
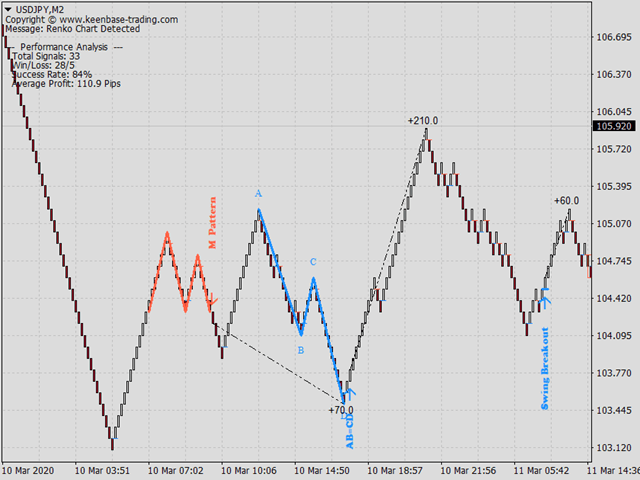
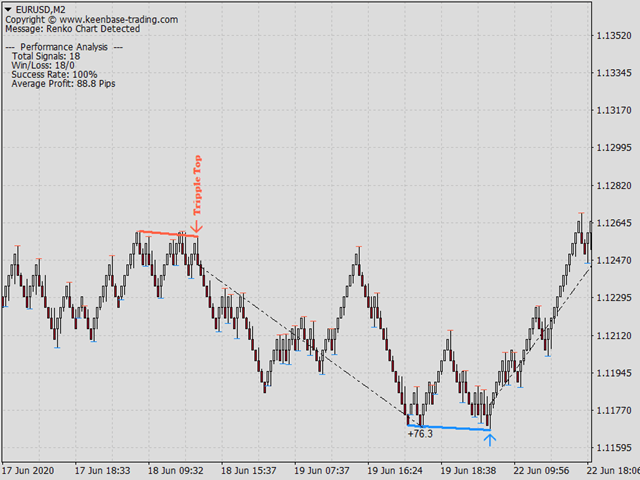
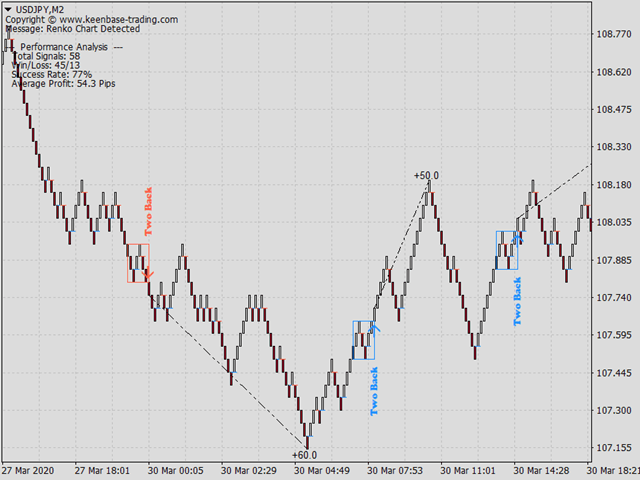
KT Renko Patterns analysiert das Renko-Diagramm Stein für Stein, um bekannte Chartmuster zu finden, die häufig von Händlern an verschiedenen Finanzmärkten verwendet werden.
Im Vergleich zu zeitbasierten Charts ist das Handeln mit Mustern auf Renko-Charts einfacher und deutlicher, da sie weniger überladen wirken.
KT Renko Patterns enthält mehrere Renko-Muster, von denen viele ausführlich im Buch "Profitable Trading with Renko Charts" von Prashant Shah erklärt werden.
Ein vollständig automatisierter Expert Advisor basierend auf dem KT Renko Patterns Indikator ist hier verfügbar - KT Renko Patterns EA.
Funktionen
- Handeln Sie mit bis zu acht klaren und eindeutigen Renko-Mustern.
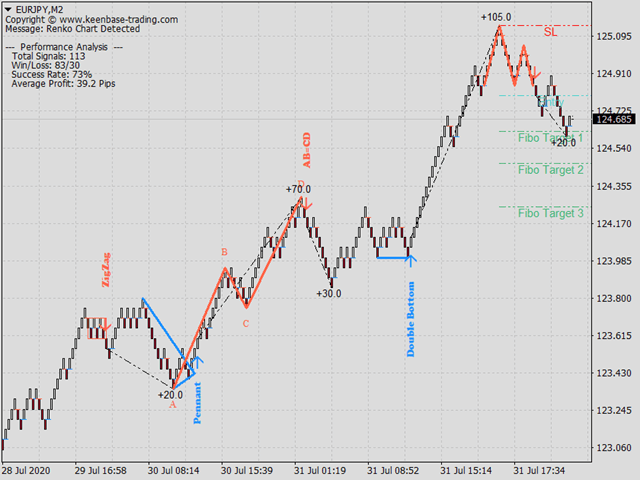
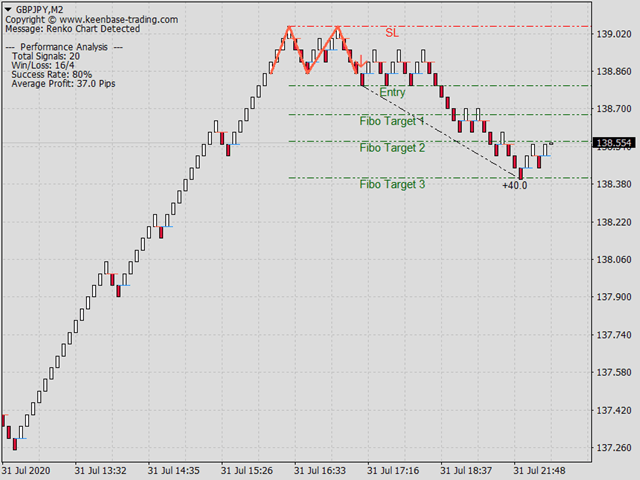
- Zur vollständigen Objektivität sind bei jedem Muster Stop-Loss- und Fibonacci-Ziele enthalten.
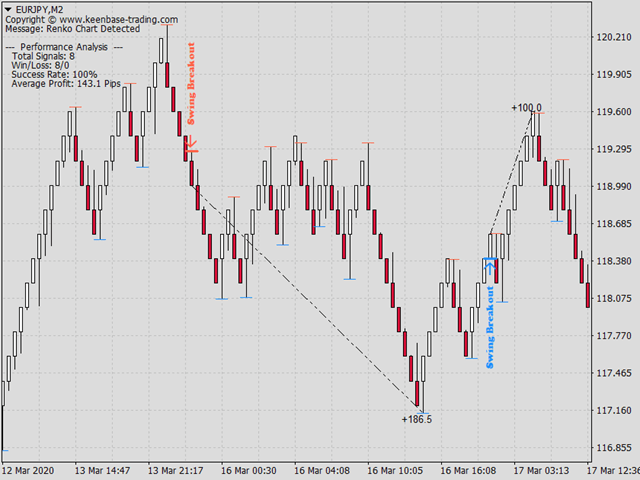
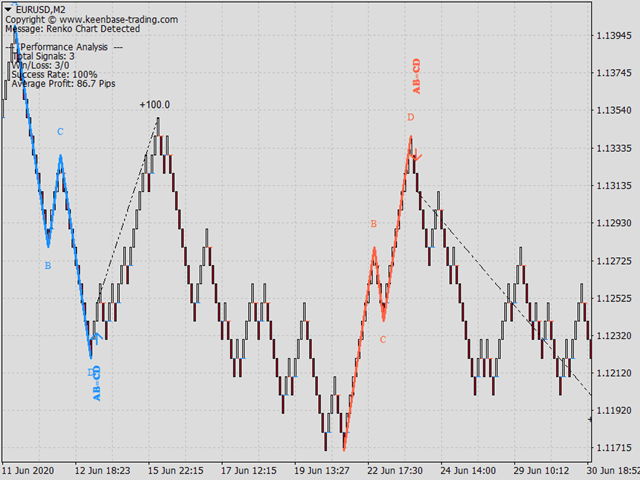
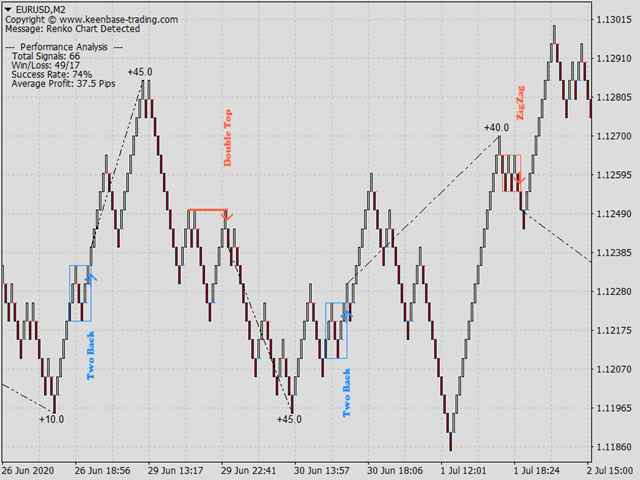
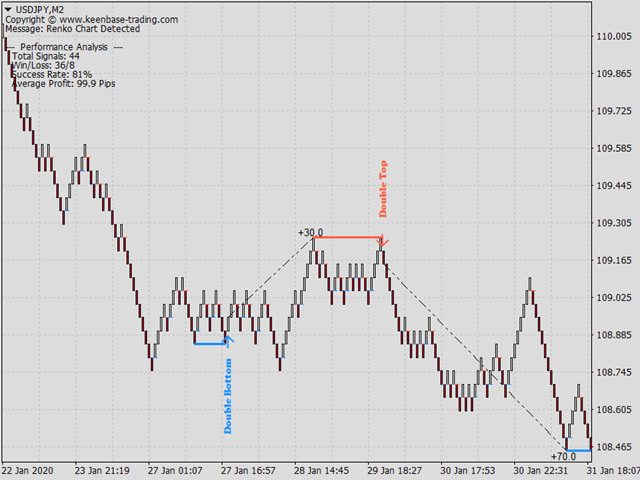
- KT Renko Patterns misst kontinuierlich die Genauigkeit jedes Musters und zeigt wichtige Statistiken im Chart an.
- Renko-Umkehrungen werden markiert und mit einem Alarm versehen, was bei plötzlichen Richtungswechseln frühzeitige Ausstiege ermöglicht.
- Erkannte Muster werden nicht neu gezeichnet oder verändert.
Enthaltene Muster
- W-M Muster
- Kraftvolle Wimpel
- AB=CD Muster
- Dreifaches Hoch/Tief
- Doppeltes Hoch/Tief
- Two Back Strike
- ZigZag Steine
- Schwungdurchbruch
Optimierung der Signalgenauigkeit
KT Renko Patterns zeigt viele Muster, aber nicht alle passen zu jedem Symbol. So optimieren Sie die Signalgenauigkeit:
- Aktivieren Sie jedes Muster (True).
- Wählen Sie ein Erfolgskriterium (wir empfehlen das zweite TP).
- Deaktivieren Sie Muster einzeln und beobachten Sie die Erfolgsrate.
- Wenn sich die Erfolgsrate verbessert, lassen Sie das Muster deaktiviert.
- Wenn sich die Erfolgsrate verschlechtert, aktivieren Sie es wieder.
- Stellen Sie den Wert für „Min. Balken zwischen Mustern“ auf 20 bis 100 ein.
Eingabeparameter
- Min. Balken zwischen Mustern: Minimale Anzahl an Balken zwischen jedem Muster zur Verbesserung der Genauigkeit.
- Umkehrmarkierung: Markiert Umkehrpunkte der Renko-Steine im Chart.
- Umkehralarme: Wenn aktiviert, erzeugt es bei jeder Umkehr ein Signal.
- Mustername anzeigen: Zeigt den Namen des Musters im Chart an.
- Leistungsanalyse: Misst die Leistung und zeigt wichtige Kennzahlen an.
- Erfolgskriterium: Kriterium zur Messung der Signalqualität.
FAQs
Q. Funktioniert das auf normalen zeitbasierten Charts?
A. KT Renko Patterns wurde speziell für Renko-Charts entwickelt. Es funktioniert zwar auch auf zeitbasierten Charts, wird aber nicht empfohlen.
Q. Kann man die Signalgenauigkeit optimieren?
A. Ja, die Anleitung dazu finden Sie oben im Text.
Q. Ich habe einen Vorschlag für ein neues Muster – könnt ihr es integrieren?
A. Bitte senden Sie uns eine Nachricht. Wenn es nützlich ist, werden wir es in einer zukünftigen Version berücksichtigen.
Q. Kann man diesen Indikator in einen EA importieren?
A. Ja, kontaktieren Sie uns bitte, um den Entwicklercode zu erhalten.


Absolutely the best Indicator for renko that I have ever used to give me a good entry position that I can trust based upon simple setups without the noise. My only regret is that I did not just buy it at at first and save $100. This is a no brainer it does all the analytical work for you. All you have to do is pull the trigger.