Moving Average Trend Scanner
- Indikatoren
- Oystein Knudsen
- Version: 2.0
- Aktualisiert: 30 Juli 2020
- Aktivierungen: 5
This is a brand new trend scanner for all of us that love to use different kinds of moving averages to define a trending market. This scanner is very useful and saves you a lot of time when you want to look for trending markets.
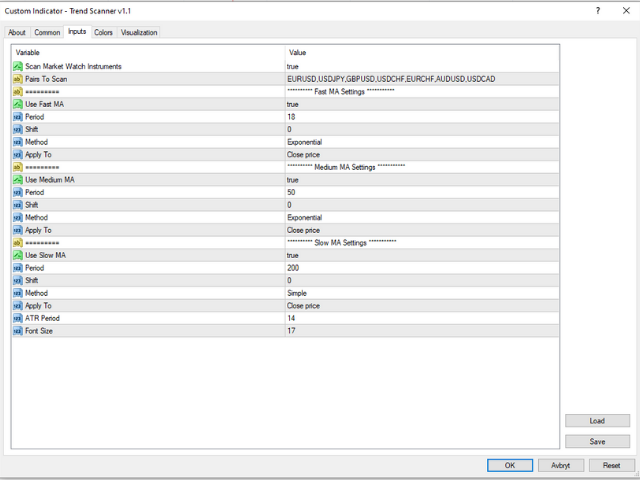
In the scanner, you can choose to either use two different moving averages or three when defining a trend. Some like to use f. ex. the 50 EMA and the 200 EMA. If 50 is below 200 they will consider it a downtrend.
Others like to use three moving averages. This can be e.g. 18 - 50 - 200. So when these moving averages are aligned a trend is confirmed.
You decide what kind of moving averages to use for your trend criteria
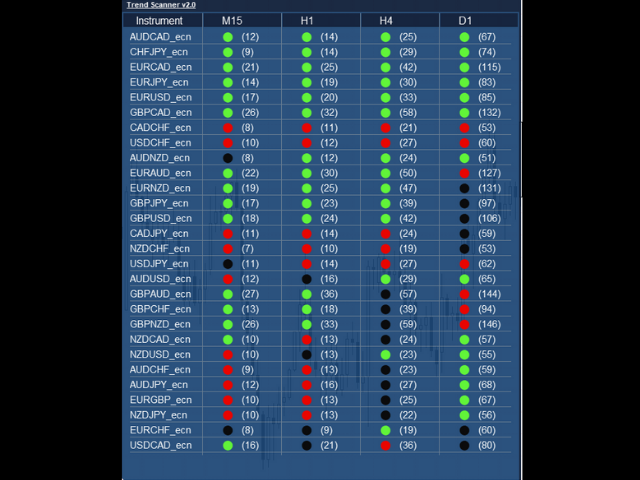
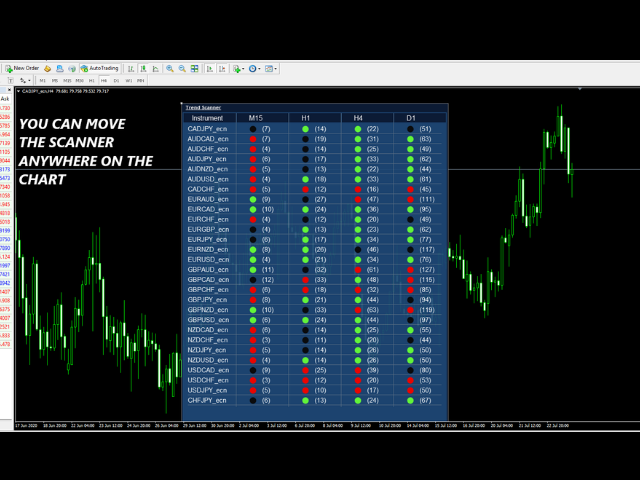
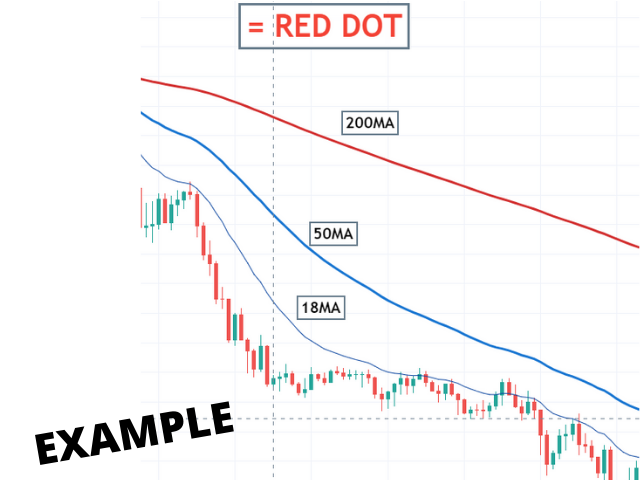
In my example showed in the pictures below I use the 18 EMA + 50 EMA + 200 EMA.
Greed dot = 18 EMA is above 50 EMA which is above 200 EMA.
Red dot = 18 EMA is below 50 EMA which is below 200 EMA
Black dot = The moving averages are not in a clear sequence, so no clear trend.
When you want to see what pairs are trending on multiple timeframes you just have to look for the same color across the panel. It cant be easier than this!
When using the indicator with default settings, make sure you only show symbols in your market watch that you are actually trading. In this way you dont overload the scanner with instruments you don^t trade.












Fantastic product, Wanted a reliable device that would reduce time and effort When initially finding potential setups And not only does it allow me to focus on these setups instantly but being ready on multiple charts before the “move” has happened. Highly recommended!