DYJ AtrTrendReversal
- Indikatoren
- Daying Cao
- Version: 3.3
- Aktualisiert: 20 September 2023
- Aktivierungen: 5
Die DYJ-Trendwende erreicht normalerweise einen hohen Wert an der Unterseite des Marktes, nachdem ein Panikverkauf zu einem starken Preisverfall geführt hat.
Niedrige Werte dieses Indikators erscheinen normalerweise an der Spitze des Haupthandels und in der langen Seitenseite der Konsolidierungsphase.
DYJ AtrTrendReversal kann nach den gleichen Prinzipien wie andere Volatilitätsindikatoren interpretiert werden.
Das Prognoseprinzip, das auf diesem Indikator basiert, kann wie folgt formuliert werden: Je höher der Indikatorwert,
Je höher die Wahrscheinlichkeit einer Trendänderung; Je niedriger der Indikatorwert ist, desto schwächer ist die Trendbewegung.
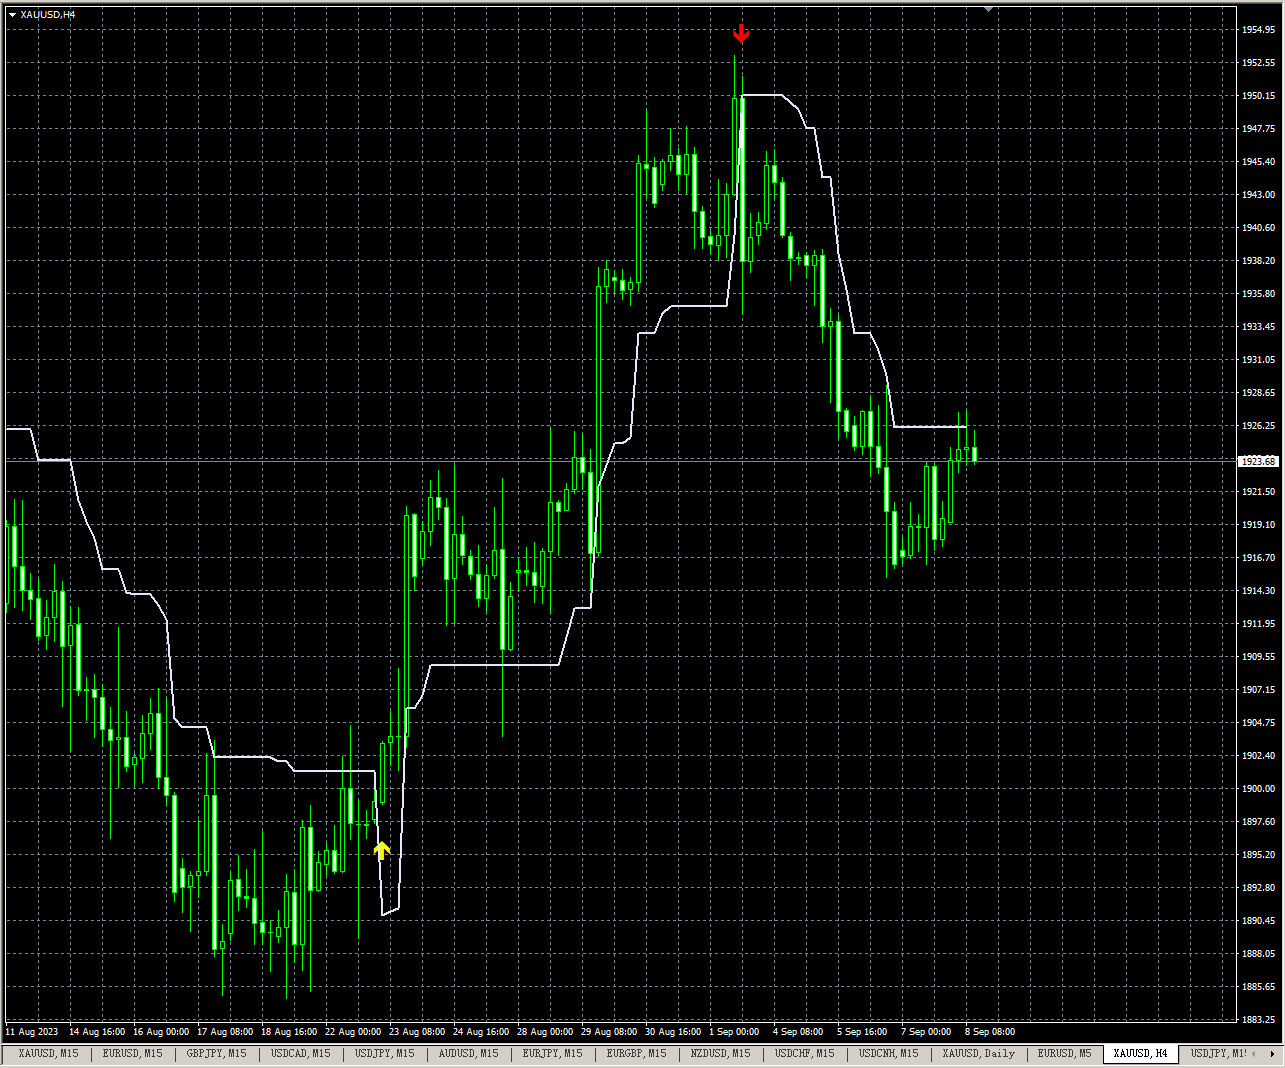
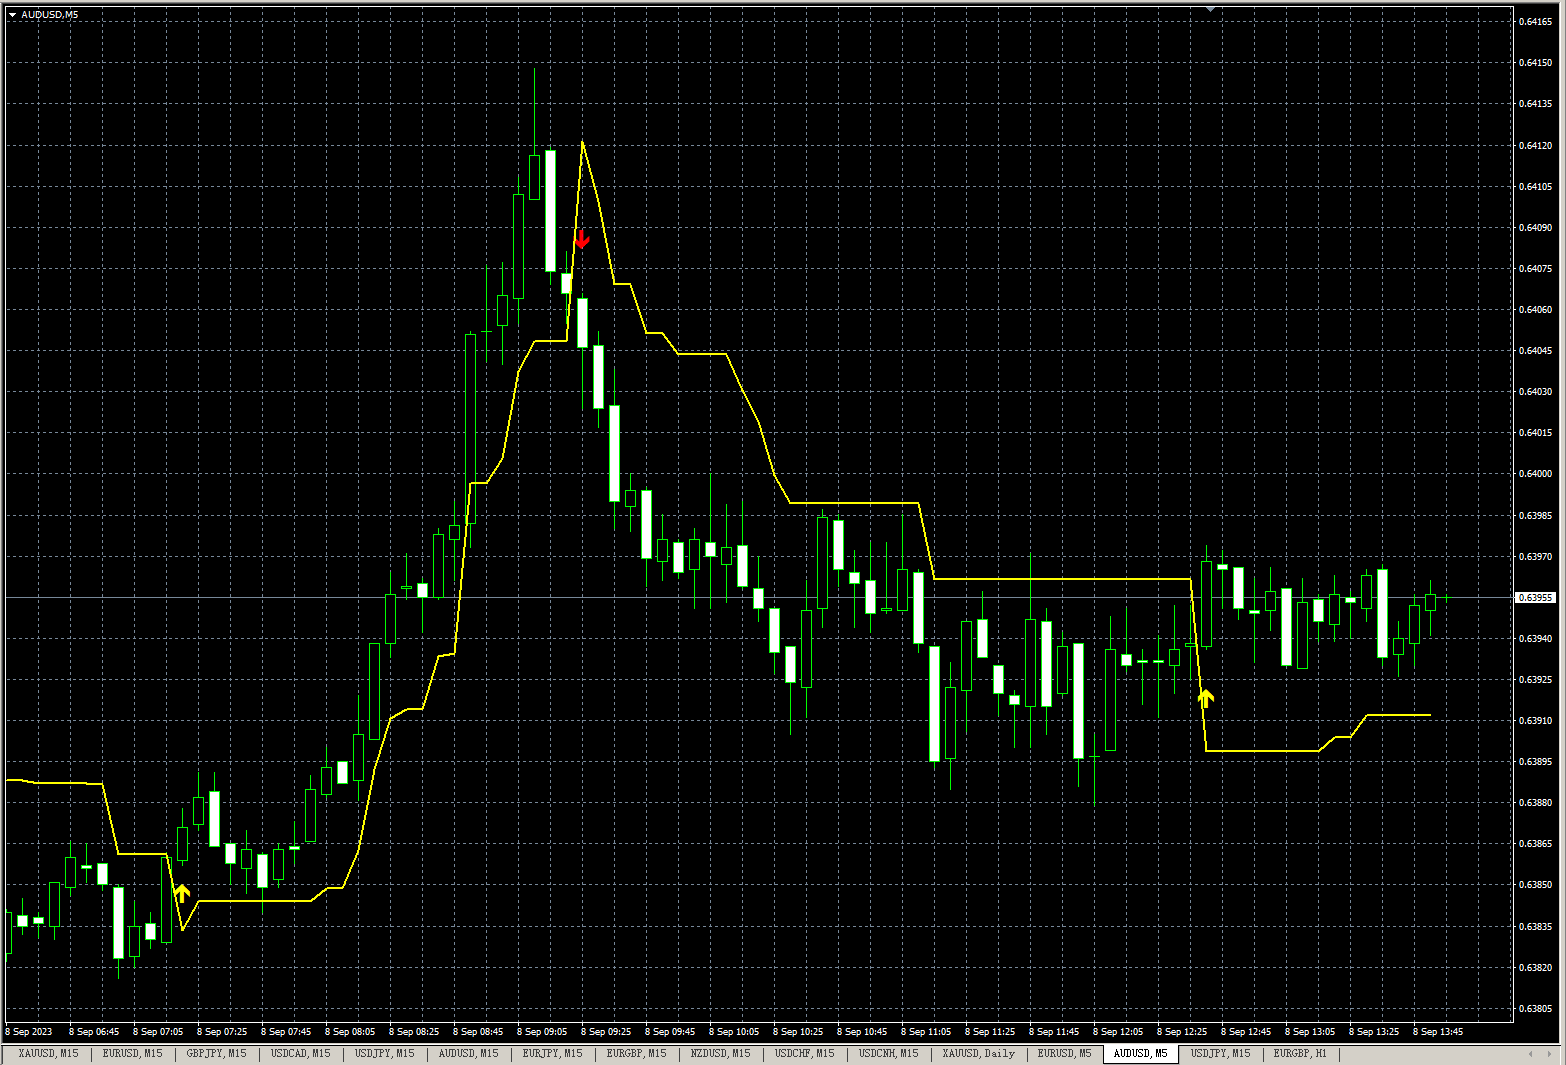
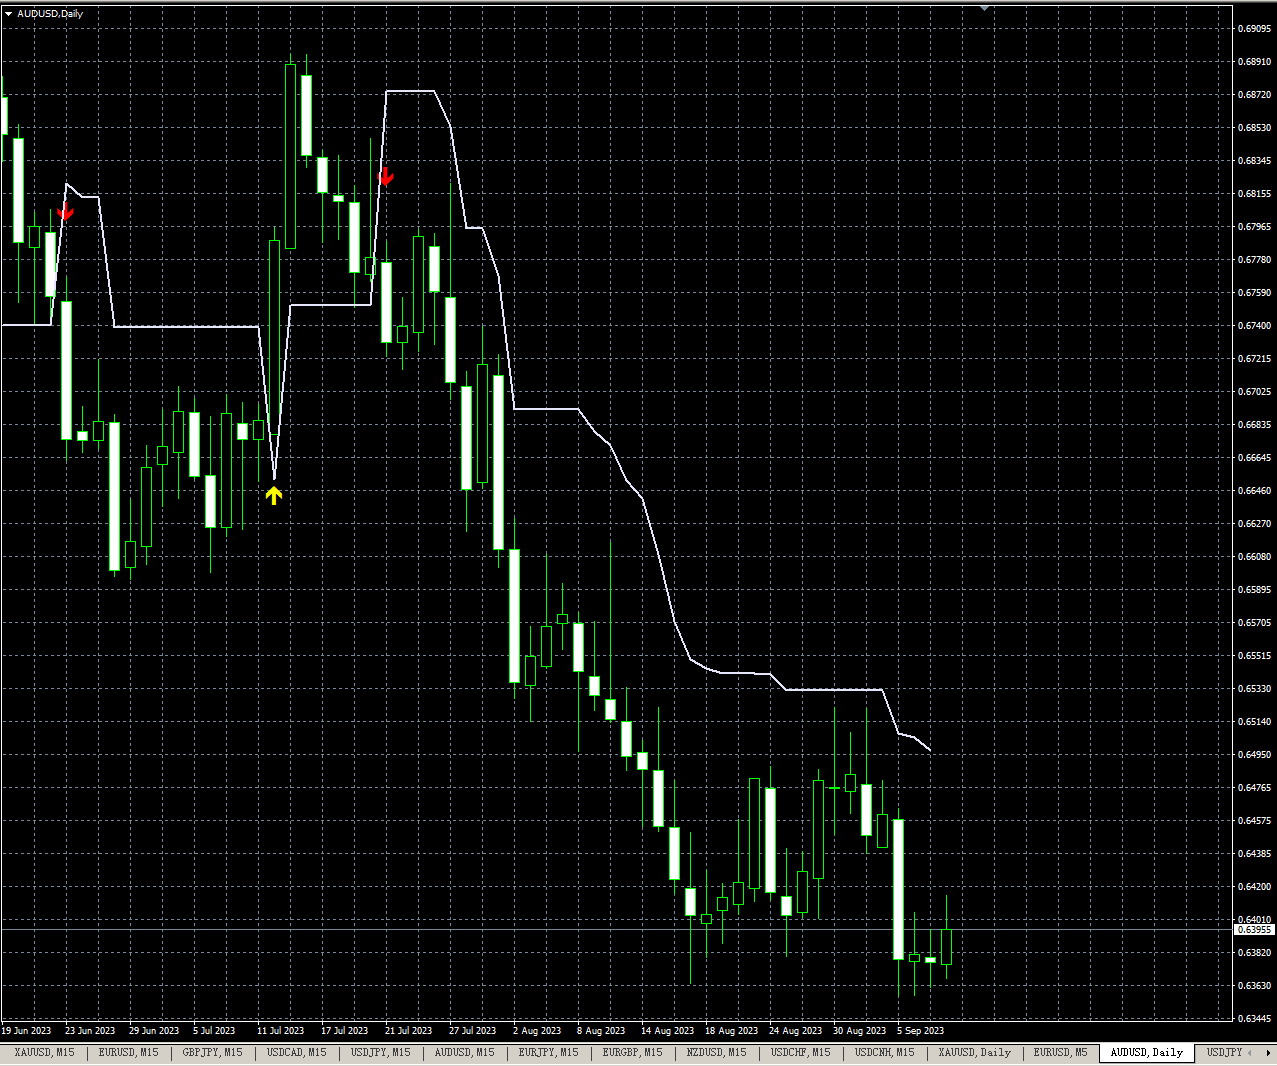
Der Indikator zeigt die ATR Trendlinie.
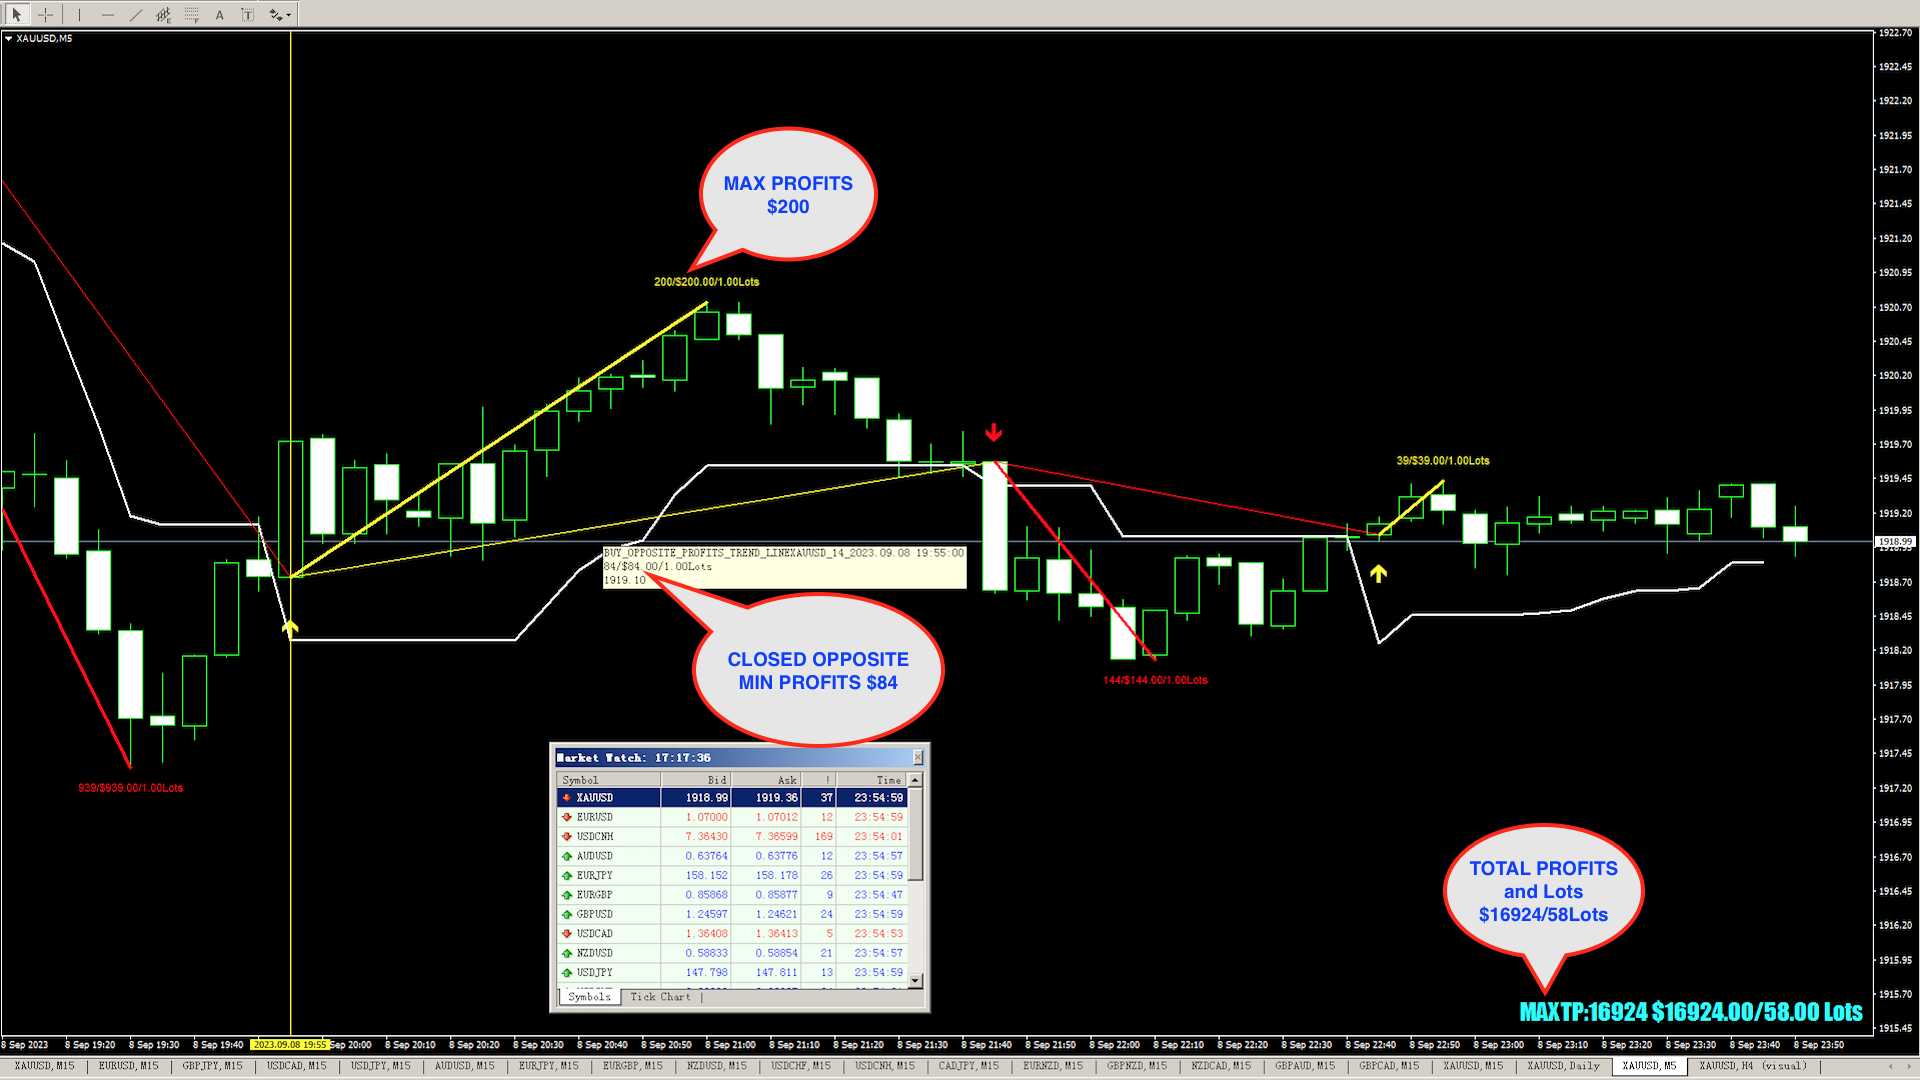
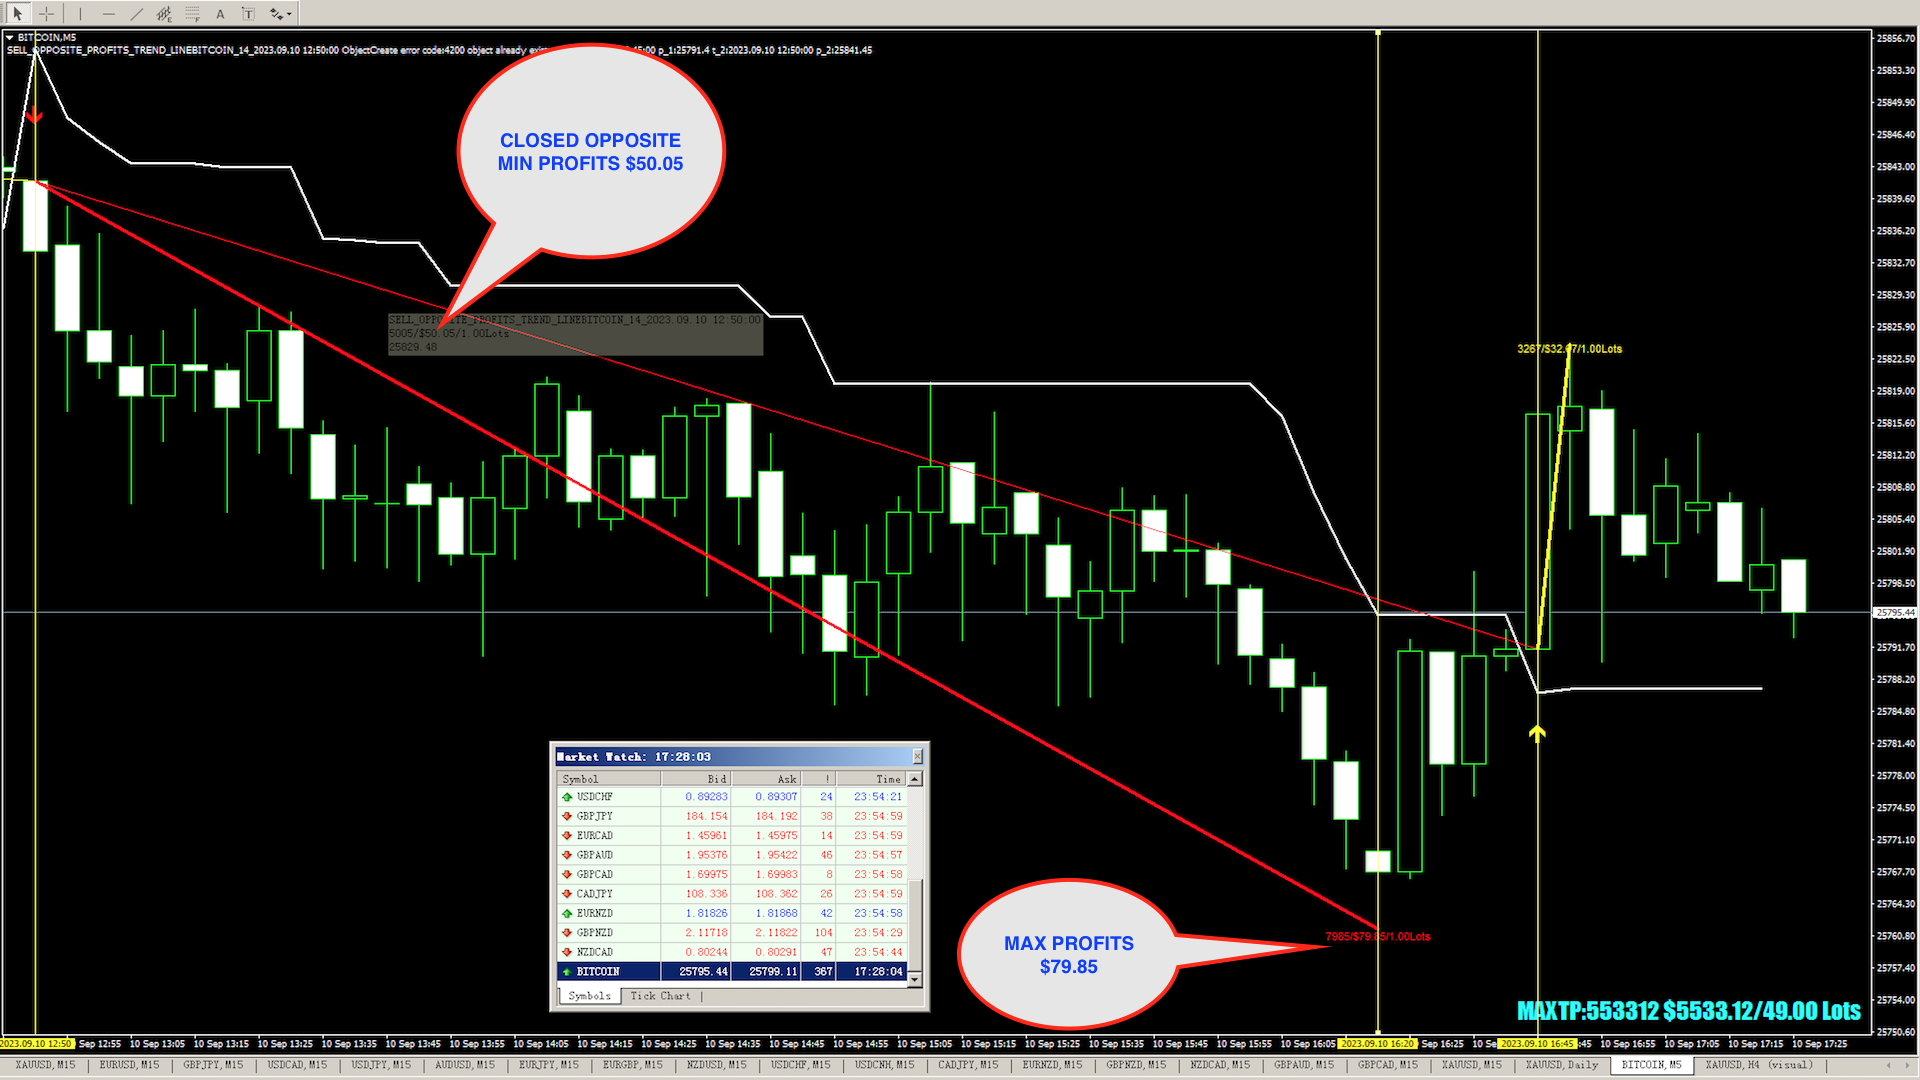
Der Indikator kann einen Pfeil auf der aktuellen Kerze anzeigen, damit Sie Ihre Position sofort öffnen können.
Zeigt die Trendlinie des maximalen Gewinns an.
Zeigt die entgegengesetzte geschlossene Trendlinie an.
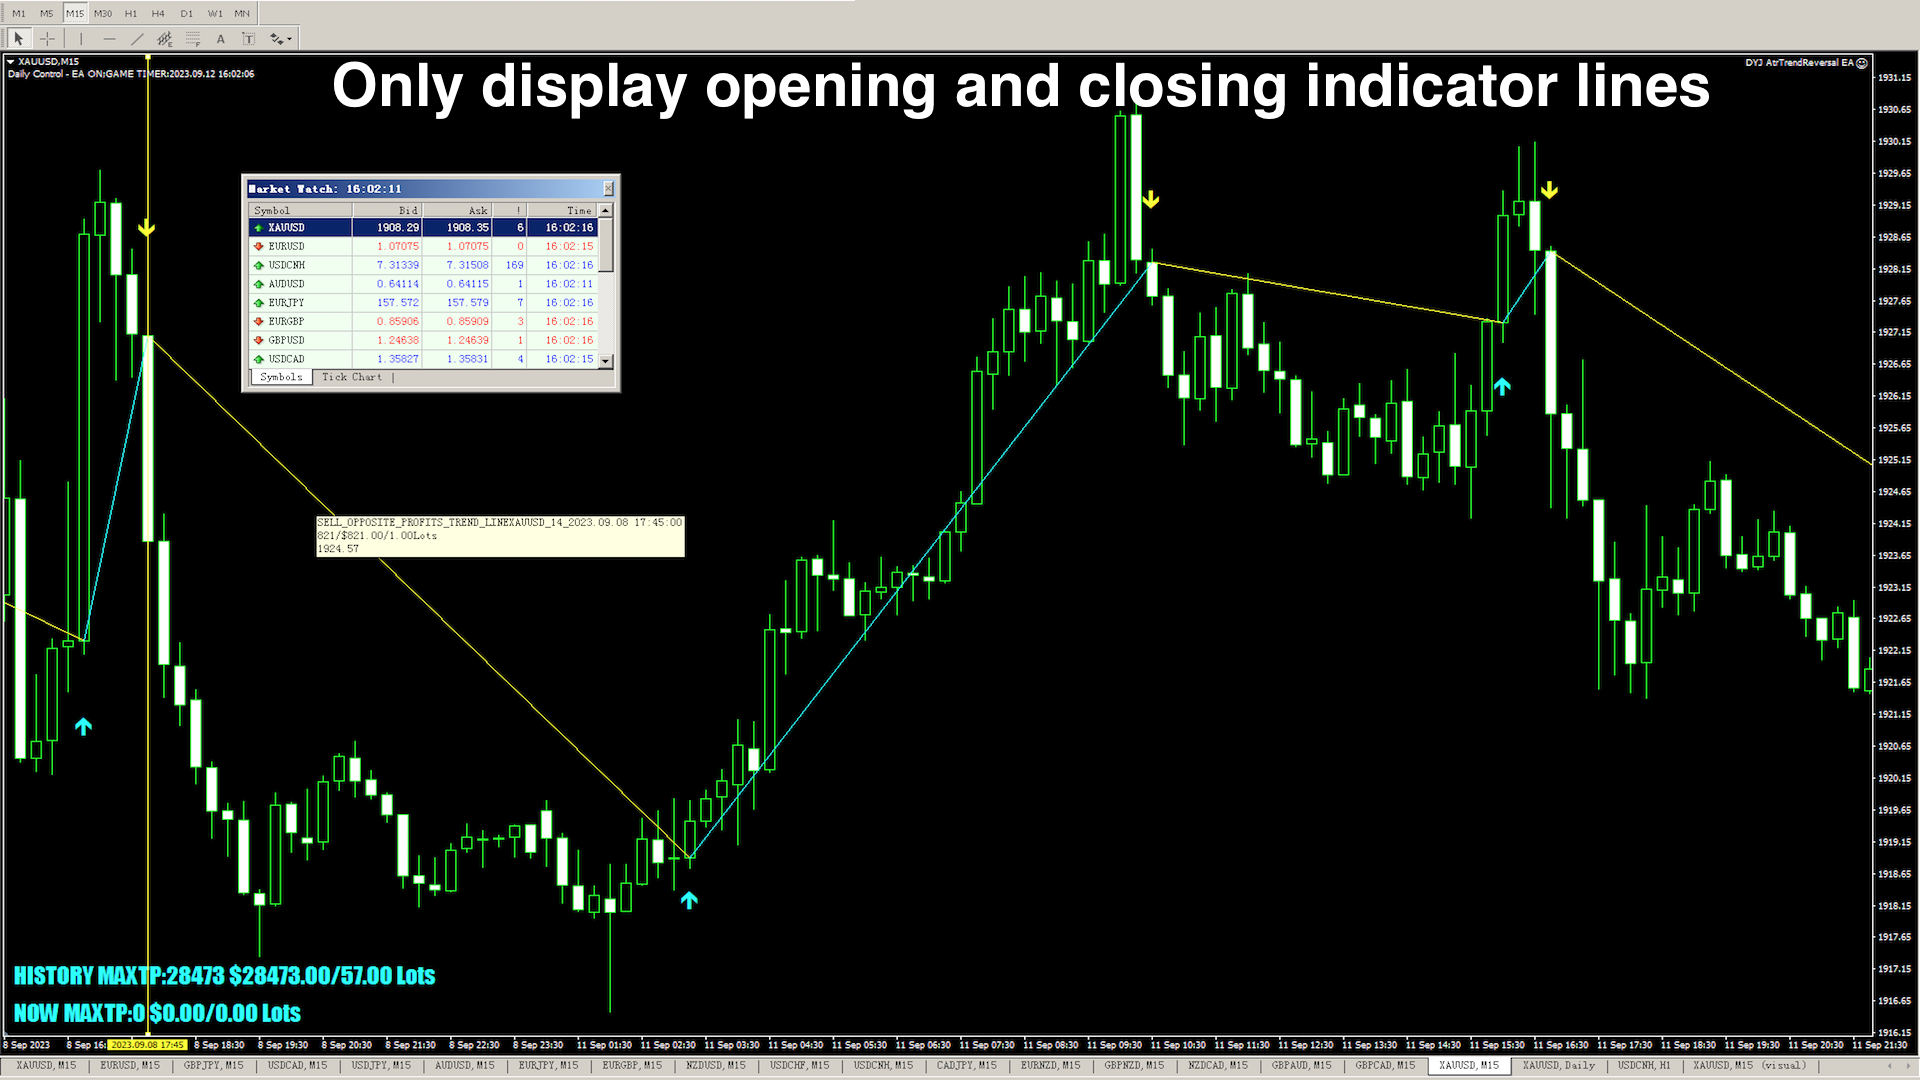
Der Indikator kann auch nur die Verbindungen zu den offenen und geschlossenen Positionen anzeigen,
Sie sehen den Eingang und den Ausgang besser.
Zeigt den Gesamtgewinn der Statistik an.
Input
- InpLossKeyValue = 2 -- Key value for Loss
- ATRPeriods = 14 -- ATR periods
- InpSimulatedVolume = 1
- InpIsUseMaxTPStatistics = true
- InpTotalProfitsLabelObjCorner = CORNER_RIGHT_LOWER;
- InpStatisticsStartDate = 0
- notifications = false -- Notifications On?
- desktop_notifications = true -- Desktop MT4 Notifications
- email_notifications = false -- Email Notifications
- push_notifications = false -- Push Mobile Notifications
- ArrowUpClr = clrLime -- Arrow Up Color
- ArrowDnClr = clrRed -- Arrow Down Color
Good indicator. Author offers great support and is open to suggestions.