Aggression On Bars
- Indikatoren
- Flavio Javier Jarabeck
- Version: 1.2
- Aktualisiert: 5 Oktober 2020
- Aktivierungen: 20
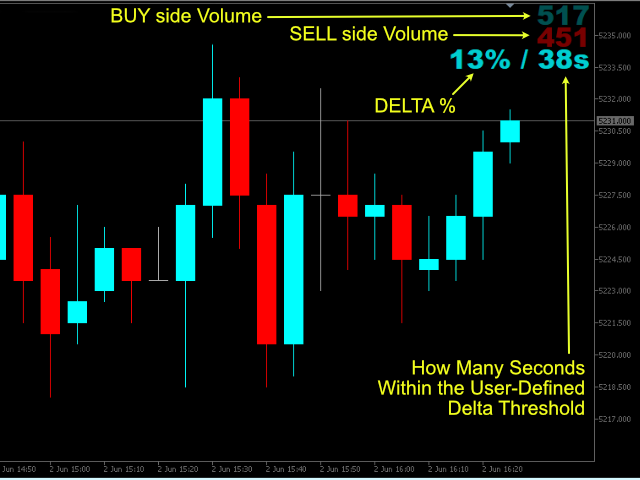
Imagine a Buy and Sell Pressure monitor on your chart that shows in REAL-TIME this data, bar by bar?
Well, imagine no more. We present you an exclusive creation of Minions Labs: Aggression On Bars indicator. On every new bar on you chart this indicator will start counting in real-time the BUY/SELL pressure and present this data statistics directly inside your chart. As soon as a new bar is created in your chart, the counter restarts. Simple and effective. Just watch the video to see it running live.
The only recommendation is that the Symbol being analyzed - and this is because of the nature of the market not the indicator itself - it should be Liquid, otherwise you will obviously be having wrong readings and whipsaws every time.
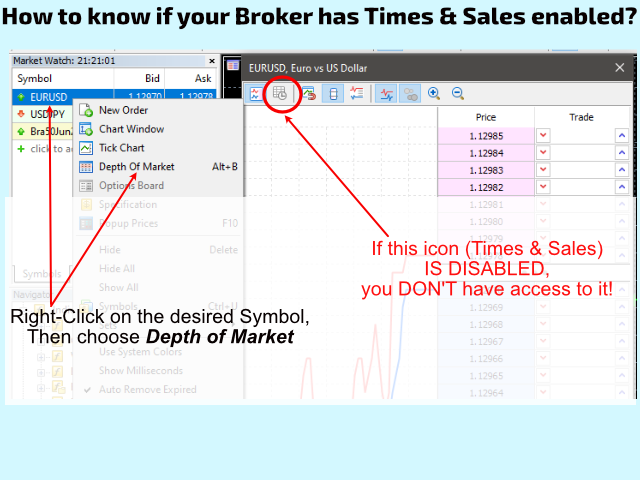
NOTE: If your Broker doesn't provide Times & Sales data this indicator WILL NOT work. Check the screenshots below to how identify if your Broker has Times & Sales (Times & Trades) enabled.
TRADING IDEAS
- Safe entering on candlestick patterns.
- Safe entering on Mean Reversions.
- Safe entering on Counter-trend trading.
- As a Confirmation Indicator
SETTINGS
- Delta percent (BUY versus SELL) to start the monitoring. The values are up to the trader according to his/her strategies, asset being traded, timeframe, time of the day, etc. There is NO right value. Threshold being hit, the timer starts counting how many seconds elapsed within the threshold chosen.
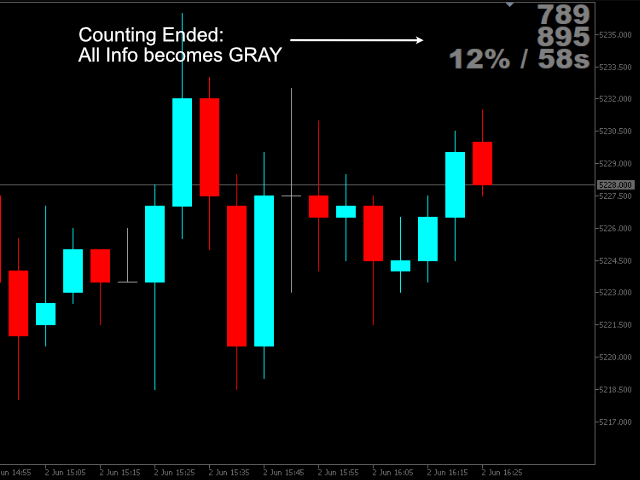
- Time elapsed to stop the monitoring (when to stop counting the BUY/SELL data).
- Do you want to force the counting stop/restart on every new Bar?
- Volume Type to use in monitoring: Real Volume or Ticks.
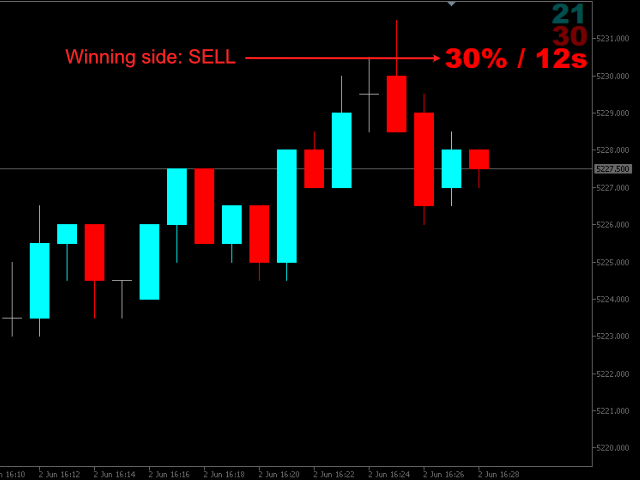
- Text Styles for the realtime monitor: Color for Buy/Sell/Idle/Winning sides.
- Labels Positioning: X/Y offsets on chart, Font type and Font size.
Not sure if this indicator is for you? No problem, just try our DEMO version FREE of charge: Aggression on Bars DEMO
* Due to the new MQL5 policy developers cannot provide DEMO versions to the general public here in this website anymore.
EA FRIENDLY
- #0 = BUY Volume data
- #1 = SELL Volume data
- #2 = Delta between BUY and SELL (in %)
- #3 = Is the Delta within the user defined threshold (1=YES / 0=NO)
- #4 = Time elapsed within the threshold (in seconds)
- #5 = Signals a BUY, when Delta reaches the threshold in buffer #3 - this buffer will contain the ASK price, otherwise, ZERO.
- #6 = Signals a SELL, when Delta reaches the threshold in buffer #3 - this buffer will contain the BID price, otherwise, ZERO.
All buffers are set with ArraySetAsSeries() as TRUE, so the "zero" elements of the buffers are the data from the current/most recent bar.





Bom indicador... Parabéns !!!