Laguerre VIX Trend Extremes MT5
- Indikatoren
- Libertas LLC
- Version: 1.6
- Aktivierungen: 20
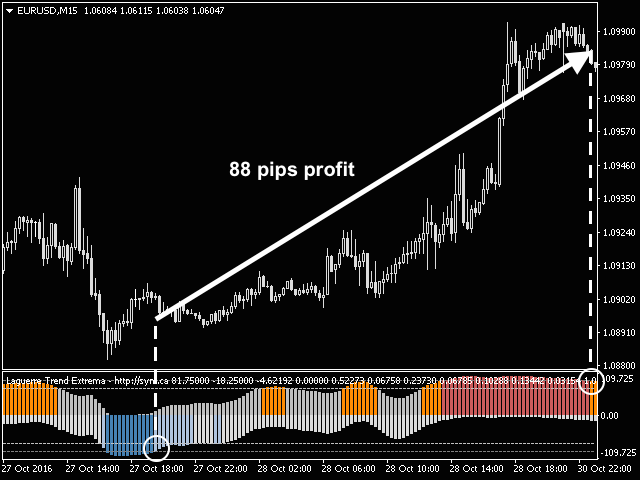
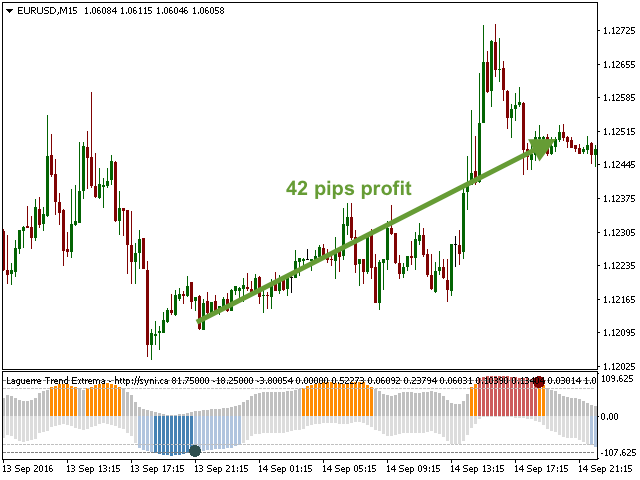
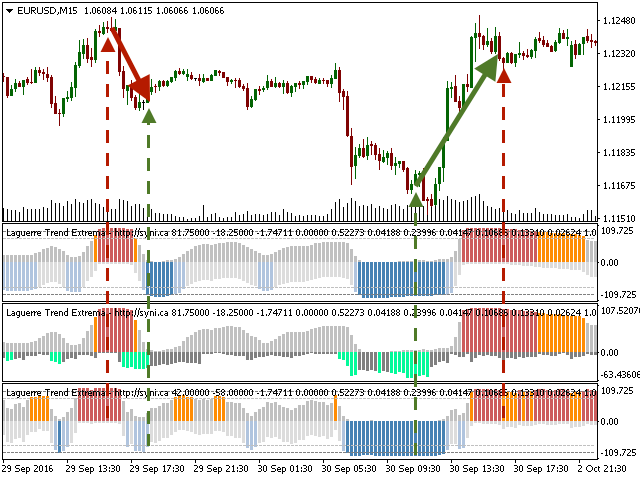
The Laguerre VIX Trend Extrema (LVTE) indicator detects market tops and bottoms. As its name suggests, LVTE is a percentage price oscillator that identifies extreme ranges in market price.
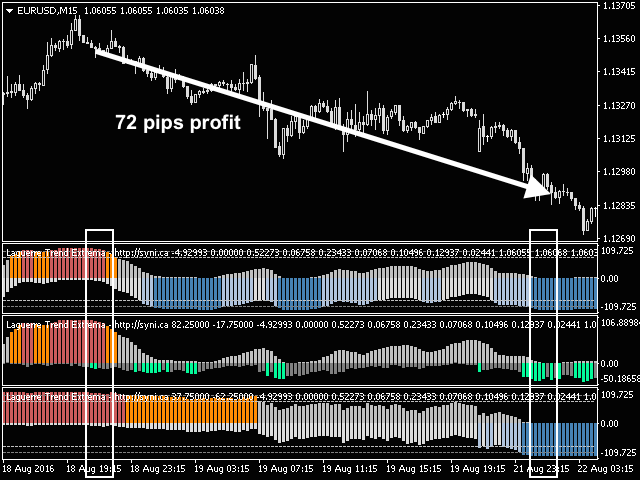
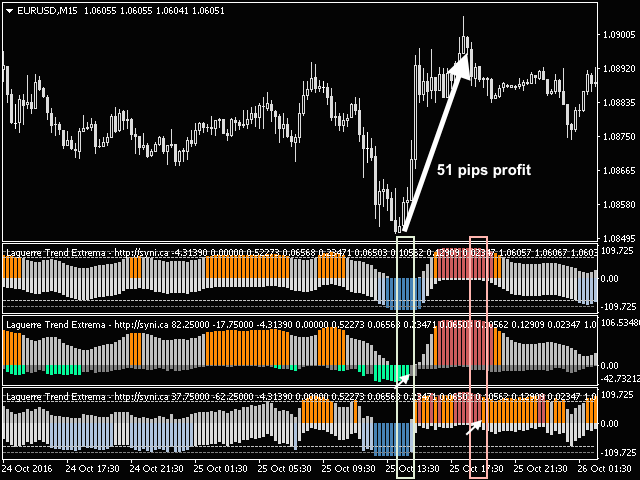
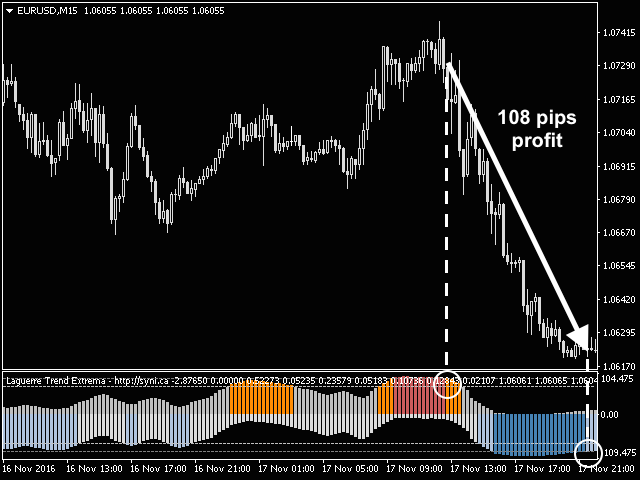
How to use: Buy when the indicator was in the lower "blue" range for more than 2 candles, and then moves up into grey. Sell when the indicator was in the upper "red" range, and then moves down into orange. Please see screenshots for examples!
To make it simple, the indicator can show this by painting "dots" where you need to enter/exit (Draw maxima offset dots = True)
As described in John F. Ehlers book "Cybernetic Analysis for Stocks and Futures," incorporating Laguerre's equation can facilitate more advanced trend detection and smoother filters, while requiring less data. Here, we use multiple variants on Laguerre's equation, for robust detection of price maxima and minima periods. We also incorporate the Modified VIX Fix (as shown here), which reflects investor sentiment for further improved detection of market bottoms.
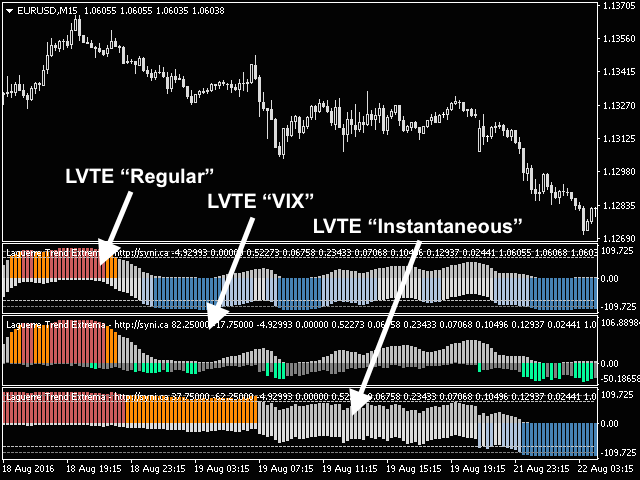
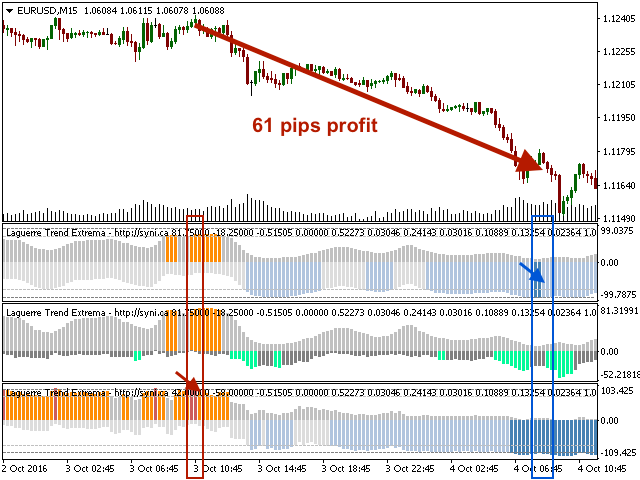
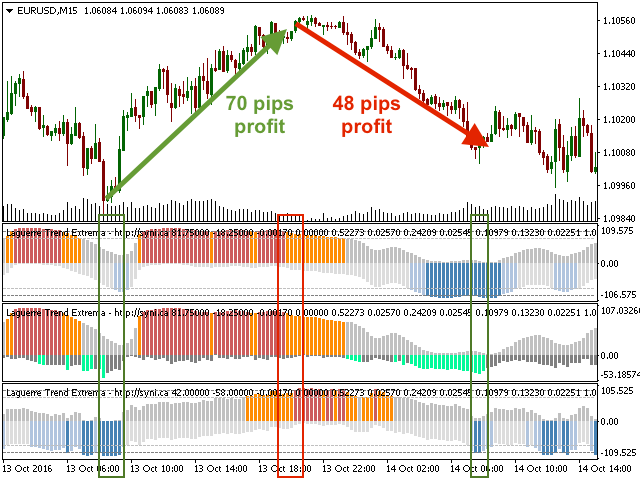
LVTE has 3 algorithm variants (Regular, VIX, Instantaneous), which can be used individually, or shown simultaneously for confirmation of a max/min. It can be plotted equally well on light and dark backgrounds. One great option is to view the 3 LVTE variants simultaneously and follow one of 2 strategies:
- Conservative approach: look for simultaneous confirming signals across 2-3 of the variants. As described in "How to use" above, confirming signal means at least 2 of the 3 variants have moved from blue into grey (buy) or red into orange (sell)
- Maximize trade opportunities and profits: look for a buy/sell signal in any of the 3 variants. e.g., buy when any of the variants shows a Buy signal, and sell when any of the variants shows a Sell signal. The same variant does not have to show both the buy and sell signal - this increases the sensitivity of the strategy.
LVTE Algorithm Variants
- Regular: Laguerre price oscillator for maxima and minima detection
- VIX: Regular LVTE for maxima detection, but modified VIX fix for minima detection
- Instantaneous: A variant on the "regular" Laguerre price oscillator to maximize forward detection using a lag-less calculation, while also minimizing false positives. However, this is at the expense of smoothing.
Alerts
Message, sound, and email alerts can be activated for each of the LVTE variants, when values begin to move back toward 0 from max or min periods. Optional circles can be drawn (turned on/off in Parameters) which correspond to alert onset.
Parameters
- LVTE calculation variant type: Regular, VIX, or Instantaneous calculation types (described in LVTE Algorithm Variants above)
- Color scheme (Default or UserDefine): Select UserDefine to customize indicator colors
- Draw maxima offset dots (true/false): If true, draws dots corresponding to enter/exit times
- Percentile threshold extreme value (Default=90.0): Defines max/min detection threshold (inverted for min)
- Percentile threshold warning value (Default=70.0): Defines warning threshold for extrema (inverted for min)
- Laguerre short calculation period (Default=0.4): Laguerre calculation coefficient
- Laguerre long calculation period (Default=0.8): Laguerre calculation coefficient
- Calculation period for maxima percentile (Default=200): # bars used for calculation
- Calculation period for minima percentile (Default=200): # bars used for calculation
- Calculation period for standard deviation: # bars used for stdev calculation for VIX threshold
- Bollinger band length: # bars used for Bollinger band calculation for VIX threshold
- Bollinger band standard deviations: deviations used for Bollinger band calculation
- Calculation period for percentile: # bars used for VIX percentile threshold
- High percentile threshold (0.85=85%): VIX bottoms percentile detection threshold
- Turn on/off all alerts: If false, prevents all alerts
- Top Extrema: alert when rebounding from upper extrema: Alerts when LVTE rebounds from upper extrema
- Bottom Extrema: alert when rebounding from lower extrema: Alerts when LVTE rebounds from lower extrema
- Turn on alerts message: If true, turns on message box alerts
- Turn on alerts sound: If true, turns on alerts sound
- Turn on alerts email: If true, turns on alerts email