• Übersicht
  • Bewertungen (2)
  • Diskussion (12)
  • Neue Funktionen

Fractal Pattern Scanner MT4

5

Introduction to Fractal Pattern Scanner

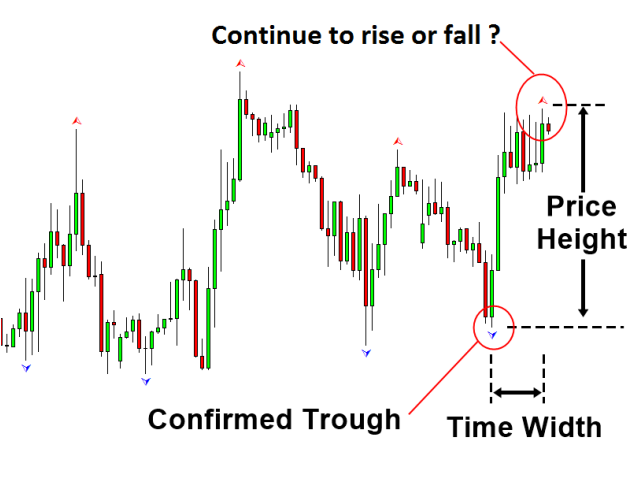
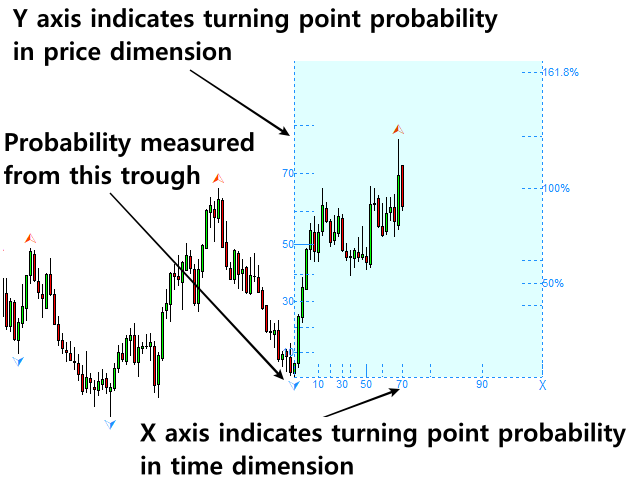
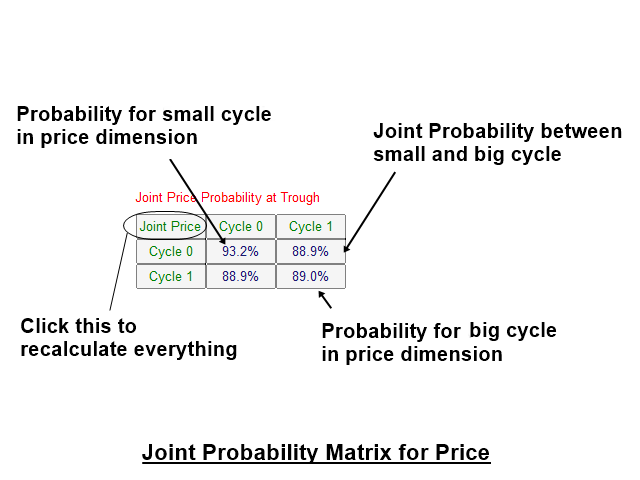
Fractal Indicator refers to the technical indicator that makes use of the fractal geometry found in the financial market. Fractal Pattern Scanner is the advanced Fractal Indicator that brings the latest trading technology after the extensive research and development work in the fractal geometry in the financial market. The most important feature in Fractal Pattern Scanner is the ability to measure the turning point probability as well as the trend probabilty. Your ability to measure the turning point probabilty and trend probabilty for each price action can boost your trading accuracy marginally.


Breakout Trading and Reversal Trading

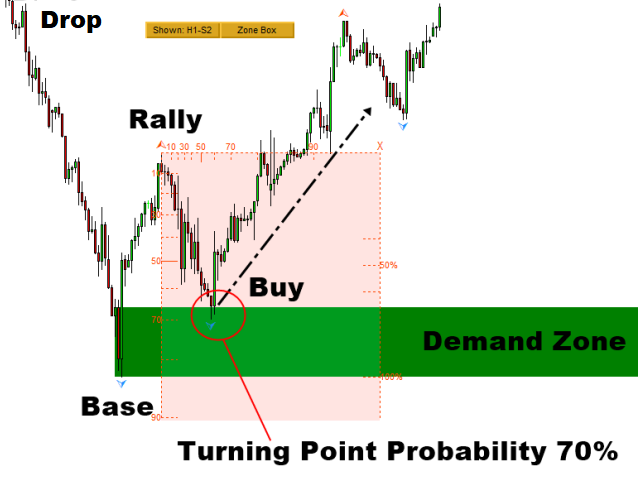
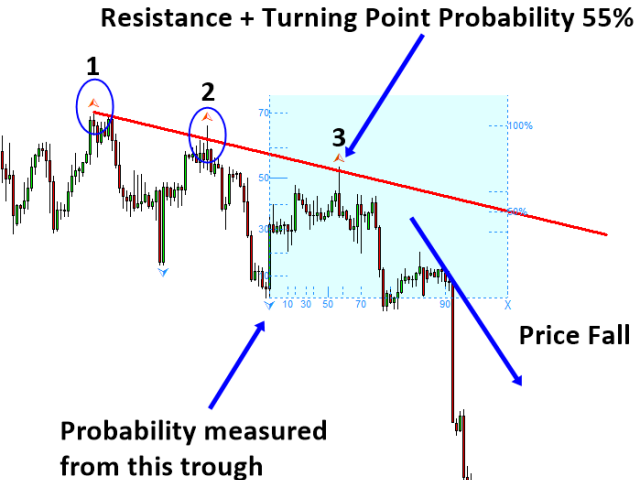
Fractal Pattern Scanner can provide both breakout and reversal trading opportunity. Firstly, you can use the Fractal Pattern Scanner as the pure probability machine to measure the turning point probability. This turning point probability quantifies the price action at every wave in your chart. While you are using the Fractal Pattern Scanner as the pure probability machine, you can access both reversal and breakout trading. You can look for the breakout trading opportunity when the turning point probability is relative low whereas you can look for reversal trading opportunity when the turning point probability is relative high. Secondly, you can ask the Fractal Pattern Scanner to detect the mother wave pattern. Mother wave pattern detection can be considered as the statistical representation of the Elliott Wave Theory. For example, Mother wave pattern detect the pattern inside pattern structure, where small patterns are jagged inside big pattern like the Elliott Wave pattern. With mother wave pattern, you can also perform both breakout and reversal trading.


Main Features

1. Provide the automatic turning point probability measurement in multiple cycles.

2. Provide breakout trading and reversal Trading with wave pattern detection. 

3. Provide the Multiple Timeframe Panel for Turning Point Probability

4. Fibonacci Probability Graph helps to detect the accurate trading opportunity with support and resistance.

5. Automated Gann's Angles (Gann's Fan), the advanced Gann Angles tuned with probability (Bonus and optional feature only).

6. Automated Andrew's Pitchfork (Bonus and optional feature only).


Trading Strategy Guide

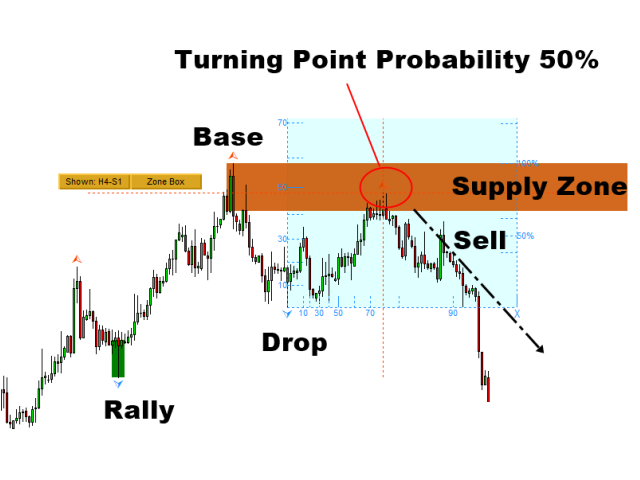
As long as you understand where to search breakout trading and reversal trading opportunity, you can combine the Fractal Pattern Scanner with any other technical analysis for reversal and breakout trading. Especially, you can use any horizontal support and resistance with the turning point probability and trend probability. Altough it is possible to use Fractal Pattern Scanner with diagonal support resistance as well as triangle pattern, rising wedge pattern and falling wedge patterns, we recommend to start with the horizontal support resistance. Simply, it is easy to start with horizontal support resistance. For example, you can use any horizontal support resistance with Fractal Pattern Scanner. 

  • horizontal support resistance
  • supply demand analysis 
  • fibonacci analysis
  • pivot point analysis 
  • round number 
  • and so on

With some hands on experience, you will soon learn how to control your success rate and to do risk management with the turning point probability. In another words, you are transforming your trading into the quantiative trading like the expert does.

Trading Strategy Guide: https://www.mql5.com/en/blogs/post/750345


Buit-in Breakout Trading System

From above trading strategy guide, we have provided the ways to improve the accuracy of the support and resistance analysis with the Fractal Pattern Scanner. However, Fractal Pattern Scanner provides its own breakout trading signal too. It does it by detecting the mother wave and child waves. Especially, we provide this signal across multiple timeframe. Hence, you need to have one Fractal Pattern Scanner for each symbol. Therefor there are multple ways to use the Fractal Pattern Scanner for your trading. 


Important Note

This is the off the shelf product. Therefore, we do not accept any modification or customization request on this product. In addition, we do not provide any code library or any support for your coding for this product.

Bewertungen 2
Vincent Paul Colombe
683
Vincent Paul Colombe 2021.12.24 11:44 
 

Awesome indicator! Really tells you the strength of the move so that you can be prepared for a reversal or a breakout. That was the bit I was missing, and now, I found my trading to have reached the next level! Use over 65% trigger for a reversal, before/after resistance/support repectively: this is a killer strategy!

swarren777
1006
swarren777 2021.09.28 20:49 
 

Fractal Scanner. Is very powerful tool. It brings a 3rd dimension. To pattern prediction. Young Ho Seo teaches that using various algorithms in conjunction increases the ability to predict global turning point. To bring together we collect alerts. In emails. To build data base for confluence idea.. The systematic process of generating ideas with automation this allows us to deploy what ever tactic.. Reversals or momentum.. I read all of his books which i reccomend. He makes it plain and clear. Fractal scanner and x3 pattern scanner. Supply demand is great frame work. Put together a correlated list of instruments.. With these tools. U will see the market talk to u.. Good luck and great trading

Empfohlene Produkte
Bei diesem Indikator handelt es sich um einen Indikator für die automatische Wellenanalyse, der sich perfekt für den praktischen Handel eignet! Fall... Hinweis:   Ich bin es nicht gewohnt, westliche Namen für die Welleneinstufung zu verwenden. Aufgrund des Einflusses der Namenskonvention von Tang Lun (Tang Zhong Shuo Zen) habe ich die Grundwelle als   Stift   und das sekundäre Wellenband als   Segment   bezeichnet Gleichzeitig hat das Segment die   Trendrichtung   benannt (diese Benennungsmet
HF SuperZig
Wong Sze Wai
5 (2)
This SuperZig indicator is special design for some trader trade with  ZigZag  and  Fibonacci . ( !!! NEW !!! +++ Support and Resistance +++ ) It will draw least two Fibonacci automatically in your chart period. Alerts when Created/Touced the Support/Resistance Box, it will send phone push/email notification to you at the same time. ZigZag + Fibo + BreakOutLine + SupportResistance = SuperZig !!! Input Parameter: " Show ZigZag " ::  Show ZigZag indicator with your own style ; " Show BreakOut
MartingaleArrow
Abdulkarim Karazon
Martingale Arrow ist ein mt4-Indikator vom Typ Pfeil, der für den Handel mit Martingale-Binäroptionen entwickelt wurde. Dieser Pfeil wird auf den offenen Balken/Intrabalken gedruckt und gibt eine Warnung aus. ANWENDUNG: Öffnen Sie den Handel, sobald der Pfeil erscheint. Wenn der Handel gewonnen hat, warten Sie auf das nächste Signal und handeln Sie mit demselben Lot. Wenn der Handel beim nächsten Signal das doppelte Los verliert und so weitermacht, bis ein Signal gewinnt, dann zurücksetzen und
PTW NON REPAINT TRADING SYSTEM + HISTOGRAM Non-Repainting ,   Non-Redrawing   and   Non-Lagging  Trading System. Does the following: - Gives Accurate Entry and Exit Points - Scalping, Day and Swing Trading  - 95% Accuracy  - Targets, where to take profits. - Shows Trends, Support and resistance levels - Works on All Brokers - Works on All Currencies, CFDs and Stocks - It does not place trades for you, it only shows you what trades to place. - It works on All Timeframes - It is for Trend or ra
It's a multi-symbol and multi-timeframe scanner for our indicator - ACB Breakout Arrows . With default settings, it scans for the buy/sell signals on 28 currency pairs and 9 time-frames concurrently .  Features It can scan 252* combinations of symbols and time-frames from a single chart. Open the signal's chart loaded with a predefined template with a single click.  Easy drag n drop anywhere on the chart. Real-time alerts with popup, sound, push-notifications and email alerts.  Input Para
TREND HARMONY MT4 –  Multi Timeframe Trend and Phase and Pullback Level Visualizer indicator for Metatrader4 The TREND HARMONY indicator automates deep trend analysis and generates visualizations for you. Take control of your trades by eliminating uncertainty! Revolutionize your trading experience with precision and insight through the TREND HARMONY Multi Timeframe Trend Indicator – your ultimate MT4 trend visualization indicator. Are you tired of missing trading opportunities or consistently e
Pyro Trend
Oleksii Ferbei
Pyro Trend is a new product that allows you to identify the current market phase (uptrend, downtrend or flat). The indicator is applicable for any data and periods. The middle of the trend wave, as well as the edges, are places of special heat and market behavior; when writing the indicator, an attempt was made to implement precisely finding the middle. Pyro Trend is a trend indicator that uses an original calculation algorithm. This indicator paints arrows in different colors depending on th
BinaryIndi
Andrey Kravchenko
This is an arrow indicator for binary options. It does not redraw, arrows do not disappear. The indicator implements an optional tester for visual monitoring of the number of signal and win rate. Does not require adjustment or fitting. Works on all pairs and gold. The signal appears at the close of a candle. Entry is made on the next bar. Optional alert. For trading with robots, there is a setting for the number of bars in history. If 0, the entire history is used. The EA operation time: 24/5 Wo
Trading Sesions MT4
William Oswaldo Mayorga Urduy
COMMERCIAL SESSIONS This indicator shows in the selected graph divided by tables each of the sessions ASIA, JAPAN, LONDON, NEW YORK: Allows you to configure: Session Color  ASIA, JAPON, LONDRES, NEW YORK Hide and show each session It works in the lowest timeframes on the market, among which H4, H1, M15, M5 and M1 are recommended. (Don't forget to check out our other indicators)
Five Candles Pattern
Miguel Antonio Rojas Martinez
The "Five Candle Pattern" indicator is a novel way to see the market, because with it we can compare and/or seek training or the pattern of the past 4 or 5 Candles, and identify them in the same graph, to view your behavior at an earlier time. The indicator creates a pattern of those 4 or 5 candles and searches backward, identifies, and marks the same formation or pattern. With that information you adjust the strategy that is operating, or create a new one, because you can compare the past devel
Scalping-Pfeile werden nicht neu gezeichnet - ein Indikator, der Preisumkehrpunkte auf dem Chart anzeigt und seine Signale nicht neu zeichnet. Außerdem sendet der Indikator Signale per E-Mail und Push an den Händler. Die Genauigkeit der Signale dieses Indikators beträgt etwa 92-94 % im M5-Zeitrahmen und mehr als 95 % im H1-Zeitrahmen. Somit ermöglicht dieser Indikator dem Händler, Trades genau zu eröffnen und weitere Preisbewegungen vorherzusagen. Kursumkehrpunkte auf dem Chart werden mit einfa
Using the Arrow Effect forex indicator algorithm, you can quickly understand what kind of trend is currently developing in the market. The Elephant indicator accompanies long trends, can be used without restrictions on instruments or timeframes. With this indicator, you can try to predict future values. But the main use of the indicator is to generate buy and sell signals. The indicator tracks the market trend, ignoring sharp market fluctuations and noises around the average price. The indicator
ABCD Harmonic Patterns
Mehmet Ozhan Hastaoglu
Thanks to this indicator, you can easily see the new ABCD harmonic patterns in the chart. If the two price action lengths are equal, the system will give you a signal when it reaches the specified level. You can set the limits as you wish. For example, You can get the signal of the price, which occurs in the Fibonaci 38.2 and 88.6 retracements, and then moves for the same length, at the level you specify. For example, it will alarm you when the price reaches 80% as a percentage. In vertic
Harmonic Trading is now much easy than ever before with Harmonic Master Scanner Pro you can now scan time frames from 5m to 1w for 17 harmonic patterns on all bares at the same time. Harmonic Master Scanner Pro works based on original MetaTrader4 Zigzag indicator and the standard harmonic patterns elements. This software send alert and email to you when a harmonic pattern is detected on any charts. If you want the scanner to draw the pattern just switch the time frame to the alert time frame. Th
Elite SR
Radek Reznicek
Elite SR - Advanced Level Indicator for automatic detection of support and resistance levels with different degree of credibility should become a part of your trading arsenal. This indicator is accessible via iCustom function and provides level values as well as their degree of credibility. Elite SR is fully adjustable and can work on any time-frame with any trading instrument! Important information For all detailed information about this indicator you can visit 747Developments website. Feat
This is a simple arrow system based on Engulfing Candlestick Pattern. It gives you alerts on your smartphone when there is an engulfing candlestick pattern happens. Which type of alerts available? 1. It paints on chart Up/Down Arrows. 2. Popup message and sound alert in trading terminal window. 3. Push notification or Alert on your Android and IOS mobile phones (requires MT4 or MT5 app installed!) *Note: Use it on higher timeframes like H4 (4 hours), D1 (1 Day) then find trade opportunities on s
This indicator accurately identifies and informs market reversals and continuation patterns by analyzing and signaling the Three White Soldiers / Three Black Crows pattern. It also offers a  "real-time backtesting"  panel in the indicator itself in a way that every change made on the indicator parameters will immediately show the user how many signals are occurred, how many take profits and stop losses were hit and, by having these informations, the Win Rate and the Profit Factor of the setup ba
Boba Binary
Anthonius Soruh
5 (1)
Result look on  https://t.me/BonosuProBinary Pair : All Forex Pairs Time Frame : M1 Expaired : 1-2 Minutes Trade Time Once Time a Day Backtester, Alert Avaliable Average Signals Generate 5 - 20 Signals All Pair A Day Broker Time Zone GMT+3 Default Setting [Example Broker GMT+3 : Alpari, FBS, XM] Support Broker : Deriv, IQOption, Alpari, Binomo, Olymtrade, Qoutex, GCoption, etc Support Auto Trading : MT2 Trading, Binary Bot, Intrade Bot, Binomo Bot, Olymptrad Bot, MX2 trading, Price Pro, etc Ind
Cota Binary
Anthonius Soruh
5 (2)
Result look on  https://t.me/BonosuProBinary Pair : All Forex Pairs Time Frame : M1 Expaired : 1-2 Minutes Trade Time Once Time a Day Backtester, Alert Avaliable Average Signals Generate 5 - 20 Signals All Pair A Day Broker Time Zone GMT+3 Default Setting [Example Broker GMT+3 : Alpari, FBS, XM] Support Broker : Deriv, IQOption, Alpari, Binomo, Olymtrade, Qoutex, GCoption, etc Support Auto Trading : MT2 Trading, Binary Bot, Intrade Bot, Binomo Bot, Olymptrad Bot, MX2 trading, Price Pro, etc Ind
Cloud Power
Andriy Sydoruk
Implementation of indication of trend movement with moments for potential stops in the Cloud Power indicator. The transition to the shadow warns of a possible reversal. The entry of the price inside the shadow speaks of a flat movement. The indicator tracks the market trend with unmatched reliability, ignoring sharp market fluctuations and noise around the average price. Simple, visual and efficient use. The indicator does not redraw and does not lag. It can be easily used as an independent
Description Complete breaker market maker Key zones indicator, It provides precise zones where could be an excellent break or reversal opportunity. KEY LINKS:   How to Install  -  Frequent Questions  -  All Products  How is this indicator useful? It will allow you to trade retracement or breakout patterns, every time they occur in a given zone. NEVER repaints. It signals clear possible money management levels as stop and take profit. You’ll be able to identify potential resistance or support lev
The indicator determines a special pattern of Joe Dinapoli. It gives very high probability buy and sell signals. Indicator does not repaint. Indicator Usage Buy Signal ''B'' Entry : Market buy order at signal bar close Stop : Low of signal bar Take Profit : First swing high Sell Signal ''S'' Entry : Market sell order at signal bar close Stop : High of signal bar Take Profit : First swing low Indicator Parameters Fast EMA : External Parameter (should be kept as default) Slow EMA: External Param
This indicator prepared by using 311,1298 days Haskaya Trend Bandse and Calculates the strand ADX.    This system can be used for 5M time frame.     This system is for Long term and profitable.    Signals are shown as arrows. as an optional,    you can set a voice alarm or email notification    You can fins our other products from link : https://www.mql5.com/en/users/drbastem/seller    Also, you can ask all your questins from email : haskayafx@gmail.com or mobile : +90 530 867 5076 or @Meh
Fibo Reversals is an indicator which has carefully been put together to attempt to indicate a time period in which an ongoing trend is most probably exhausted and a new trend (actually a reversal trend) inadvertently begins. At this, it should be okay for the manual trader to be on the look out for good trading opportunities. Input Settings Father Fibo  – This Input Determines The Highest Price For The Chosen Input Period. Son Fibo  - This Input Determines The Lowest Price For The Chosen Input
KT Candlestick Patterns Scanner is a Multi-Symbol and Multi-Timeframe scanner that fetches and shows various candlestick patterns on 28 currency pairs and 9 time-frames concurrently . The scanner finds the candlestick patterns by loading the KT Candlestick Patterns indicator as a resource in the background. Features The scanner can find the candlestick patterns on 252* combinations of symbols and time-frames from a single chart. Open the signal's chart loaded with a predefined template with
Arrows appear after Reversal-Pattern and when the confirmation-candle reaches its value, it won't disappear (no repaint). but with fix settings no additional settings necessary Entry : immediately after arrow Stop loss : a few pips above the high of the arrow - candle / below the low of the arrow - candle Take Profit : at least the next candle / move to break even after candle closed / trail the SL works on : Major Forex-pairs / M15 and higher time-frames The Value of the  confirmation-candle =>
Dieser Indikator prognostiziert Preisumkehrungen und analysiert den Aufwärts- und Abwärtsdruck auf dem Markt. Der Kaufdruck ist die Summe aller Akkumulationsbalken über eine bestimmte Anzahl von Tagen, multipliziert mit dem Volumen. Der Verkaufsdruck ist die Summe aller Verteilungen über die gleiche Anzahl von Barren, multipliziert mit dem Volumen. [ Installationsanleitung | Update-Anleitung | Fehlerbehebung | FAQ | Alle Produkte ] Das Indikatorverhältnis gibt Ihnen ein Maß für den Kaufdruck al
Real Magic Trend
Muhammed Emin Ugur
1 (1)
This   Real Magic Trend   indicator is designed for signal trading. This indicator generates trend signals. It uses many algorithms and indicators to generate this signal. It tries to generate signals from the points with the highest trend potential. This indicator is a complete trading product. This indicator does not need any additional indicators. The indicator is never repainted. The point at which the signal is given does not change.      Features and Recommendations Time Frame
Breakout FX
David Leander Tschacher
5 (1)
Breakout FX zeichnet Pfeile und gibt Alarme aus, wenn der Preis die letzten n Kerzen über- oder unterschreitet. ️ Breakout FX kann in Expert Advisors verwendet werden. ️ Breakout FX kann bereits vorhandene Trading Strategien verbessern. ️ Breakout FX arbeitet sehr schnell und repainted nicht. Inputs Breakout Range [Candles] Breakout Price Type Arrow Size Enable Alerts Enable Push Notifications Enable Emails
Retracement Feeder
Innovicient Limited
5 (1)
The Retracement Feeder checks for retracement opportunities after the first move has occurred.  Basically it scans for the second wave of trend. Works with any financial instrument,  It does not repaint/change color or cancel arrows, Easy to set and use. Works great with Renko Charts MT5 version:  https://www.mql5.com/en/market/product/71340 How it works The indicator is based on RSI and Stochastics.  The algorithm used in the Retracement Feeder allows the Stochastic and RSI to minimiz
Käufer dieses Produkts erwarben auch
Dynamic Forex28 Navigator
Bernhard Schweigert
5 (2)
Dynamic Forex28 Navigator – Das Forex-Handelstool der nächsten Generation AKTUELL 49 % RABATT. Dynamic Forex28 Navigator ist die Weiterentwicklung unserer seit langem beliebten Indikatoren und vereint die Leistung von drei in einem: Advanced Currency Strength28 Indicator (695 Bewertungen) + Advanced Currency IMPULSE mit ALERT (520 Bewertungen) + CS28 Combo Signals (Bonus) Details zum Indikator https://www.mql5.com/en/blogs/post/758844 Was bietet der Strength Indicator der nächsten Generation?
Ultimate Index Advisor ist ein fortschrittliches Tool, das entwickelt wurde, um Marktbewegungen präzise zu analysieren und Handelsmöglichkeiten dynamisch zu identifizieren. Der Indikator bietet Signale, die auf einer Kombination von Strategien basieren, die für Trends, Korrekturen und Umkehrungen optimiert sind, was ihn vielseitig für verschiedene Handelsstile macht. Mit einer intuitiven Benutzeroberfläche hebt Ultimate Index Advisor klare Ein- und Ausstiegspunkte durch sichtbare Pfeile im Cha
TPSpro RFI Levels
Roman Podpora
4.82 (22)
ANWEISUNGEN    Russland -    ENG    Die Empfehlung basiert auf dem Indikator -   TPSpro   TREND PRO -   Version MT5 Die wichtigsten Elemente in der Branche sind entweder in Zonen oder in der Fabrik enthalten, oder sie führen zu einer Lösung bei einem Kauf oder dem Verkauf eines anderen Instruments. Wenn viele Menschen ihre Rechte nicht auf dem Händlerkonto verschlüsseln, werden die Folgen nicht schnell genug sein. Ich habe es damit abgeschlossen, dass ich diese Folgen nun noch interpretieren un
Connect Indicator
Sukunthakan Ngernbamrung
Connect Indicator is a tool used for connecting indicators between the MQL market and MT4. The connected indicators are made by our group and can be used for other applications, such as sending messages to the Line application or Telegram application. If you have any questions, please don't hesitate to ask us to receive support. Function and indicator buffer Buffer one is the high price of the previous candle. Buffer two is the high price of the previous candle. Usage To connect indicators to fu
Entry Arrow Alerts: Finds market entry opportunities then notifies you via mobile or desktop alerts The key features include: Conservative mode . One entry signal per direction. Ideal for the patient trader looking to capture longer term moves. Aggressive mode . Multiple possible entry signals per direction. Ideal for the active trader looking to capture multiple moves within the same trend. Trigger Line . Price entry line helps cut down on false signals. Display Window . Allows you to instantly
Supply and Demand Dashboard PRO
Bernhard Schweigert
4.8 (20)
Derzeit 20% reduziert! Dieses Dashboard ist eine sehr leistungsfähige Software, die mit mehreren Symbolen und bis zu 9 Zeitrahmen arbeitet. Es basiert auf unserem Hauptindikator (Beste Bewertungen: Advanced Supply Demand ).   Das Dashboard gibt einen guten Überblick. Es zeigt: Gefilterte Angebots- und Nachfragewerte einschließlich der Zonenstärkebewertung, Pips-Abstände zu/und innerhalb von Zonen, Es hebt verschachtelte Zonen hervor, Es gibt 4 Arten von Alarmen für die gewählten Symbole in
TrendMaestro
Stefano Frisetti
5 (3)
note: this indicator is for METATRADER4, if you want the version for METATRADER5 this is the link:  https://www.mql5.com/it/market/product/108106 TRENDMAESTRO ver 2.4 TRENDMAESTRO recognizes a new TREND in the bud, he never makes mistakes. The certainty of identifying a new TREND is priceless. DESCRIPTION TRENDMAESTRO identifies a new TREND in the bud, this indicator examines the volatility, volumes and momentum to identify the moment in which there is an explosion of one or more of these data a
BITTE LESEN SIE DIE INFORMATIONEN UNTEN, BEVOR SIE DAS PRODUKT KAUFEN! Apollo Pips PLUS SP ist ein einzigartiges Produkt! ES IST FÜR ALLE, DIE MEINEN NEUEN „APOLLO PIPS“-INDIKATOR PLUS „SUPER PACK“-BONUS MIT ZUGRIFF AUF ALLE MEINE HANDELSINDIKATOREN ERHALTEN MÖCHTEN! Mit dem Kauf des Produkts Apollo Pips PLUS SP erwerben Sie tatsächlich eine völlig neue Version meines Apollo Pips-Indikators. Diese Version des Indikators verfügt über einen verbesserten Algorithmus und einen benutzerfreundlichen P
Currently Price 20% OFF ( for unlimited use )   BONUS  AUX VIP Club 2024 : Include  EA Airbag  and  Load Data History  to enhance the performance of this tool to its maximum potential  Click Here to Download Files   ( for users only )   Hello World! Introducing.. SMCpro VIP tool and Indicator for MetaTrader 4, designed to revolutionize your trading experience with the ICT Smart Money Concept. This system is meticulously crafted to empower traders with advanced insights and precision in
Enigmera
Ivan Stefanov
5 (3)
ENIGMERA: Der Kern des Marktes https://www.enigmera.com Einführung Dieser Indikator und dieses Handelssystem sind ein bemerkenswerter Ansatz für die Finanzmärkte. ENIGMERA nutzt die fraktalen Zyklen zur genauen Berechnung von Unterstützungs- und Widerstandsniveaus. Er zeigt die echte Akkumulationsphase an und gibt Richtung und Ziele vor.  Ein System, das funktioniert, egal ob wir uns in einem Trend oder in einer Korrektur befinden.  Wie funktioniert es? ENIGMERA besteht aus drei Linien: der
NAM Order Blocks
NAM TECH GROUP, CORP.
5 (1)
MT4-Erkennungsanzeige für Auftragsblöcke mit mehreren Zeitrahmen. Eigenschaften - Vollständig anpassbar auf dem Diagrammbedienfeld, bietet vollständige Interaktion. - Verstecken und zeigen Sie das Bedienfeld, wo immer Sie möchten. - Erkennen Sie OBs in mehreren Zeiträumen. - Wählen Sie die anzuzeigende OB-Menge aus. - Verschiedene OBs Benutzeroberfläche. - Verschiedene Filter an OBs. - OB-Näherungsalarm. - ADR High- und Low-Leitungen. - Benachrichtigungsdienst (Bildschirmwar
RelicusRoad Pro
Relicus LLC
4.64 (102)
Jetzt 147 US -Dollar (nach ein paar Aktualisierungen auf 499 US -Dollar) - Unbegrenzte Konten (PCs oder MACs) RelicusRoad Benutzerhandbuch + Schulungsvideos + Zugang zur privaten Discord-Gruppe + VIP-Status EINE NEUE ART, DEN MARKT ZU BETRACHTEN RelicusRoad ist der weltweit leistungsstärkste Handelsindikator für Forex, Futures, Kryptowährungen, Aktien und Indizes und gibt Händlern alle Informationen und Tools, die sie benötigen, um profitabel zu bleiben. Wir bieten technische Analysen un
Gold Channel is a volatility-based indicator, developed with a specific timing algorithm for the XAUUSD pair, which consists of finding possible corrections in the market. This indicator shows two outer lines, an inner line (retracement line) and an arrow sign, where the theory of the channel is to help identify overbought and oversold conditions in the market. The market price will generally fall between the boundaries of the channel. If prices touch or move outside the channel it is a tra
The Stochastic Basket Currency Strenght  brings the Stochastic indicator to a new level.  Expanding the boundaries of TimeFrames and mono-currency analysis, the SBCS take the movements of each currency that composes the cross and confront them in the whole basket of 7 crosses.  The indicator works with any combination of AUD, CAD, CHF, EUR, GBP, JPY, NZD, USD pairs and with full automation takes in account every stochastic value (main line) for the selected Time Frame.  After that, the indicator
Derzeit 20% Rabatt! Die beste Lösung für jeden Neueinsteiger oder Expert Händler! Dieses Dashboard arbeitet mit 28 Währungspaaren. Es basiert auf 2 unserer Hauptindikatoren (Advanced Currency Strength 28 und Advanced Currency Impulse). Es bietet einen hervorragenden Überblick über den gesamten Forex-Markt. Es zeigt die Werte der Advanced Currency Strength, die Veränderungsrate der Währungen und die Signale für 28 Devisenpaare in allen (9) Zeitrahmen. Stellen Sie sich vor, wie sich Ihr Hande
Wir stellen Ihnen ON Trade Waves Patterns Harmonic Elliot Wolfe vor, einen fortschrittlichen Indikator, der entwickelt wurde, um verschiedene Markt-Muster mithilfe sowohl manueller als auch automatischer Methoden zu erkennen. Hier ist, wie er funktioniert: Harmonische Muster: Dieser Indikator kann harmonische Muster erkennen, die auf Ihrem Chart erscheinen. Diese Muster sind für Trader, die die Theorie des harmonischen Handels praktizieren, wie sie in Scott Carney's Buch "Harmonic Trading vol 1
(Currently 30% OFF) Before reading the description of this indicator, I just want to introduce to you following concept Moving Average Line - Typical moving average which is based on one chart alone.  Currency Strength Line - The moving average of a certain pair in which the strength is based on 28 pairs. Can be said as the real moving average line. Moving Average indeed is one of the most popular indicator which almost every trader use. Currency Strength Meter is also a trend indicator whic
How to use Pair Trading Station Pair Trading Station is recommended for H1 time frame and you can use it for any currency pairs. To generate buy and sell signal, follow few steps below to apply Pair Trading Station to your MetaTrader terminal. When you load Pair Trading Station on your chart, Pair Trading station will assess available historical data in your MetaTrader platforms for each currency pair. On your chart, the amount of historical data available will be displayed for each currency pai
Bomb Bank Signal
Igor Pereira Calil
5 (1)
Bombenbanksignal: Ihr Vertrauensindikator in MetaTrader 4 Bomb Bank Signal ist ein leistungsstarker Indikator für MetaTrader 4, der entwickelt wurde, um die relevantesten Trends auf dem Finanzmarkt zu identifizieren. Wenn Sie nach einem Tool suchen, das Bewegungen genau vorhersieht, ist die Bomb Bank der Verbündete, den Sie brauchen. So funktioniert es: Dieser Indikator kombiniert drei unterschiedliche Methoden – Volumenanalyse, Kerzenschließungen und symmetrischer Trend –, um Kauf- und V
SR arrows liquid lines
Teresinha Moraes Correia
In the fifth update , the indicator now aims to predict the direction of the next candle, issuing a buy or sell arrow precisely when the conditions are met. Since its first version, which showed support and resistance levels on the chart, up to the current version 5, many improvements have been made. One of the key changes is the removal of visual support and resistance levels to prevent memory overload. This is no longer necessary, as arrows are now issued when the price is near or touches t
PipTick VSA MT4
Michal Jurnik
1 (2)
The   Volume Spread Analysis indicator   is based on the original Volume Spread Analysis method. It was designed for quick and easy recognition of VSA patterns. Even though this indicator looks very simple, it is the most sophisticated tool we've ever made. It is a really powerful analytical tool that generates very reliable trading signals. Because it is very user-friendly and understandable, it is suitable for every type of trader, regardless of his experience. What is VSA? VSA - Volume Spr
Volume by Price MT4
Brian Collard
4.6 (10)
The Volume by Price Indicator for MetaTrader 4 features Volume Profile and Market Profile TPO (Time Price Opportunity). Volume and TPO histogram bar and line charts. Volume Footprint charts. TPO letter and block marker collapsed and split structure charts. Static, dynamic and flexible range segmentation and compositing methods with relative and absolute visualizations. Session hours filtering and segment concatenation with Market Watch and custom user specifications. Graphical layering, positio
Dies ist eine einfache Strategie, die auf den Ebenen BREAKOUT und FIBONACCI basiert. Nach einem Ausbruch, Entweder setzt der Markt die Bewegung direkt zu den Niveaus 161, 261 und 423 fort oder es geht auf das 50 %-Niveau zurück (auch Korrektur genannt) und setzt danach höchstwahrscheinlich die Bewegung in die ursprüngliche Richtung bis zu den Niveaus 161, 261 und 423 fort. Der Schlüssel des Systems ist die Erkennung des Breakout-Balkens, der durch ein grünes (AUFWÄRTS-TREND) oder rotes
System Trend Pro
Aleksandr Makarov
5 (2)
System Trend Pro - This is the best trend trading indicator!!! Black Friday, ask for 20% discount The indicator no repaint!!!   The indicator has   MTF   mode, which adds confidence to trading on the trend (   no repaint   ). How to trade? Everything is very simple, we wait for the first signal (big arrow), then wait for the second signal (small arrow) and enter the market in the direction of the arrow. (See screens 1 and 2.) Exit on the opposite signal or take 20-30 pips, close half of it,
Prometheus Trade Engine is an indicator that combines price action, ratio based indicator with custom indicators& other lagging indicators to create this leading indicator that has a multi-timeframe approach to trading so that you are able to see what other timeframes are doing all in one chart and give you high probability trade setups to assist you to make a prediction on what is MOST likely to happen in the market going foward Chart Features 1. Reversal Zone It is the rectangular box on
POWR Rise Coming
Trade Indicators LLC
This indicator is SO SIMPLE… when the green Rise Coming arrow appears, a price drop may be on the way! Plain and easy profits! As you receive more than one 'Rise Coming' text signal in a downtrend, it means momentum is building larger for a bull run. HOW TO USE 1. When the green "Rise Coming" text appears, a price jump may be on the way! This indicator Never Repaints! To get the best setting it's a matter of tweaking the indicator until it gives you the best results. Our recommendation, and what
ECM Elite Channel is a volatility-based indicator, developed with a specific time algorithm, which consists of finding possible corrections in the market. This indicator shows two outer lines, an inner line (retracement line) and an arrow sign, where the channel theory is to help identify overbought and oversold conditions in the market. The market price will generally fall between the boundaries of the channel. If prices touch or move outside the channel, it's a trading opportunity. The
Der TRANSACTION SPEED ist der hochwertigste Indikator, der anzeigt, wo und wann sich große Aufträge auf dem Markt ansammeln und welche Vorteile dies mit sich bringt. Er erkennt Trendänderungen in einem sehr frühen Stadium. Er ist gleichzeitig ein Indikator und ein Handelssystem. Das Konzept ist einzigartig und unglaublich profitabel. Im Devisenhandel wird das Tick-Volumen irreführenderweise als Volumen bezeichnet. In Wirklichkeit handelt es sich um die Preisveränderung pro Zeiteinheit, was de
Gann Swing Structure
Kirill Borovskii
5 (1)
This indicator is based on the mathematics of the great trader W.D. Ganna. With its help, you can easily find strong levels by analyzing swings to find the optimal entry point. The indicator works on all instruments and all timeframes. The indicator is fully manual and has control buttons. All you need to do is press the NEW button, a segment will appear, which you can place on any movement, swing or even 1 candle that you want to analyze. By placing the segment, press the OK button. A grid (th
Das Handelssystem Double Trend ist ein unabhängiges Handelssystem, das aus mehreren Indikatoren besteht. Bestimmt die Richtung des allgemeinen Trends und gibt Signale in Richtung der Preisbewegung. Kann für Scalping, Intraday- oder Intraweek-Handel verwendet werden. Möglichkeiten Funktioniert mit allen Zeitrahmen und Handelsinstrumenten (Forex, Kryptowährungen, Metalle, Aktien, Indizes). Einfaches visuelles Lesen von Informationen, ohne ein Diagramm laden zu müssen Der Indikator zeichnet
Weitere Produkte dieses Autors
Elliott Wave Trend was designed for the scientific wave counting. This tool focuses to get rid of the vagueness of the classic Elliott Wave Counting using the guideline from the template and pattern approach. In doing so, firstly Elliott Wave Trend offers the template for your wave counting. Secondly, it offers Wave Structural Score to assist to identify accurate wave formation. It offers both impulse wave Structural Score and corrective wave Structure Score. Structural Score is the rating to sh
How to use Pair Trading Station Pair Trading Station is recommended for H1 time frame and you can use it for any currency pairs. To generate buy and sell signal, follow few steps below to apply Pair Trading Station to your MetaTrader terminal. When you load Pair Trading Station on your chart, Pair Trading station will assess available historical data in your MetaTrader platforms for each currency pair. On your chart, the amount of historical data available will be displayed for each currency pai
Introduction Harmonic Patterns are best used to predict potential turning point. Traditionally, Harmonic Pattern was identified manually connecting peaks and troughs points in the chart. Manual harmonic pattern detection is painfully tedious and not suitable for everyone. You are often exposed under subjective pattern identification with manual pattern detection. To avoid these limitations, Harmonic Pattern Plus was designed to automate your harmonic pattern detection process. The functionality
Introduction This indicator detects volume spread patterns for buy and sell opportunity. The patterns include demand and supply patterns. You might use each pattern for trading. However, these patterns are best used to detect the demand zone (=accumulation area) and supply zone (=distribution area). Demand pattern indicates generally potential buying opportunity. Supply pattern indicates generally potential selling opportunity. These are the underlying patterns rather than direct price action. T
Peak Trough Analysis is the great tool to detect peaks and troughs in your chart. Peak Trough Analysis tool can use three different peaks and troughs detection algorithm. The three algorithm include the orignal Fractals Indicator by Bill Williams, the Modified Fractals indicator and ZigZag indicator. You can use this peak and trough analysis tool to detect the price pattern made up from Equilibrium Fractal-Wave process. For further usage, there are good guide line on how to use this peak trough
FREE
Introduction to Support Resistance Indicator Support and Resistance are the important price levels to watch out during intraday market. These price levels are often tested before development of new trend or often stop the existing trend causing trend reversal at this point. Highly precise support and resistance are indispensable for experienced traders. Many typical trading strategies like breakout or trend reversal can be played well around these support and resistance levels. The Precision Sup
Introduction to Fractal Pattern Scanner Fractal Indicator refers to the technical indicator that makes use of the fractal geometry found in the financial market. Fractal Pattern Scanner is the advanced Fractal Indicator that brings the latest trading technology after the extensive research and development work in the fractal geometry in the financial market. The most important feature in Fractal Pattern Scanner is the ability to measure the turning point probability as well as the trend probabil
Introduction to X3 Chart Pattern Scanner X3 Cherart Pattern Scanner is the non-repainting and non-lagging indicator detecting X3 chart patterns including Harmonic pattern, Elliott Wave pattern, X3 patterns, and Japanese Candlestick patterns. Historical patterns match with signal patterns. Hence, you can readily develop the solid trading strategy in your chart. More importantly, this superb pattern scanner can detect the optimal pattern of its kind. In addition, you can switch on and off individu
How to use Pair Trading Station Pair Trading Station is recommended for H1 time frame and you can use it for any currency pairs. To generate buy and sell signal, follow few steps below to apply Pair Trading Station to your MetaTrader terminal. When you load Pair Trading Station on your chart, Pair Trading station will assess available historical data in your MetaTrader platforms for each currency pair. On your chart, the amount of historical data available will be displayed for each currency pai
Introduction This indicator detects volume spread patterns for buy and sell opportunity. The patterns include demand and supply patterns. You might use each pattern for trading. However, these patterns are best used to detect the demand zone (=accumulation area) and supply zone (=distribution area). Demand pattern indicates generally potential buying opportunity. Supply pattern indicates generally potential selling opportunity. These are the underlying patterns rather than direct price action. T
FREE
Introduction to X3 Chart Pattern Scanner X3 Cherart Pattern Scanner is the non-repainting and non-lagging indicator detecting X3 chart patterns including Harmonic pattern, Elliott Wave pattern, X3 patterns, and Japanese Candlestick patterns. Historical patterns match with signal patterns. Hence, you can readily develop the solid trading strategy in your chart. More importantly, this superb pattern scanner can detect the optimal pattern of its kind. In addition, you can switch on and off individu
Introduction Excessive Momentum Indicator is the momentum indicator to measure the excessive momentum directly from raw price series. Hence, this is an extended price action and pattern trading. Excessive Momentum Indicator was originally developed by Young Ho Seo. This indicator demonstrates the concept of Equilibrium Fractal Wave and Practical Application at the same time. Excessive Momentum detects the market anomaly. Excessive momentum will give us a lot of clue about potential reversal and
Introduction to Fractal Moving Average Fractal Moving Average indicator was designed as part of Fractal Pattern Scanner. Inside Fractal Pattern Scanner, Fractal Moving Average Indicator was implemented as multiple of chart objects. With over thousands of chart object, we find that it was not the best and efficient ways to operate the indicator. It was computationally too heavy for the indicator. Hence, we decide to implement the indicator version of Fractal Moving Average indicator to benefit ou
FREE
Introduction To Time Box Indicator Time Box Indicator is a must have indicator for any trader. It will display daily, weekly and Monthly box according to your preferences. Yet, you can extend any important price levels in your chart automatically. You can use them as the significant support and resistance levels. It is very simple but effective tool for your trading. Graphic Setting Use White Chart Line Style for Current Open price Daily Setting Update Timeframe for daily box Number of days
FREE
Introduction to Chart Pattern MT Chart Pattern MT is a chart pattern scanner to detect the triangle pattern, falling wedge pattern, rising wedge pattern, channel pattern and so on. Chart Pattern MT uses highly sophisticated chart pattern detection algorithm. However, we have designed it in the easy to use with intuitive user interface. Chart Pattern MT will show all the patterns in your chart in the most efficient format for your trading. You do not have to do tedious manual pattern detection an
Introduction This indicator detects volume spread patterns for buy and sell opportunity. The patterns include demand and supply patterns. You might use each pattern for trading. However, these patterns are best used to detect the demand zone (=accumulation area) and supply zone (=distribution area). Demand pattern indicates generally potential buying opportunity. Supply pattern indicates generally potential selling opportunity. These are the underlying patterns rather than direct price action. T
FREE
Peak Trough Analysis is the great tool to detect peaks and troughs in your chart. Peak Trough Analysis tool can use three different peaks and troughs detection algorithm. The three algorithm include the orignal Fractals Indicator by Bill Williams, the Modified Fractals indicator and ZigZag indicator. You can use this peak and trough analysis tool to detect the price pattern made up from Equilibrium Fractal-Wave process. For further usage, there are good guide line on how to use this peak trough
FREE
Auto Chart Alert MT5
Young Ho Seo
3.6 (5)
Introduction Auto Chart Alert is a convenient tool to set alert for your trading in your chart. With Auto Chart Alert, you can set the alert line in one click in your desired location in your chart. You can even set alert over the sloped lines in your chart. Auto Chart Alert is a great tool when you have to watch out importnat support and resistance levels for your trading. You can receive the sound alert, email and push notification when the price hit the alert line at you desired location. A
FREE
Ace Supply Demand Zone Indicator The concept of supply demand relies on the quantity mismatching between buying and selling volumes in the financial market. Supply and demand zone can provide the good entry and exit. A zone is easier to trade than a line. The supply demand zone can provide the detailed trading plan and the risk management. Its ability to predict market direction is high. There are two distinctive points about Ace Supply Demand Zone Indicator. Ace Supply Demand Zone indicator was
EFW Pattern Trader is a powerful pattern scanner for Forex and Stock trading. The pattern detection in EFW Pattern Trader uses the Fractal Wave Theory, which captures the endless up and down movement of the market. Therefore, EFW Pattern Trader can be considered as the robust price action indicator. Any patterns in EFW Pattern Trader can be backtested visually in your strategy tester. Visual backtesting with pattern will show you how pattern will likely behave in the live trading. Therefore, you
Introduction To Turning Point Indicator The trajectories of Financial Market movement are very much like the polynomial curvatures with the presence of random fluctuations. It is quite common to read that scientist can decompose the financial data into many different cyclic components. If or any if the financial market possess at least one cycle, then the turning point must be present for that financial market data. With this assumption, most of financial market data should possesses the multipl
Introduction to Harmonic Pattern Scenario Planner The present state of Forex market can go through many different possible price paths to reach its future destination. Future is dynamic. Therefore, planning your trade with possible future scenario is an important step for your success. To meet such a powerful concept, we introduce the Harmonic Pattern Scenario Planner, the first predictive Harmonic Pattern Tool in the world among its kind. Main Features Predicting future patterns for scenari
Introduction to Fractal Moving Average Fractal Moving Average indicator was designed as part of Fractal Pattern Scanner. Inside Fractal Pattern Scanner, Fractal Moving Average Indicator was implemented as multiple of chart objects. With over thousands of chart object, we find that it was not the best and efficient ways to operate the indicator. It was computationally too heavy for the indicator. Hence, we decide to implement the indicator version of Fractal Moving Average indicator to benefit
FREE
Mean Reversion Supply Demand Indicator Mean Reversion Supply Demand is the indicator to detect the important supply demand zone in your chart. The concept of supply demand trading relies on the quantity mismatching between buying and selling volumes in the financial market. Typically, supply demand zone serves to predict the turning point. The wave pattern, for any supply demand zone to work as an successful trade, looks like the price must touch the base zone, move away and then return to zone
Introduction To Time Box Indicator Time Box Indicator is a must have indicator for any trader. It will display daily, weekly and Monthly box according to your preferences. Yet, you can extend any important price levels in your chart automatically. You can use them as the significant support and resistance levels. It is very simple but effective tool for your trading. Graphic Setting Use White Chart Line Style for Current Open price Daily Setting Update Timeframe for daily box Number of days
FREE
Introduction to Double Harmonic Volatility Indicator Use of the Fibonacci analysis for financial trading can nearly go back to 85 years from today since the birth of Elliott Wave Theory by R. N. Elliott. Until now, traders use the Fibonacci analysis to identify the patterns in the price series. Yet, we could not find any one attempted to use Fibonacci analysis for the Volatility. Harmonic Volatility Indicator was the first technical analysis applying the Fibonacci analysis to the financial Volat
Introduction to Order Risk Management EA ORM EA is specially designed for fast and accurate market order execution to be used with our Price Action and Econometric Trading strategies listed below. ORM EA is fully automatic and ORM EA is also very easy to use. ORM EA is totally free of charge. You can also use this robust order execution feature of this ORM EA for any other your own trading strategy. Trading Strategy Guide Order Risk Management EA provides the guide for the risk management for
FREE
Introduction to GARCH Indicator GARCH is the short initial for Generalized Autoregressive Conditional Heteroskedasticity and it is the volatility prediction model commonly used in financial industry. GARCH model was first appeared in the work by Danish Economist, Tim Peter Bollerslev in 1986. The 2003 Nobel Prize winner, Robert F Engle also added much contribution for the refinement of GARCH model with Tim’s work. Our GARCH INM predictor took the original method of Nelder Mead for GARCH model bu
FREE
Auto Chart Alert MT4
Young Ho Seo
5 (2)
Introduction Auto Chart Alert is a convenient tool to set alert for your trading in your chart. With Auto Chart Alert, you can set the alert line in one click in your desired location in your chart. You can even set alert over the sloped lines in your chart. Auto Chart Alert is a great tool when you have to watch out importnat support and resistance levels for your trading. You can receive the sound alert, email and push notification when the price hit the alert line at you desired location. A
FREE
Introduction to GARCH Indicator GARCH is the short initial for Generalized Autoregressive Conditional Heteroskedasticity and it is the volatility prediction model commonly used in financial industry. GARCH model was first appeared in the work by Danish Economist, Tim Peter Bollerslev in 1986. The 2003 Nobel Prize winner, Robert F Engle also added much contribution for the refinement of GARCH model with Tim’s work. Our GARCH INM predictor took the original method of Nelder Mead for GARCH model bu
FREE
Auswahl:
Vincent Paul Colombe
683
Vincent Paul Colombe 2021.12.24 11:44 
 

Awesome indicator! Really tells you the strength of the move so that you can be prepared for a reversal or a breakout. That was the bit I was missing, and now, I found my trading to have reached the next level! Use over 65% trigger for a reversal, before/after resistance/support repectively: this is a killer strategy!

Young Ho Seo
88766
Antwort vom Entwickler Young Ho Seo 2021.12.24 11:52
You have the point exactly. Use the Risk Management together with the turning point probabilty. You will be on the right way to success. Aim to trade when the reward is more than two times greater than risk. Then you only need 50% or slightly more success rate to get profits. if you know this principle, trading is fun after. Use the turning point probabilty, to controll your success rate. There are many places I wrote the money making principle in our trading eduction books. Hope these trading education books found more Forex trader to guide in the right direction. https://algotrading-investment.com/2019/07/23/trading-education/
swarren777
1006
swarren777 2021.09.28 20:49 
 

Fractal Scanner. Is very powerful tool. It brings a 3rd dimension. To pattern prediction. Young Ho Seo teaches that using various algorithms in conjunction increases the ability to predict global turning point. To bring together we collect alerts. In emails. To build data base for confluence idea.. The systematic process of generating ideas with automation this allows us to deploy what ever tactic.. Reversals or momentum.. I read all of his books which i reccomend. He makes it plain and clear. Fractal scanner and x3 pattern scanner. Supply demand is great frame work. Put together a correlated list of instruments.. With these tools. U will see the market talk to u.. Good luck and great trading

Young Ho Seo
88766
Antwort vom Entwickler Young Ho Seo 2021.12.24 11:59
My favourite trading strategy becomes to use the turning point probability (or trend probability) togheter with supply demand analysis or other horizontal support and resistance. It is easy to trade plus I have the full control over the success rate as well as the risk management. But as I mentioned in my book, Harmonic Pattern and X3 Chart Pattern combined with supply demand analysis is pretty good too. Just let you know I not have the full description over the supply demand analysis in terms of fractal wave in my latest book: Technical Analysis in Forex and Stock Market (Supply Demand Analysis and Support Resistance)
Antwort auf eine Rezension
Version 21.8 2022.03.05
In version 21.8, we have made some minor improvement on Fractal Pattern Scanner.

Fractal Indicator refers to the technical indicator that makes use of the fractal geometry found in the financial market. Fractal Pattern Scanner is the advanced Fractal Indicator that brings the latest trading technology after the extensive research and development work in the fractal geometry in the financial market. The most important feature in Fractal Pattern Scanner is the ability to measure the turning point probability as well as the trend probabilty. Your ability to measure the turning point probabilty and trend probabilty for each price action can boost your trading accuracy marginally.
Version 21.7 2021.10.04
In Version 21.7, if mother wave pattern detection = false, then the columns related to mother wave pattern detection will be not shown in the multiple timeframe pattern detection panel.
Version 21.5 2021.10.01
In Version 21.5, you can enable or disable the specific timeframe in the turning point prediction + breakout signal panel.

Use M5 Timeframe = true or false
Use M15 Timeframe = true or false
Use M30 Timeframe = true or false
Use H1 Timeframe = true or false
Use H4 Timeframe = true or false
Use D1 Timeframe = true or false

When you set it to false, then you will not see the turning point probability + the breakout signals for the timeframe.
Version 21.2 2020.12.23
In Fractal Pattern Scanner Version 21.2, the probability information panel provide the swing size and swing age variables together. With two size and age variables, you should be able to figure it out what is going on in each timeframe, once you get used with all these probability information.
Version 21.0 2020.08.29
In version 21.0, we have made some minor improvement in our Fractal pattern scanner. For example, now when you choose the reversal pattern detection (in mother wave) for your signal, you will get Buy Breakout (R) and Sell Breakout (R) to indicate you are working on the reversal trading opportunity with the pattern.
Version 20.9 2020.08.29
In version 20.9, Fractal Pattern Scanner provides the Fibonacci Expansion with the corresponding the Price level. At the same time, we have improved the accuracy of the Fibonacci Probability Graph.
Version 20.5 2020.08.19
In version 20.5, Fractal Pattern Scanner provides up to four Fractal Cycle analysis using Fractal Decomposition Analysis. However, when you set Fractal Decomposition Dimension = 4, multiple timeframe pattern detection panel is not available because Mutltiple timeframe pattern detection panel is only available with two Fractal Cycle analysis. Enjoy this first and powerful pattern scanner built in with Fractal Decomposition Analysis.
Version 19.6 2020.08.14
In version 19.6, Fractal Pattern Scanner will display the Mother Wave Start Price and Time. Trader can use this information to gauage the breakout in the opposite direction. In addition, Trader can switch on and off the Trading Signal Panel in the indicator window by pressing D key in the keyboard. Enjoy this powerful features for your trading.
Version 19.5 2020.08.04
In version 19.5, Fractal Pattern Scanner will display "Unconfirmed Peak" and "Unconfirmed Trough" text for the latest Fractal Wave identification for the user.
Version 19.2 2020.07.13
In version 19.2, Fractal Pattern Scanner will provide the following three information for the breakout signals.

Buy or sell breakout signal + status of breakout signal if the current price crossed or not crossed the breakout price level + origin of breakout price.

Then enjoy this powerful trading system for your trading.
Version 19.1 2020.06.19
In version 19.1, Fractal Pattern Scanner provides lable for Buy Breakout and Sell Breakout. Hence, you will get the sense of direction of trading easier. All the major functionality are the same as before.
Version 19.0 2020.06.09
In the new version 19.0, the detected breakout signal (mother wave) will be described in terms of A – B = C.

Respectively, A, B and C are described as below:

A: How many bar ago the origin (peak or trough) of the breakout was detected

B: How many bar ago the current position of breakout (peak or trough) was detected

C: Distance between origin of breakout and current position of breakout ( A-B =C)

Therefore, with C, you can find out how fresh or mature the breakout signal is immediately. Smaller distance (C) means the fresh breakout to enter. Depending on the market condition, you can also enter the breakout while it is running too.
Version 18.9 2020.05.24
In version 18.9, you can use both Breakout Trading Mode and Turning Point Trading mode. In Breakout Trading Mode, Fractal Pattern Scanner detect small and young child wave with the potential breakout. In Turning Point Trading Mode, Fractal Pattern Scanner will detect the mother wave with mature probability.
Version 18.8 2020.05.23
In version 18.8, you can use both Breakout Mode and Reversal (Turning Point) trading model. In Breakout Mode, Fractal Pattern Scanner detect small and young child wave with the potential breakout.
Version 18.6 2020.05.21
In version 18.6, now you can lock Fibonacci Expansion Lines from Mother Wave detection. With the extended Fibonacci Expanstion lines, it is easier to combine them with Andrew's Pitchfork. See the provided the screenshot for that.
Version 18.2 2020.05.03
In version 18.2, now you can lock the nine Gann Angles by just one button click. This helps you to combine multiple of Gann Angles in your chart.