TSI Trend Stepper
- Indikatoren
- Joao Paulo Ferreira Fortes
- Version: 2.0
- Aktualisiert: 15 Mai 2020
- Aktivierungen: 5
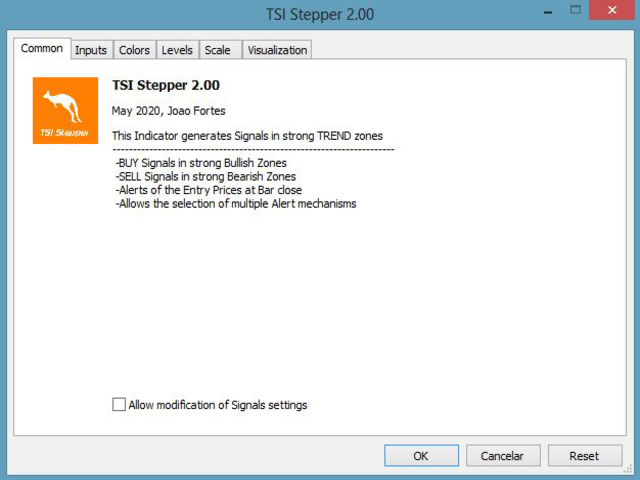
The Stepper indicator generates Signals in strong Trend zones.
Even when the Trend is set, we must filter when to ENTER or HOLD the trigger.
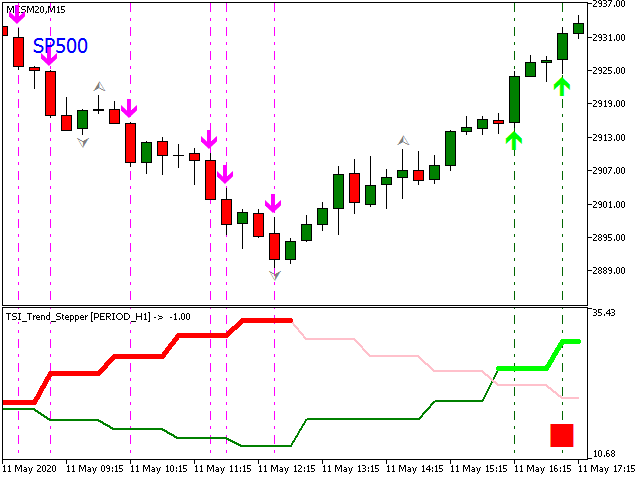
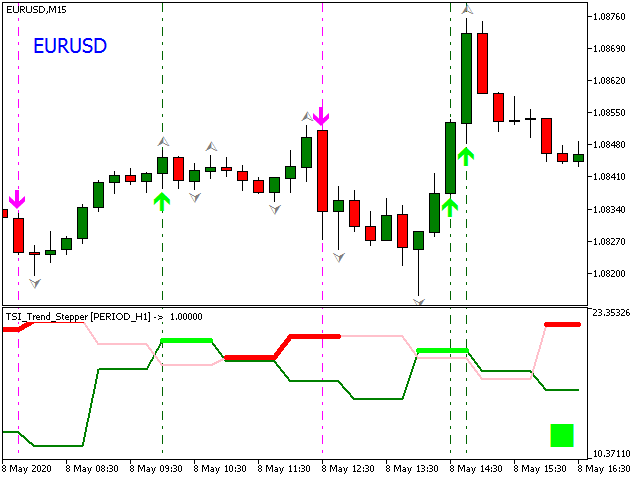
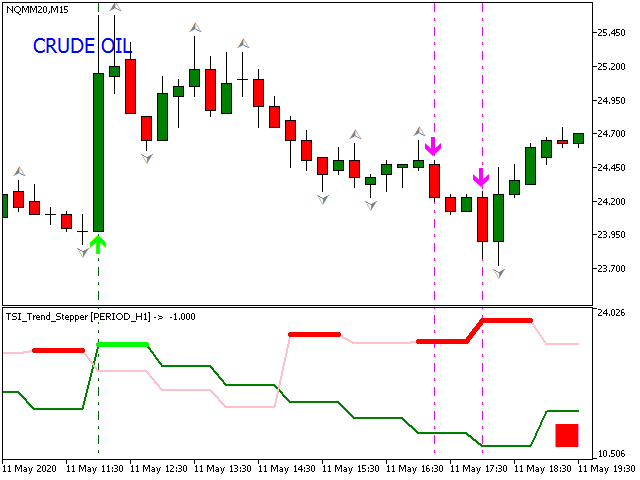
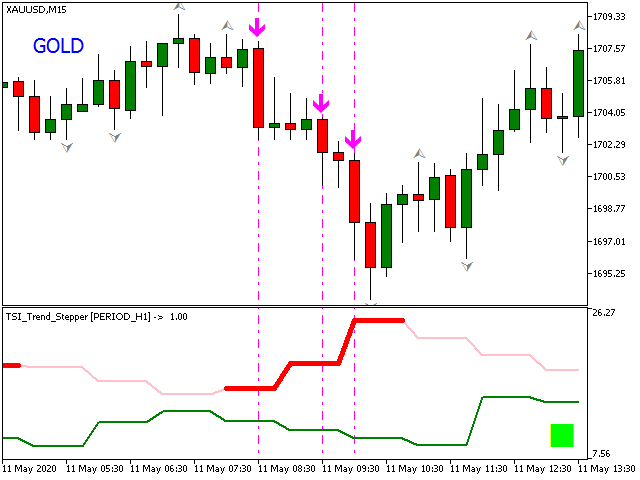
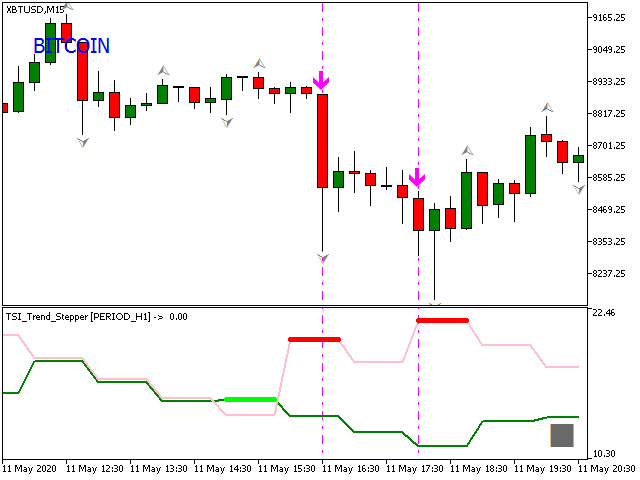
The Trend is represented by two lines: Trend UP and Trend DOWN. We are in a Bullish trend when the Trend UP (Green line) is above. And in a Bearish trend when the Trend DOWN (Pink line) is above.
When the momentum is aligned with the Trend, this indicator generates:
- BUY signals (LIME line)
- SELL signals (RED line)
The user is alerted of the scenario, at the Bar close, together with the Close price. Alerts can be delivered by Email, Alert window or printed in the Journal log.
Trend calculation is based on the price High, Low and Close of every bar.
Works on any instrument being Forex, Indices, Commodities, Stocks, Cryptos etc. (see screenshots)
Input Parameters
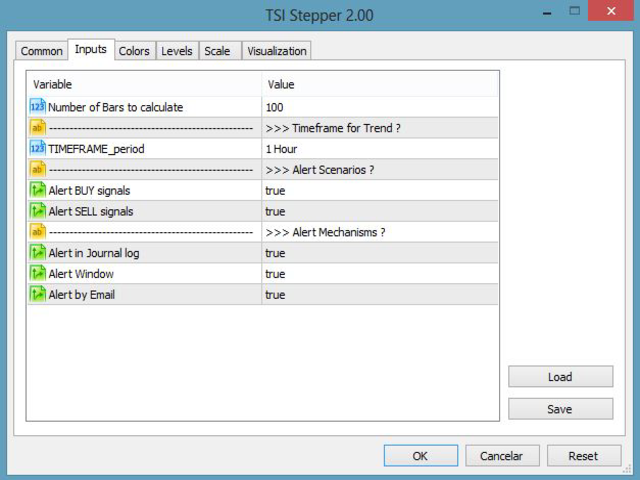
- Number of Bars to calculate: predefined value to reduce performance impact on the hardware. Adjust it accordingly to view more or less historic data.
- TIMEFRAME_period : Timeframe to determine the trend. Select a timeframe higher or equal to the current one. For example, if you trade on a M15 Chart, you can select a higher timeframe like H1.
- Alert Scenarios: select which type of signal you want to be alerted
- BUY
- SELL
- Alert Mechanisms: select how do you want to be alerted
- Journal entry
- Alert Window
- By Email
Output Buffers
- ENTRY Zone (Buffer 0)
- Value 1.0 is a BUY opportunity
- Value -1.0 is a SELL opportunity
- Value 0.0 is NEUTRAL (NO Trade Zone !!)
How to use it in your Trading (see screenshots):
Once the signal is generated, you can use several strategies to enter the Trades:
- Look for a break of Fractal high/low.
- Look for a break of a Trend lines.
- Look for a break of a Support/Resistance levels.
- Break of the previous Close price etc.
Best results are achieved when both lines are widely separated, so the Trend is clearly set. Lines wide open represent a strong momentum (a similar logic to the “Alligator” indicator).
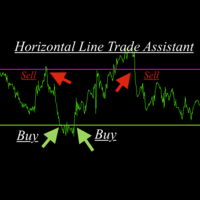
See examples of entries with multiple instruments (Screenshots with Arrows).
Note: avoid entries when both lines are too close or intertwined. These represent uncertainty in the market. It is not recommended to take trades in the NEUTRAL zone.
“The Trend is your friend, trade with it, not against it”.
