• Übersicht
  • Bewertungen (13)
  • Diskussion (1)

TRIXs

5
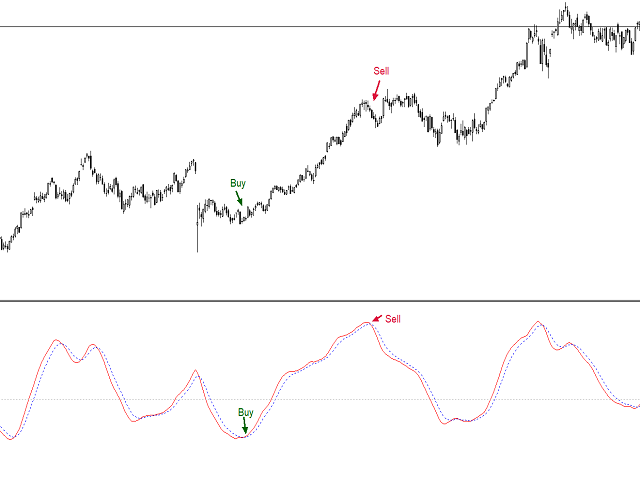
The TRIXs Indicator is the combination of the TRIX (Triple Exponential Moving Average) indicator with the addition of a SMA (Simple Moving Average) signal. It provides signs of trend continuity and the start of a new trend.

The entry and exit points of operations occur when the indicator curves cross.

It performs better when combined with other indicators.
Bewertungen 13
81115533
34
81115533 2024.03.17 22:29 
 

bom recomendo

jgomnet2022
44
jgomnet2022 2023.03.26 11:57 
 

Era o que procurava, muito assertivo. Parabéns ao criador!

MaxiGuto
37
MaxiGuto 2023.01.03 00:44 
 

Fui indicado pelo "Japa do Trade" num vídeo onde ele explica como montar a tela do Didi no MT5. Ainda sou iniciante, mas vou estudar e usar o Didi na conta Demo. Depois volto aqui para divulgar meus resultados. Obrigado

Empfohlene Produkte
This simple indicator paints with a darker color on the volume bar when the quantity traded is above the average of select number of periods of the volume itself, highlighting the moments when there was a large volume of deals above the average. It is also possible to use a configuration of four colors where the color tone shows a candle volume strength. The indicator defaults to the simple average of 20 periods, but it is possible to change to other types of averages and periods. If you like
FREE
TRIXe
PATRICK ANTONIO MORELO A.
5 (4)
The TRIXe Indicator is the combination of the TRIX indicator (Triple Exponential Moving Average) with the addition of an EMA (Exponential Moving Average) signal. It provides signs of trend continuity and the start of a new trend. The entry and exit points of operations occur when the indicator curves cross. It performs better when combined with other indicators.
FREE
Investment Castle Support and Resistance
Ahmed Alaaeldin Abdulrahman Ahmed Elherzawi
5 (5)
Investment Castle Support and Resistance Indicator has the following features: 1.  Dictates the direction of Buy or Sell trades based on Support and Resistance Levels automatically . 2.  Candles stick colors will change to Red for Sell and Blue for Buy (Default settings, user can change from the inputs). 3. This indicator is built-in the Support & Resistance based Investment Castle EA which works with Psychological Key Levels "Support & Resistance".
FREE
FT ADX Color Candles
FELIPE MISAEL MORAES KRUGER
4.86 (7)
Trades zu machen kann ziemlich anstrengend sein, wenn Sie mehrere Dinge gleichzeitig betrachten müssen. Format von Kerzen, Unterstützungen, Widerständen, Zeitplänen, Nachrichten und Indikatoren. Dieses Tool soll die Analyse des ADX-Indikators erleichtern. Es färbt die Kerzen basierend auf den Pegeln des Indikators und den DI-Linien. Der Zeitraum, die Grenze des Indikators und die Farben der Kerzen sind anpassbar. Sie können auch eine visuelle Hilfe unten rechts im Diagramm platzieren, um
FREE
TilsonT3
Jonathan Pereira
Tillson's T3 moving average was introduced to the world of technical analysis in the article ''A Better Moving Average'', published in the American magazine Technical Analysis of Stock Commodities. Developed by Tim Tillson, analysts and traders of futures markets soon became fascinated with this technique that smoothes the price series while decreasing the lag (lag) typical of trend-following systems.
FREE
Donchian Pro
Paulo Henrique Faquineli Garcia
5 (2)
The Donchian Channel Channels are among the most popular tools of technical analysis, as they visually convey to the analyst the limits within which most price movement tends to occur. Channel users know that valuable information can be obtained at any time, whether prices are in the central region of a band or close to one of the border lines. One of the best known techniques to explore these concepts is Bollinger Bands. However, John Bollinger was not the only one to research the applicatio
FREE
Strong movement levels
Nikolay Mitrofanov
5 (2)
Looks for strong price movements and draws levels upon their completion. You determine the strength of the movement yourself by specifying in the settings the number of points and the number of candles of the same color in a row in one direction. There are 2 types of building in the settings: extrenum - high / low close - close price You can also adjust the number of displayed levels and the number of candles for calculations. By default, the settings indicate 5 levels for 360 candles.
FREE
Color Trend
Bruno Goncalves Mascarenhas
Combining the best of Price Action , Directional Movement , and Divergence / Convergence analysis, the Candle Color Trend is the easy and reliable way to identify the direction of the trend. The indicator automatically paints the candles according to the premise that the upward trend is defined by prices that form a series of ascending tops and bottoms. On the other hand, the downward trend is defined by prices that form a series of descending tops and bottoms. Color Trend is certainly one
FREE
FRB Sell Agression - Indicator shows the Sell Agression Balance of the TIMEFRAMES chosen by the user through a histogram in a new window. - This indicator can only be used if the broker provides data on Volumes. Forex market brokers do not report this data. - B3 (Bovespa - Brazil) informs the data and with that it is possible to use it in Brazilian brokerages. Settings Color - Define the color that will be shown in the histogram. Use Historical Data - Defines whether the indicator will calc
FREE
Follow The Line MT5
Oliver Gideon Amofa Appiah
4.42 (31)
This indicator obeys the popular maxim that: "THE TREND IS YOUR FRIEND" It paints a GREEN line for BUY and also paints a RED line for SELL. (you can change the colors). It gives alarms and alerts of all kinds. IT DOES NOT REPAINT and can be used for all currency pairs and timeframes. Yes, as easy and simple as that. Even a newbie can use it to make great and reliable trades. NB: For best results, get my other premium indicators for more powerful and reliable signals. Get them here: https://www.m
FREE
Pivot Point Fibo RSJ ist ein Indikator, der die Unterstützungs- und Widerstandslinien des Tages mithilfe von Fibonacci-Kursen verfolgt. Dieser spektakuläre Indikator erzeugt bis zu 7 Unterstützungs- und Widerstandsebenen durch Pivot Point unter Verwendung von Fibonacci-Kursen. Es ist fantastisch, wie die Preise jedes Niveau dieser Unterstützung und dieses Widerstands respektieren, wo es möglich ist, mögliche Einstiegs- / Ausstiegspunkte einer Operation zu erkennen. Merkmale Bis zu 7 Unter
FREE
Graphic Alignment Context
Ricardo Alexandre Laurentino
The Graphic Alignment Context (GAC) Technical Indicator measures the vertical difference of the simple average price of a financial instrument in the context of three different timeframes determined by a defined number of bars or candles (periods) to determine the strength of the buy or sell trend. sale. Ascending average prices indicate Buying strength (1), Descending average prices indicate Selling strength (-1) and any scenario different from the previous two conditions indicates Neutrality
FREE
Stackable VWAP
Flavio Javier Jarabeck
3.33 (6)
Volume Weighted Average Price (VWAP) is a trading benchmark commonly used by Big Players that gives the average price a Symbol has traded throughout the day. It is based on both Volume and price. Additionally we put in this indicator the MVWAP (Moving Volume Weighted Average Price). For those who do not know the usage and the importance od this indicator I recommend a great article about this subject at Investopedia ( https://www.investopedia.com/articles/trading/11/trading-with-vwap-mvwap.asp
FREE
UPD1 X00 Levels MT5
Vitaliy Kuznetsov
5 (1)
Der Indikator zeigt   runde Level   auf dem Chart an. Sie werden auch   psychologische , Bank- oder Major Player Level genannt. Auf diesen Niveaus gibt es einen echten Kampf zwischen Bullen und Bären, die Anhäufung vieler Orders, was zu einer erhöhten Volatilität führt. Der Indikator passt sich   automatisch   an jedes Instrument und jeden Zeitrahmen an. Wenn das   Level 80   durchbrochen und dann getestet ist,   kaufen wir . Wenn   Level 20   durchbrochen und dann getestet wird,   verkaufen wi
FREE
CoioteCandlePVA
Alexandre Moraes De Souza Lima
Candle com coloração de Volume Price Analysis  (VPA) segundo as definições da Anna Coulling, é possível configurar períodos de  climax e rising, fator de extreme e fator de rising. Pode-se usar volume real ou volume de ticks. O VPA considera a variação de preço por volume do período, indicando se um movimento está recebendo ignição, está em seu climax ou se já não existe mais interesse.
FREE
Relative Volume RVOL
Alberto Gauer Borrego
4.5 (2)
Relative Volume or RVOL   is an indicator that averages the volume of X amount of days, making it easy to compare sessions volumes. The histogram only has 3 colors: Green - Above average volume Yellow - Average volume Red - Below average volume The default setting is 20 days, which corresponds more or less to a month of trading. In this version is possible to choose between tick and real volumes (if you are using a broker which offers future contracts) With the data obtaine
FREE
Expansoes M
Marcus Vinicius Da Silva Miranda
The M Extensions are variations of the Golden Ratio (Fibonacci Sequence). It is the World's first technique developed for Candle Projections. Advantages: Easy to plot. Candle anchoring; High and accurate precision as support and resistance; Excellent Risk x Return ratio; Works in any timeframe; Works in any asset / market.   The M Extensions are classified into: M0: Zero point (starting candle) RC: Initial candle control region M1: Extension region 1 M2: Extension region 2 M3: Extension r
FREE
Dynamic Theoretical Stop Histogram indicator that dynamically analyzes the theoretical Stop levels in real time. Operation : The DTS - Dynamic Theoretical Stop does a mapping of fractals in previous candles and suggests two levels of Stop: For purchase and for sale. Suggested reading : It is necessary to make the definition of Maximum Stop in points in the Trading Plan. In this way, the trader can decide the best entry point by analyzing the theoretical stop levels: Stop for sales: S
FREE
Best SAR MT5
Ashkan Hazegh Nikrou
5 (1)
Beschreibung :  Wir freuen uns, Ihnen unseren neuen kostenlosen Indikator vorzustellen, der auf einem der professionellen und beliebten Indikatoren auf dem Devisenmarkt (Parabolic SAR) basiert. Dieser Indikator ist eine neue Modifikation des ursprünglichen Parabolic SAR-Indikators. Diese Überkreuzung ist kein Signal, sondern spricht über das Potenzial für das Ende der Bewegung. Sie können mit dem Kauf bei einem neuen blauen Punkt beginnen und einen Stop-Loss ein Atr vor dem ersten blauen Punk
FREE
Waves Sizer
Flavio Javier Jarabeck
3.67 (6)
Wyckoff fans, enjoy! Ideally to be used with the Weis Waves indicator, but it can be easily used alone, the Waves Sizer puts the range (in resulting Price movement) done by the Price on its market swings. You can control how accurate or loose will be the swings. This tool is very helpful for visually know how much the Price has traveled in your Timeframe. This way you can confront this level of effort with the resulting Volume, etc... Weis Waves indicator: https://www.mql5.com/en/market/pro
FREE
Rainbow MT5
Jamal El Alama
4.33 (3)
Description : Rainbow MT5 is a technical indicator based on Moving Average with period 34 and very easy to use. When price crosses above MA and MA changes color to green, then this is a signal to buy. When price crosses below MA and MA changes color to red, then this is a signal to sell. The Expert advisor ( Rainbow EA MT5 ) based on Rainbow MT5 indicator is now available here . MT4 version is available here .
FREE
Italo Levels Indicator MT5
Italo Santana Gomes
5 (4)
BUY INDICATOR AND GET EA FOR FREE AS A BONUS + SOME OTHER GIFTS! ITALO LEVELS INDICATOR  is the best levels indicator ever created, and why is that? Using high volume zones on the market and Fibonacci the Indicator works on all time-frames and assets, indicator built after 7 years of experience on forex and many other markets. You know many levels indicators around the internet are not complete, does not help, and it's difficult to trade, but the   Italo Levels Indicator is different , the Ital
FabFrequency
Fabiano Luiz Roberto
1 (1)
This simple indicator creates a ZigZag based on market frequency. It can be very useful for those who trade TapeReading. Switch between the various timeframes and note that the ZigZag will be maintained, this is due to the method used to create a timeless indicator. Set the main input parameter: nTicks: Number of ticks for frequency inversion The other parameters are for visual aspects only, try them.
FREE
This indicator uses a different approach from the previous version to get it's trendlines. This method is derived from Orchard Forex, and the process of making the indicator is demonstrated in there video   https://www.youtube.com/watch?v=mEaiurw56wY&t=1425s . The basic idea behind this indicator is it draws a   tangent line   on the highest levels and lowest levels of the bars used for calculation, while ensuring that the lines don't intersect with the bars in review (alittle confusing? I kno
FREE
The Advanced Pivot Point Indicator is a powerful tool designed to help traders identify key support and resistance levels in the market. This versatile indicator offers a customizable and user-friendly interface, allowing traders to select from five different pivot point calculation methods: Floor, Woodie, Camarilla, Tom DeMark, and Fibonacci. With its easy-to-read lines for pivot points (PP), support (S1, S2, S3, S4), and resistance (R1, R2, R3, R4) levels, the Advanced Pivot Point Indicator pr
FREE
Automatic Trendlines
Pasi Hakamaki
4.65 (51)
Der Indikator zeichnet Trendlinien im Diagramm. Dieser Indikator hat sechs Eingänge. Der Benutzer kann alternative Beschriftungen für beide Zeilen angeben. Wenn mehrere Instanzen des Indikators verwendet werden, müssen sich die Beschriftungen unterscheiden. Der Benutzer kann die Breite und Farbe der Linien und die Tiefe festlegen, um festzulegen, welche signifikanten Peaks verwendet werden sollen. Zum Beispiel setzt Depth = 10 Trendlinien unter Verwendung der aktuellen Spitzen und Täler, die rec
FREE
Necessary for traders: tools and indicators Waves automatically calculate indicators, channel trend trading Perfect trend-wave automatic calculation channel calculation , MT4 Perfect trend-wave automatic calculation channel calculation , MT5 Local Trading copying Easy And Fast Copy , MT4 Easy And Fast Copy , MT5 Local Trading copying For DEMO Easy And Fast Copy , MT4 DEMO Easy And Fast Copy , MT5 DEMO The homeopathic indicator is also called the CCI indicator. The CCI indicator was propos
FREE
Heiken Ashi MT5 Indikator Verbessern Sie Ihre Marktanalyse mit dem Heiken Ashi MT5 Indikator. Dieses leistungsstarke Tool verwandelt Standard-Preisdaten in glattere, trendorientierte Kerzen, wodurch die Identifizierung von Markttrends und potenziellen Umkehrpunkten erleichtert wird. Hauptmerkmale: Klare Trendidentifikation: Unterscheiden Sie visuell zwischen Aufwärts- und Abwärtstrends durch unterschiedliche Kerzenfarben. Rauschreduktion: Filtern Sie Preisschwankungen heraus und erhalten Sie ei
FREE
What is this indicator? This indicator is the MACD (Moving Average Convergence/Divergence) supporting Virtual Trading mode of  Knots Compositor . When the mode is turned on, the indicator will be recalculated based on the displayed candlesticks. When the mode is turned off, the indicator will be recalculated based on the original chart candlesticks. Types of the applied price - Close - Open - High - Low - Median Price (HL/2) - Typical Price (HLC/3) - Weighted Price (HLCC/4) KC-Indicators
FREE
Are you tired of drawing trendlines every time you're analyzing charts? Or perhaps you would like more consistency in your technical analysis. Then this is for you. This indicator will draw trend lines automatically when dropped on a chart. How it works Works similar to standard deviation channel found on mt4 and mt5. It has 2 parameters: 1. Starting Bar 2. Number of bars for calculation The   starting bar   is the bar which drawing of the trend lines will begin, while the   number of bars for c
FREE
Käufer dieses Produkts erwarben auch
Atomic Analyst MT5
Issam Kassas
4.6 (20)
Zunächst einmal ist es erwähnenswert, dass dieser Handelsindikator nicht neu malt, nicht neu zeichnet und keine Verzögerung aufweist, was ihn sowohl für manuellen als auch für Roboterhandel ideal macht. Benutzerhandbuch: Einstellungen, Eingaben und Strategie. Der Atom-Analyst ist ein PA-Preisaktionsindikator, der die Stärke und das Momentum des Preises nutzt, um einen besseren Vorteil auf dem Markt zu finden. Ausgestattet mit fortschrittlichen Filtern, die helfen, Rauschen und falsche Signale z
Atbot
Zaha Feiz
4.97 (29)
AtBot: Wie es funktioniert und wie man es benutzt ### Wie es funktioniert Der "AtBot"-Indikator für die MT5-Plattform generiert Kauf- und Verkaufssignale mithilfe einer Kombination von technischen Analysetools. Er integriert den einfachen gleitenden Durchschnitt (SMA), den exponentiellen gleitenden Durchschnitt (EMA) und den Durchschnitt der wahren Reichweite (ATR)-Index, um Handelsmöglichkeiten zu identifizieren. Darüber hinaus kann er Heikin Ashi-Kerzen verwenden, um die Signalgenauigkeit zu
Zunächst einmal ist es wichtig zu betonen, dass dieses Handelssystem ein Nicht-Repainting-, Nicht-Redrawing- und Nicht-Verzögerungsindikator ist, was es sowohl für manuelles als auch für automatisches Trading ideal macht. Online-Kurs, Handbuch und Vorlagen herunterladen. Das "Smart Trend Trading System MT5" ist eine umfassende Handelslösung, die für neue und erfahrene Trader maßgeschneidert ist. Es kombiniert über 10 Premium-Indikatoren und bietet mehr als 7 robuste Handelsstrategien, was es zu
TPSpro RFI Levels MT5
Roman Podpora
4.67 (9)
Umkehr der ersten Impulsniveaus (RFI)       ANWEISUNGEN       Russland       -        ENG    Die Empfehlung basiert auf dem Indikator -   TPSpro   TREND PRO -   Version MT5 Die wichtigsten Elemente in der Branche sind entweder in Zonen oder in der Fabrik enthalten, oder sie führen zu einer Lösung bei einem Kauf oder dem Verkauf eines anderen Instruments. Wenn viele Menschen ihre Rechte nicht auf dem Händlerkonto verschlüsseln, werden die Folgen nicht schnell genug sein. Ich habe es damit abgesch
TPSproTREND PrO MT5
Roman Podpora
4.89 (9)
TPSpro TREND PRO   ist ein Trendindikator, der den Markt automatisch analysiert und Informationen über den Trend und jede seiner Änderungen liefert sowie Signale für den Einstieg in Geschäfte ohne Neuzeichnung gibt! Der Indikator verwendet jede Kerze und analysiert sie separat. bezieht sich auf verschiedene Impulse – Aufwärts- oder Abwärtsimpuls. Exakte Einstiegspunkte in Transaktionen für Währungen, Krypto, Metalle, Aktien, Indizes! Version MT5                   VOLLSTÄNDIGE BESCHREIBUNG DES I
Gold Stuff mt5
Vasiliy Strukov
4.9 (185)
Gold Stuff mt5-Ein Trendindikator, der speziell für Gold entwickelt wurde, kann auch auf allen Finanzinstrumenten verwendet werden. Der Indikator wird nicht neu gezeichnet und verzögert sich nicht. Empfohlener Zeitrahmen H1. WICHTIG! Kontaktieren Sie mich sofort nach dem Kauf, um Anweisungen und Bonus zu erhalten!     Sie können eine kostenlose Kopie unseres Strong Support- und Trendscanner-Indikators erhalten, bitte senden Sie uns eine persönliche Nachricht. Mich! DATEN Draw Arrow - in
Quantum Trend Sniper
Bogdan Ion Puscasu
4.92 (48)
Wir stellen vor       Quantum Trend Sniper Indicator   , der bahnbrechende MQL5-Indikator, der die Art und Weise, wie Sie Trendumkehrungen erkennen und handeln, verändert! Entwickelt von einem Team erfahrener Händler mit über 13 Jahren Handelserfahrung,       Quantum Trend Sniper-Indikator       wurde entwickelt, um Ihre Trading-Reise mit seiner innovativen Methode zur Identifizierung von Trendumkehrungen mit extrem hoher Genauigkeit auf ein neues Niveau zu heben. ***Kaufe Quantum Trend Snipe
Dies ist ein Indikator für MT5, der genaue Signale für den Einstieg in einen Handel ohne Repainting (Neuzeichnen) liefert. Er kann auf alle Finanzwerte angewendet werden: Forex, Kryptowährungen, Metalle, Aktien, Indizes. Er liefert ziemlich genaue Schätzungen und sagt Ihnen, wann es am besten ist, eine Position zu eröffnen und zu schließen. Sehen Sie sich das Video (6:22) mit einem Beispiel für die Verarbeitung nur eines Signals an, das sich für den Indikator gelohnt hat! Die meisten Händler ver
Trend Screener Pro MT5
STE S.S.COMPANY
4.88 (67)
Nutzen Sie die Macht des Trendhandels mit Trend Screener Indicator: Ihrer ultimativen Trendhandelslösung, die auf Fuzzy-Logik und einem System mit mehreren Währungen basiert! Steigern Sie Ihren Trendhandel mit Trend Screener, dem revolutionären Trendindikator mit Fuzzy-Logik. Es handelt sich um einen leistungsstarken Trendfolgeindikator, der über 13 Premium-Tools und -Funktionen sowie 3 Handelsstrategien kombiniert und ihn zu einer vielseitigen Wahl macht, um Ihren Metatrader in einen Trendanaly
FX Power MT5 NG
Daniel Stein
5 (6)
Erhalten Sie Ihr tägliches Marktupdate mit Details und Screenshots über unser Morning Briefing hier auf mql5 und auf Telegram ! FX Power MT5 NG ist die nächste Generation unseres langjährig sehr beliebten Währungsstärkemessers FX Power. Und was bietet dieser Stärkezähler der nächsten Generation? Alles, was Sie am ursprünglichen FX Power geliebt haben PLUS GOLD/XAU-Stärkeanalyse Noch präzisere Berechnungsergebnisse Individuell konfigurierbare Analysezeiträume Anpassbares Berechnungslimit für noc
Zunächst einmal ist es wichtig zu betonen, dass dieses Handelstool ein Nicht-Repaint-, Nicht-Redraw- und Nicht-Verzögerungsindikator ist, was es ideal für professionelles Trading macht. Online-Kurs, Benutzerhandbuch und Demo. Der Smart Price Action Concepts Indikator ist ein sehr leistungsstarkes Werkzeug sowohl für neue als auch erfahrene Händler. Er vereint mehr als 20 nützliche Indikatoren in einem und kombiniert fortgeschrittene Handelsideen wie die Analyse des Inner Circle Traders und S
FX Volume MT5
Daniel Stein
4.94 (17)
Erhalten Sie Ihr tägliches Marktupdate mit Details und Screenshots über unser Morning Briefing hier auf mql5 und auf Telegram ! FX Volume ist der ERSTE und EINZIGE Volumenindikator, der einen ECHTEN Einblick in die Marktstimmung aus Sicht eines Brokers bietet. Es bietet fantastische Einblicke in die Positionierung von institutionellen Marktteilnehmern, wie z.B. Brokern, auf dem Forex-Markt, viel schneller als COT-Berichte. Diese Informationen direkt auf Ihrem Chart zu sehen, ist der wahre Game
Easy By Sell is a market indicator for opening and closing positions. It becomes easy to track market entries with alerts. It indicates trend reversal points when a price reaches extreme values ​​and the most favorable time to enter the market. it is as effective as a Fibonacci to find a level but it uses different tools such as an algorithm based on ATR indicators and Stochastic Oscillator. You can modify these two parameters as you wish to adapt the settings to the desired period. My othe
IX Power MT5
Daniel Stein
4.17 (6)
IX Power   bringt die unschlagbare Präzision von FX Power endlich auch zu Nicht-Forex-Symbolen. Es bestimmt präzise die Intensität von kurz-, mittel- und langfristigen Trends in Ihren Lieblingsindizes, Aktien, Rohstoffen, ETFs und sogar Kryptowährungen. Sie können   alles analysieren, was   Ihr Terminal zu bieten hat. Probieren Sie es aus und erleben Sie, wie   sich Ihr Timing   beim Handel   deutlich verbessert . IX Power Hauptmerkmale 100% präzise, nicht nachpinselnde Berechnungsergebni
TrendMaestro5
Stefano Frisetti
note: this indicator is for METATRADER4, if you want the version for METATRADER5 this is the link:  https://www.mql5.com/it/market/product/108106 TRENDMAESTRO ver 2.4 TRENDMAESTRO recognizes a new TREND in the bud, he never makes mistakes. The certainty of identifying a new TREND is priceless. DESCRIPTION TRENDMAESTRO identifies a new TREND in the bud, this indicator examines the volatility, volumes and momentum to identify the moment in which there is an explosion of one or more of these data a
Golden Spikes Premium
Kwaku Bondzie Ghartey
Golden Spikes Detector Acknowledgement and Dedications:  The name of this indicator was Inspired by an Original; Mr Grant Koopman; a Knowledgeable and experienced Synthetics trader. I dedicate this indicator to Mr Grant.  Overview: The Golden Spikes Premium is a groundbreaking trading indicator meticulously crafted for the Boom and Crash indices on the Deriv market. Tailored to meet the needs of discerning traders, this powerful tool operates exclusively on the one-minute timeframe, providin
Jetzt 147 US -Dollar (nach ein paar Aktualisierungen auf 499 US -Dollar) - Unbegrenzte Konten (PCs oder MACs) RelicusRoad Benutzerhandbuch + Schulungsvideos + Zugang zur privaten Discord-Gruppe + VIP-Status EINE NEUE ART, DEN MARKT ZU BETRACHTEN RelicusRoad ist der weltweit leistungsstärkste Handelsindikator für Forex, Futures, Kryptowährungen, Aktien und Indizes und gibt Händlern alle Informationen und Tools, die sie benötigen, um profitabel zu bleiben. Wir bieten technische Analysen un
XQ Indicator MetaTrader 5
Marzena Maria Szmit
3.5 (2)
Step into the realm of Forex trading with confidence and precision using XQ, a cutting-edge Forex indicator designed to elevate your trading game to unprecedented heights. Whether you're a seasoned trader or just stepping into the world of currency exchange, XQ Forex Indicator empowers you with the insights and signals needed to make informed trading decisions. The signal conditions are a combination of three indicators, and XQ Forex Indicator only display  medium and long-term trends . The ind
Trend Hunter MT5
Andrey Tatarinov
5 (1)
Trend Hunter ist ein Trendindikator für die Arbeit auf den Forex-, Kryptowährungs- und CFD-Märkten. Eine Besonderheit des Indikators besteht darin, dass er dem Trend souverän folgt, ohne das Signal zu ändern, wenn der Preis die Trendlinie leicht durchbricht. Der Indikator wird nicht neu gezeichnet; nach dem Schließen des Balkens erscheint ein Signal zum Markteintritt. Bei der Bewegung entlang eines Trends zeigt der Indikator zusätzliche Einstiegspunkte in Richtung des Trends an. Basierend auf
The Smart Liquidity Profile is color-coded based on the importance of the traded activity at specific price levels, allowing traders to identify significant price levels such as support and resistance levels, supply and demand zones, liquidity gaps, consolidation zones, Buy-Side/Sell-Side Liquidity and so on.  Smart Liquidity Profile allows users to choose from a number of different time periods including 'Auto,' 'Fixed Range,' 'Swing High,' 'Swing Low,' 'Session,' 'Day,' 'Week,' 'Month,' 'Quart
Dieses Dashboard zeigt die   neuesten verfügbaren harmonischen   Muster für die ausgewählten Symbole, so dass Sie Zeit sparen und effizienter sein werden /   MT4-Version . Kostenloser Indikator:   Basic Harmonic Pattern Spalten des Indikators Symbol:   die ausgewählten Symbole werden angezeigt Trend:   bullish oder bearish Pattern :   Art des Musters (Gartley, Schmetterling, Fledermaus, Krabbe, Hai, Cypher oder ABCD) Entry :   Einstiegskurs SL:   Stop-Loss-Kurs TP1:   1. Take-Profit-Kurs
ATrend
Zaha Feiz
4.5 (2)
ATREND: How It Works and How to Use It How It Works The " ATREND " indicator for the MT5 platform is designed to provide traders with robust buy and sell signals by utilizing a combination of technical analysis methodologies. This indicator primarily leverages the Average True Range (ATR) for volatility measurement, alongside trend detection algorithms to identify potential market movements. Leave a massage after purchase and receive a special bonus gift. 8 copies left for 39$ price  Key Fe
Volume by Price MT5
Brian Collard
3.6 (5)
The Volumebyprice.com Indicator for MetaTrader 5 features Volume Profile and Market Profile TPO (Time Price Opportunity). Volume and TPO histogram bar and line charts. Volume Footprint charts. TPO letter and block marker collapsed and split structure charts. Static, dynamic and flexible range segmentation and compositing methods with relative and absolute visualizations. Session hours filtering and segment concatenation with Market Watch and custom user specifications. Graphical layering, posit
Das Volatility Trend System ist ein Handelssystem, das Signale für Einstiege liefert. Das Volatilitätssystem liefert lineare und punktuelle Signale in Richtung des Trends sowie Signale zum Verlassen des Trends, ohne Neuzeichnung oder Verzögerungen. Der Trendindikator überwacht die Richtung des mittelfristigen Trends, zeigt die Richtung und deren Änderung an. Der Signalindikator basiert auf Änderungen der Volatilität und zeigt Markteintritte an. Der Indikator ist mit mehreren Arten von Warn
Advanced Supply Demand MT5
Bernhard Schweigert
4.53 (15)
Derzeit 33% Rabatt! Die beste Lösung für jeden Anfänger oder erfahrenen Händler! Dieser Indikator ist ein einzigartiges, qualitativ hochwertiges und erschwingliches Trading-Tool, da wir eine Reihe von proprietären Funktionen und eine neue Formel integriert haben. Mit diesem Update werden Sie in der Lage sein, doppelte Zeitrahmenzonen anzuzeigen. Sie können nicht nur einen höheren TF (Zeitrahmen) anzeigen, sondern sowohl den Chart-TF als auch den höheren TF: SHOWING NESTED ZONES. Alle Supply Dema
ICT, SMC, SMART MONEY CONCEPTS, SMART MONEY, Smart Money Concept, Support and Resistance, Trend Analysis, Price Action, Market Structure, Order Blocks, BOS/CHoCH,   Breaker Blocks ,  Momentum Shift,   Supply&Demand Zone/Order Blocks , Strong Imbalance,   HH/LL/HL/LH,    Fair Value Gap, FVG,  Premium  &   Discount   Zones, Fibonacci Retracement, OTE, Buy Side Liquidity, Sell Side Liquidity, BSL/SSL Taken, Equal Highs & Lows, MTF Dashboard, Multiple Time Frame, BigBar, HTF OB, HTF Market Structure
Matrix Arrow Indicator MT5
Juvenille Emperor Limited
5 (14)
Matrix Arrow Indicator MT5   ist ein einzigartiger 10-in-1-Trend, der zu   100 % nicht neu gezeichnet   werden kann. Multi-Timeframe-Indikator, der für alle Symbole/Instrumente verwendet werden kann:   Forex ,   Rohstoffe ,   Kryptowährungen ,   Indizes ,   Aktien .  Der  Matrix Arrow Indicator MT5  wird den aktuellen Trend in seinen frühen Stadien bestimmen und Informationen und Daten von bis zu 10 Standardindikatoren sammeln, die sind: Durchschnittlicher Richtungsbewegungsindex (ADX) Rohstoff
Werden Sie Breaker Trader und profitieren Sie von Änderungen der Marktstruktur, wenn sich der Preis umkehrt. Der Order Block Breaker Indikator zeigt an, wann sich eine Trend- oder Preisbewegung der Erschöpfung nähert und bereit ist, sich umzukehren. Es weist Sie auf Änderungen in der Marktstruktur hin, die normalerweise auftreten, wenn eine Umkehrung oder ein größerer Rückzug bevorsteht. Der Indikator verwendet eine proprietäre Berechnung, die Ausbrüche und Preisdynamik identifiziert. Jedes
Gartley Hunter Multi
Siarhei Vashchylka
5 (8)
Gartley Hunter Multi - An indicator for searching for harmonic patterns simultaneously on dozens of trading instruments and on all possible timeframes. Manual (Be sure to read before purchasing) | Version for MT4 Advantages 1. Patterns: Gartley, Butterfly, Shark, Crab. Bat, Alternate Bat, Deep Crab, Cypher 2. Simultaneous search for patterns on dozens of trading instruments and on all possible timeframes 3. Search for patterns of all possible sizes. From the smallest to the largest 4. A
Blahtech Supply Demand MT5
Blahtech Limited
4.54 (13)
Was: $299  Now: $99   Supply Demand uses previous price action to identify potential imbalances between buyers and sellers. The key is to identify the better odds zones, not just the untouched ones. Blahtech Supply Demand indicator delivers functionality previously unavailable on any trading platform. This 4-in-1 indicator not only highlights the higher probability zones using a multi-criteria strength engine, but also combines it with multi-timeframe trend analysis, previously confirmed swings
Weitere Produkte dieses Autors
SyncGraph Plus
PATRICK ANTONIO MORELO A.
Indicator that synchronizes the charts, that is, when the asset is replaced in one of the charts, all those that appear with the synchronized indicator are changed, with the same timeframe (Same_Timeframe = true) or with different timeframes (Same_Timeframe = false). The graphics to be synchronized are identified by color (Label). To synchronize the indicators, the indicator must be inserted in all charts to be synchronized, using the same color (Label). A box with the chosen color (Label) and
Mini Panel Plus
PATRICK ANTONIO MORELO A.
4.5 (8)
Remodeling the BoletaMiniPanel, the Mini Panel Plus has the same functionalities, but is now in the form of a box that allows it to be minimized and placed anywhere on the chart. Simple Panel with Stop loss (Loss), Stop gain (Gain), Trailing stop (TS) and Breakeven (BE-P). The Lot is the number of contracts to be traded. Gain is the number, in points, at which the stop gain will be positioned. If you don't want to place a stop gain, just put 0 (zero) in its place and when you open the order it w
FREE
SyncGraph
PATRICK ANTONIO MORELO A.
2 (3)
Indicator that synchronizes the charts, that is, when the symbol is replaced in one of the charts, all those that appear with the synchronized indicator are changed, with the same timeframe (Same_Timeframe = true) or with different timeframes (Same_Timeframe = false). The graphics to be synchronized are identified by color (Label). To synchronize the indicators, the indicator must be inserted in all the charts to be synchronized, using the same color (Label). A box with the chosen color (La
FREE
BoletaMiniPanel
PATRICK ANTONIO MORELO A.
5 (5)
Simple panel with  Stop loss (Loss), Stop gain (Gain) , Trailing stop (TS) and Breakeven (BE-P). Lot is the number of contracts to be traded. Gain is the number, in points, that the stop gain will be positioned. If you don't want to put stop gain, just put 0 (zero) in place and when you open the order it won't have this stop. Loss is the number, in points, that the stop loss will be placed. If you don't want to put stop loss, just put 0 (zero) in place and when you open the order it won't
FREE
TRIXe
PATRICK ANTONIO MORELO A.
5 (4)
The TRIXe Indicator is the combination of the TRIX indicator (Triple Exponential Moving Average) with the addition of an EMA (Exponential Moving Average) signal. It provides signs of trend continuity and the start of a new trend. The entry and exit points of operations occur when the indicator curves cross. It performs better when combined with other indicators.
FREE
Needles Screener
PATRICK ANTONIO MORELO A.
Expert Advisor that tracks assets listed in the Market Watch window by checking which assets are needled (crossing the 3, 8, and 20 moving averages) or are close to crossing. It does not track when there is no crossing of the averages. The EA allows you to choose the timeframe for analyzing the crossings. There is no maximum limit for assets or EAs running simultaneously, but a very large number can lead to system slowdown and freezing. Users should be mindful of their device's capabilities. T
FREE
SyncGraph Plus MT4
PATRICK ANTONIO MORELO A.
Indicator that synchronizes the charts, that is, when the asset is replaced in one of the charts, all those with the synchronized indicator are changed, with the same timeframe (Same_Timeframe = true) or with different timeframes (Same_Timeframe = false). The graphics to be synchronized are identified by color (Label). To synchronize indicators, the indicator must be inserted in all charts to be synchronized, using the same color (Label). A box with the chosen color (Label) and identification A
Auswahl:
81115533
34
81115533 2024.03.17 22:29 
 

bom recomendo

ricardo andrade
23
ricardo andrade 2024.02.14 16:32 
 

Excelente!

rnicacio
24
rnicacio 2023.05.08 21:23 
 

Excelente indicador! Ajuda na hora de sair da operação.

jgomnet2022
44
jgomnet2022 2023.03.26 11:57 
 

Era o que procurava, muito assertivo. Parabéns ao criador!

erivaldojjr
24
erivaldojjr 2023.02.09 21:44 
 

ainda em estudo

Israel Francisco
27
Israel Francisco 2023.02.09 13:30 
 

Uso o metatrader5 no linux Ubuntu 21. Não consigo configurar as cores. Em aguns indicadores eu faço no editor

MaxiGuto
37
MaxiGuto 2023.01.03 00:44 
 

Fui indicado pelo "Japa do Trade" num vídeo onde ele explica como montar a tela do Didi no MT5. Ainda sou iniciante, mas vou estudar e usar o Didi na conta Demo. Depois volto aqui para divulgar meus resultados. Obrigado

Joao Carlos Espindola
142
Joao Carlos Espindola 2022.12.19 15:47 
 

Muito bom. Recomendo

mscanto1
44
mscanto1 2022.07.17 14:26 
 

Funciona muito bem junto com os outros indicadores complementares! Muito bom

Cicero Lopes Da Costa
124
Cicero Lopes Da Costa 2022.07.14 14:11 
 

Excelente! Estou juntando o operacional do DIDI e o MW4 do Willy Heine. No primeiro dia 100% de assertividade. Analisei 28 ativos, entrei em 4 e realizei com ganho os 4. O TRIXs auxilia, principalmente, para saber a hora de sair de uma operação. Fundamentalismo e grafismo juntos funcionam muito bem. Claro que 4 operações não são suficientes para fechar a estatística. Mas o TRIXs já é meu preferido.

Marciano Santos
100
Marciano Santos 2022.07.13 00:08 
 

Excelente indicador. Estou estudando ele no setup do Didi.

Franklin Delano
97
Franklin Delano 2022.06.23 03:54 
 

Excelente!

pr525
54
pr525 2022.06.20 05:05 
 

Só parabenizar e agradecer! Valeu!

Antwort auf eine Rezension