• Übersicht
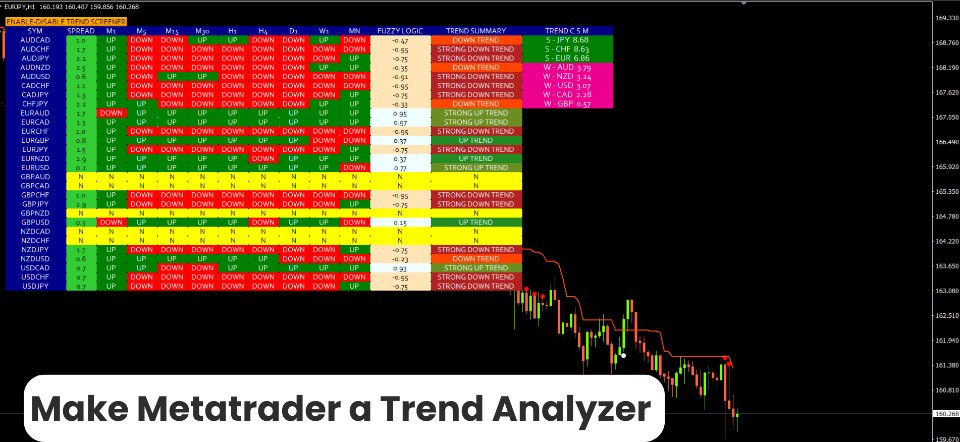
  • Bewertungen (101)
  • Diskussion (295)
  • Neue Funktionen

Trend Screener

4.78

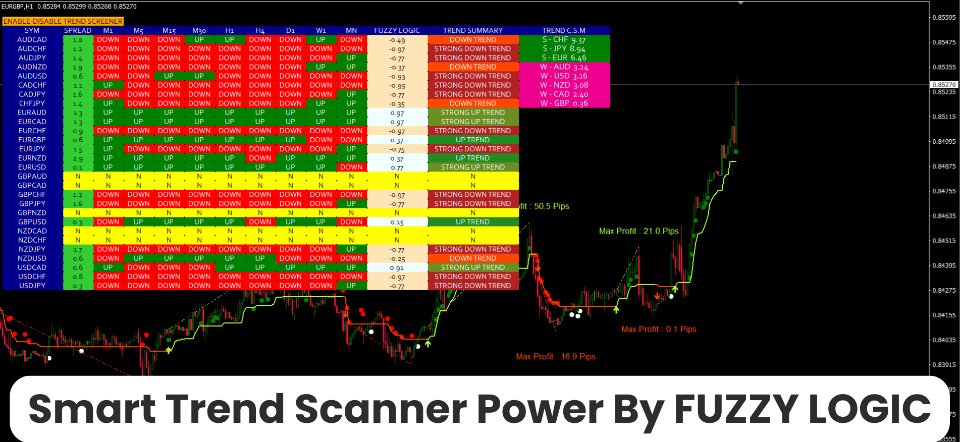
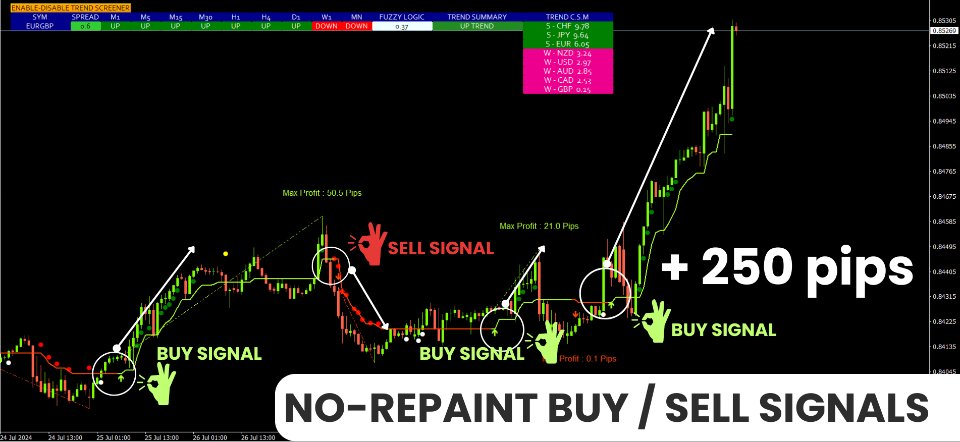
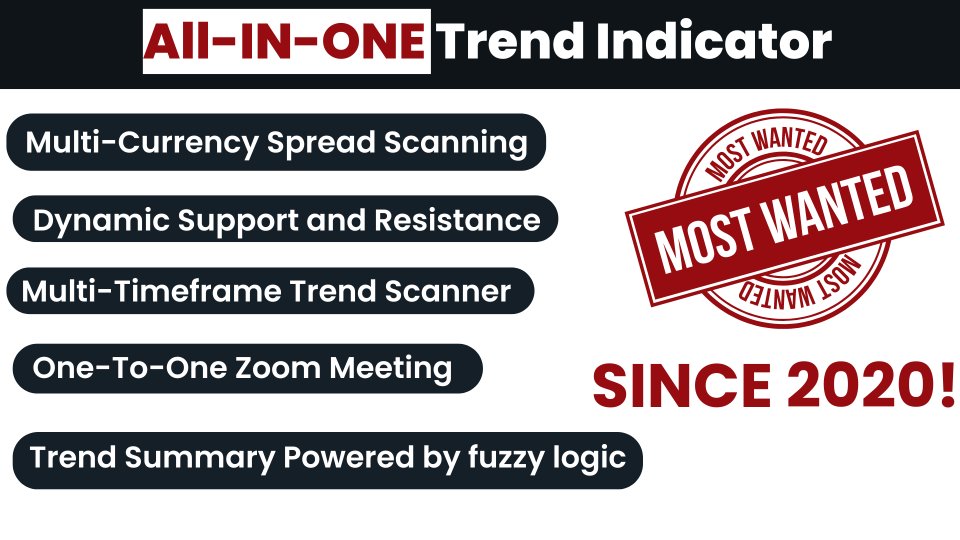
Trendindikator, bahnbrechende, einzigartige Lösung für Trendhandel und -filterung mit allen wichtigen Trendfunktionen in einem Tool! Es handelt sich um einen 100 % nicht neu zu malenden Multi-Timeframe- und Multi-Währungs-Indikator, der für alle Symbole/Instrumente verwendet werden kann: Forex, Rohstoffe, Kryptowährungen, Indizes und Aktien.

ZEITLICH BEGRENZTES ANGEBOT: Der Support- und Resistance-Screener-Indikator ist für nur 50 $ und lebenslang verfügbar. (Ursprünglicher Preis 250 $) (Angebot verlängert)

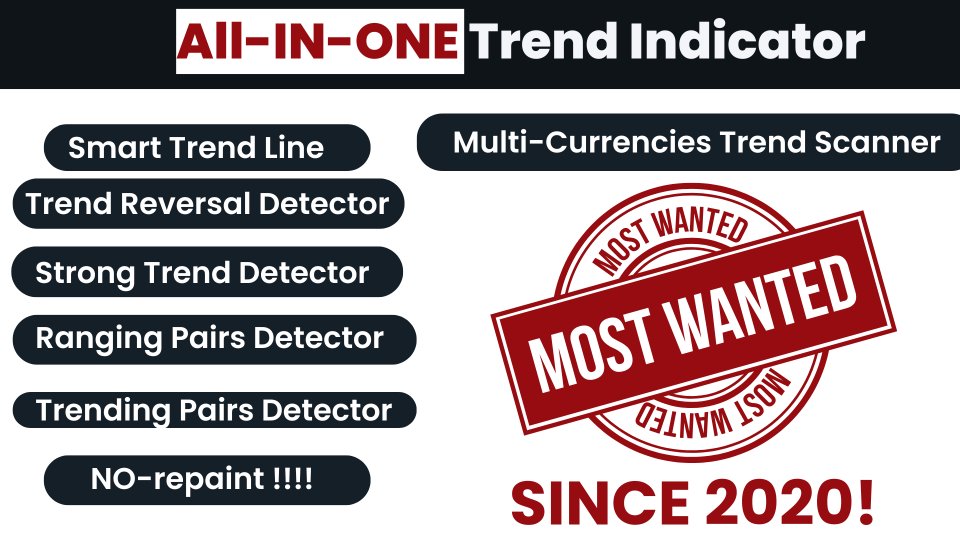
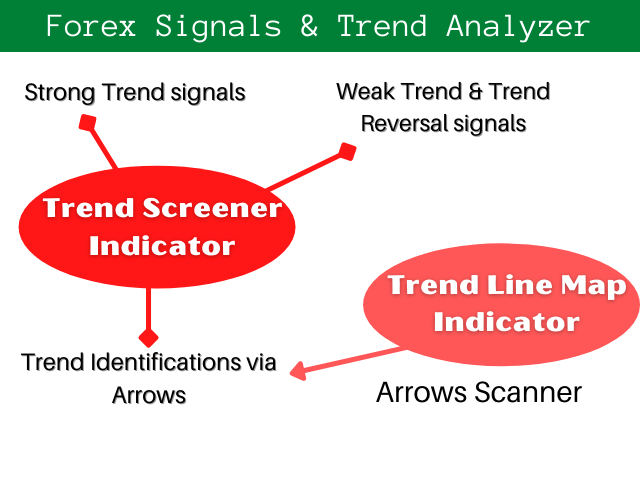
Trend Screener ist ein effizienter Trendfolgeindikator, der Pfeiltrendsignale mit Punkten im Diagramm liefert. Die Funktionen, die im Trendanalysator-Indikator verfügbar sind:

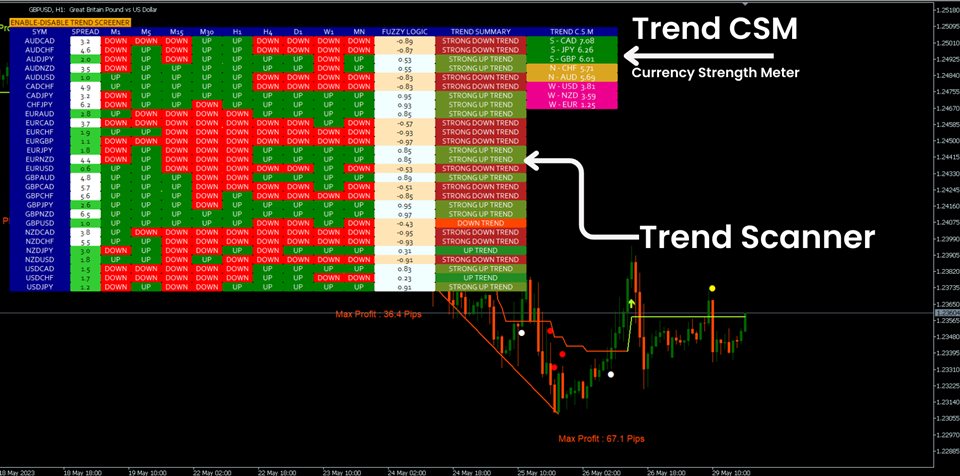
1. Trend-Scanner.

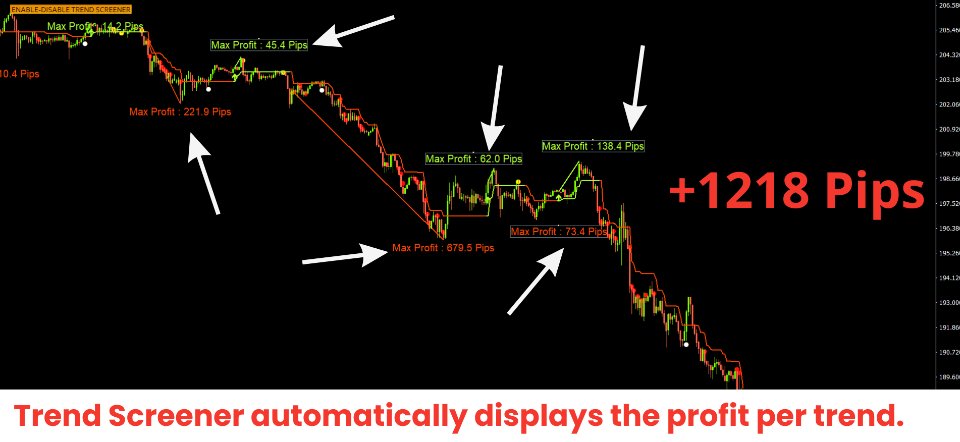
2. Trendlinie mit Max-Profit-Analyse.

3. Trendwährungsstärkemesser.

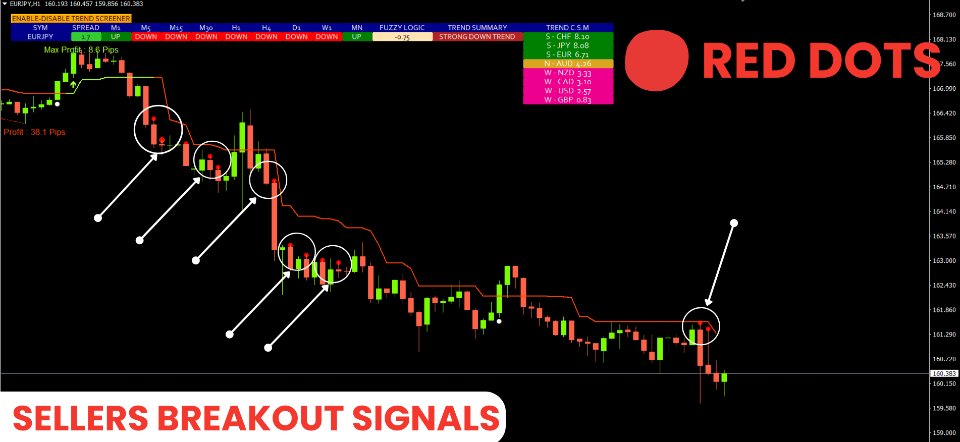
4. Trendumkehrpunkte mit Warnungen.

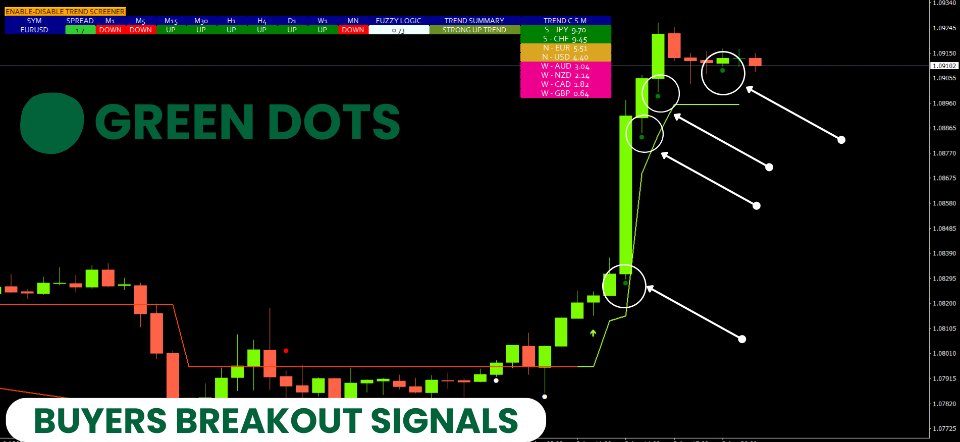
5. Starke Trendpunkte mit Warnungen.

6. Trendpfeile

Tägliche Analysebeispiele, tägliche Signalleistung usw. mit unserem Trend-Screener-Indikator finden Sie hier: Klicken Sie hier


ZEITBEGRENZTES ANGEBOT: Trend Screener Indicator ist für nur 50 $ und Lebensdauer erhältlich. ( Originalpreis 125 $ )

Wenn Sie auf unseren MQL5-Blog zugreifen, finden Sie alle unsere Premium-Indikatoren mit Analysebeispielen, der täglichen Signalleistung usw. : Klicken Sie hier


Unser Trendsystem bestehend aus 2 Indikatoren:


1. Trend Screener Indicator: Trend-Dashboard, Trendlinie im Diagramm, Einstiegspunkte usw. anzeigen.

2. Trend Line Map Indicator : Zeigen Sie Kauf und Verkauf als Dashboard an, die aktiven Signale Gewinn/Verlust...etc.

        Trendlinien-Kartenanzeige herunterladen


Tutorials zu Youtube-Videos:

In unserem MQL5-Blog finden Sie viele YouTube-Video-Tutorials, in denen wir erklären, wie man den Trend Screener Indicator verwendet und wie man damit handelt. Klicken Sie hier, um alle Videos zu finden.


Hauptmerkmale

  • Trendstärke-Analysator.
  • Multi-Timeframe- und Multi-Währungs-Trendanalysator.
  • Trend-Dashboard
  • Trendumkehrsignale. (Punktsignale)
  • Starke Trendsignale. (Punktsignale)
  • Trendlinie


Dokumentationen ( Anleitungen )

Alle Dokumentationen ( Anleitungen ) und Strategiedetails zu Trend Screener finden Sie in diesem Beitrag in unserem MQL5-Blog: Klicken Sie hier.


Kontakt

Wenn Sie Fragen haben oder Hilfe benötigen, kontaktieren Sie mich per Privatnachricht.


Autor

SAYADI ACHREF , Fintech-Software-Ingenieur und Gründer von Finansya.


Bewertungen 101
kourtfx
32
kourtfx 2025.02.15 12:20 
 

Amazing Indicator! If you know what your doing then this Indicator will be very helpful. And the Seller is a very honest and good man. Thanks for creating this Indicator!

jabri7
22
jabri7 2025.02.15 12:07 
 

I would give this indicator 10 stars if I could! For the past 7 months, it's been a game-changer in identifying trending currency pairs with the trend CSM. Previously, spotting trends across 28 pairs was a real challenge. Now, I can quickly identify strong trends and reversals. This system has truly transformed my trading, leading to noticeable success. I took a chance based on the positive reviews, and I'm so glad I did. Sayadi is incredibly responsive to questions. In fact, I've been so impressed that I'm getting the support and resistance screener indicator now. Thank you.

Nelson Belchior
1239
Nelson Belchior 2024.11.13 10:00 
 

Very good indicator. It´s very reliable, although the higher the timeframe, higher is the winrate. One tip, if the owner can, it would be better to use a winrate statistic of each pair in order to see the past results.

Empfohlene Produkte
Trend Line Map Pro
STE S.S.COMPANY
4.47 (15)
Trend Line Map Indicator ist ein Add-On für Trend Screener Indicator . Es arbeitet als Scanner für alle Signale, die vom Trendscreener (Trendliniensignale) erzeugt werden. Es ist ein Trend Line Scanner basierend auf dem Trend Screener Indicator. Wenn Sie keinen Trend Screener Pro Indicator haben, funktioniert die Trend Line Map Pro nicht. Wenn Sie auf unseren MQL5-Blog zugreifen, können Sie die kostenlose Version des Trend Line Map-Indikators herunterladen. Probieren Sie es aus, bevor Sie e
Quantum Heiken Ashi PRO MT4
Bogdan Ion Puscasu
4.33 (6)
Wir stellen vor       Quantum Heiken Ashi PRO-   Charts Die Heiken-Ashi-Kerzen wurden entwickelt, um klare Einblicke in Markttrends zu geben und sind bekannt für ihre Fähigkeit, Rauschen herauszufiltern und falsche Signale zu eliminieren. Verabschieden Sie sich von verwirrenden Preisschwankungen und begrüßen Sie eine glattere, zuverlässigere Diagrammdarstellung. Was den Quantum Heiken Ashi PRO wirklich einzigartig macht, ist seine innovative Formel, die traditionelle Candlestick-Daten in leicht
Der R 2EMA Color Indikator für MT4 liefert solide Handelssignale basierend auf dem Crossover von 2 EMAs. Wichtige Punkte Wenn der Preis die beiden grünen EMAs kreuzt und über ihnen schließt, erzeugt dies ein Kaufhandelssignal. Wenn der Preis die beiden roten EMAs kreuzt und über ihnen schließt, entsteht ein Verkaufssignal. Der R 2EMA Color Forex Indikator macht es noch einfacher festzustellen, wann es Zeit zum Kaufen und Verkaufen ist Ein Kaufsignal tritt auf, wenn die 2 EMA-Linien grün werde
High Pass Filter Candlesticks
Safwan Rushdi Khalil Arekat
This indicator applies the  biquad high pass filter to the price-chart data, and displays the filter output for the OHLC as candlesticks. The candlesticks corresponds to the actual calculations of the filter value  during the formation of each price bar (not from all historical highs lows or closes). The shape of the bars therefore corresponds directly to the shape of each price bar. High pass filters are an underappreciated type of oscillator that are seldom used in technical analysis in the st
FREE
Noize Absorption Index MT4
Ekaterina Saltykova
5 (1)
Noize Absorption Index - is the manual trading system that measures the difference of pressure between bears forces and bulls forces. Green line - is a noize free index that showing curent situation. Zero value of index shows totally choppy/flat market.Values above zero level shows how powerfull bullish wave is and values below zero measures bearish forces.Up arrow appears on bearish market when it's ready to reverse, dn arrow appears on weak bullish market, as a result of reverse expectation. S
EARLY REMINDER: The Starting price is 65 price will rise soon up to 365$ and then 750$ after first 10 copies of sales. Grab this offer now! Introduction Hello, traders! Welcome to the demonstration of the Forex Beast Indicator , a comprehensive tool designed to assist aspiring traders in navigating the complexities of the forex market. This indicator incorporates seven essential components to provide a well-rounded trading experience: Moving Averages Colored Zones Support and Resistance Levels
Daily Candle Predictor ist ein Indikator, der den Schlusskurs einer Kerze vorhersagt. Der Indikator ist in erster Linie für die Verwendung in D1-Charts gedacht. Dieser Indikator eignet sich sowohl für den traditionellen Devisenhandel als auch für den Handel mit binären Optionen. Der Indikator kann als eigenständiges Handelssystem oder als Ergänzung zu Ihrem bestehenden Handelssystem verwendet werden. Dieser Indikator analysiert die aktuelle Kerze und berechnet bestimmte Stärkefaktoren innerhalb
Super Reversal Pattern
Parfait Mujinga Ndalika
Super Reversal Pattern Indicator Unlock the power of advanced pattern recognition with our Super Reversal Pattern Indicator. Designed for traders seeking precision and reliability, this indicator identifies one of the most effective reversal patterns in technical analysis, offering a significant edge in your trading strategy. Key Features: Non-Repainting Accuracy: Enjoy the confidence of non-repainting technology. Once a Super Reversal Pattern is detected, it remains static, providing consiste
API Digital Multi Indicator Scalper – Clear Digital Display API Digital Multi Indicator Scalper , a tool that integrates RSI, MFI, CCI, Bulls and Bears  into a digital display for  market analysis . This indicator is designed for scalpers and short-term traders who demand  clear data . Key Features: Digital Display – Monitor RSI, MFI, CCI, Bulls and Bears values in an easy-to-read digital format. Color Changes – Visual cues help identify possible  trend changes  at a glance. Adjustable
MACD Color for GOLD
Chitipat Changsamrit
MACD Color for GOLD  Use for looking moving-way of graph and checking will be buy or sell  Easy for looking by see the color of trand. Red is down / Blue is up.  Can to use it with every time-frame by 1. Long Trade : Use it with time-frame H1 /  H4 /  Daily  2.Short Trade : Use it with  time-frame  M5 / M15  / M 30 /  H1 and you can see when you will open or close the orders by see this indicator by well by see signal line cut with color line again in opposite. and you can use this indicator for
Classic Fractals indicator for MT4, with additional Trendlines connecting the latest couples of fractals ( fractals are showing highest high, and lowest low on each period) Rules for trendlines: -if new top fractal is below the last one = new resistance line -if new bot fractal is above the last one = new support line -Trendlines can be hidden -Fractals can be hidden Fractal Period = can be both even or uneven number, as it is setting for half (one side) of the bars sequence for findin
Binary Options Support Resistance Indicator This indicator is designed for binary options trading and effectively shows retracements from support and resistance levels. Signals appear on the current candle. A red arrow pointing downwards indicates a potential selling opportunity, while a blue arrow pointing upwards suggests buying opportunities. All that needs adjustment is the color of the signal arrows. It is recommended to use it on the M1-M5 timeframes as signals are frequent on these timef
TWO PAIRS SQUARE HEDGE METER INDICATOR Try this brilliant 2 pairs square indicator It draws a square wave of the relation between your two inputs symbols when square wave indicates -1 then it is very great opportunity to SELL pair1 and BUY Pair2 when square wave indicates +1 then it is very great opportunity to BUY pair1 and SELL Pair2 the inputs are : 2 pairs of symbols         then index value : i use 20 for M30 charts ( you can try other values : 40/50 for M15 , : 30 for M30 , : 10 for H1 ,
Binary Scalper 6 – Leistungsstarker Indikator für binäre Optionen für MT4 Binary Scalper 6 ist ein fortschrittliches Tool zur Trendanalyse und zum Handel mit binären Optionen auf MetaTrader 4 (MT4) . Geeignet für Trader aller Erfahrungsstufen, bietet er klare Signale und detaillierte Statistiken. Hauptmerkmale: Trend-Erkennung : Präzise Identifikation von Trendmärkten. Unterstützt alle Währungspaare : Flexibilität für bevorzugte Märkte. Funktioniert auf jedem Zeitrahmen : Von 1-Minuten- bis zu
Power Renko is an indicator which plots Renko bricks underneath the chart using a histogram. You can select the brick size and the timeframe of the Renko bricks as well as whether or not to use the close price or the high/low price of the candles. Renko bricks are based on price alone, not time, therefor the Renko bricks will not be aligned with the chart's time. They are extremely useful for trend trading and many different strategies can be formed from them. Buffers are provided allowing you t
Rapid
Igor Semyonov
The Rapid indicator is a ready binary options trading system . The system is designed for trading on a five-minute interval with the 15-minute expiration and with the payout at least 85%, it is designed for traders using web terminals and MetaTrader 4 platform. Available financial instruments: EURUSD, EURCHF, GBPUSD, GBPJPY, USDJPY and XAGUSD. This is a counter-trend system, i.e. it waits for the price reversal of a traded asset. The indicator signals are not redrawn, they appear after the close
This indicator works on MT4 and is very easy to use. When you receive a signal from it, you wait for that candle with the signal to close and you enter your trade at the beginning of the next new candle . A red arrow means sell and a green arrow means buy. All arrows comes with Alert  like for easy identification of trade signal. Are you okay with that? 1 minute candle 1 minute expire
Indicator for binary options arrow is easy to use and does not require configuration works on all currency pairs, cryptocurrencies buy signal blue up arrow sell signal red down arrow tips do not trade during news and 15-30 minutes before their release, as the market is too volatile and there is a lot of noise it is worth entering trades one or two candles from the current period (recommended for 1 candle) timeframe up to m 15 recommended money management fixed lot or fixed percentage of the depo
Waterfall Mt4
Justine Kelechi Ekweh
Waterfall Trading Indicator Overview The Waterfall Trading Indicator is a powerful momentum detection tool designed to identify high-probability trading opportunities across multiple timeframes. Built on pure price action analysis, this indicator provides clear, non-repainting signals that are especially effective for binary options and forex trading. Key Features Non-Repainting Signals : Based on real-time price action, ensuring reliable trade signals Multi-Timeframe Compatibility : Effective a
YK-Fibo Pivot Indicator: Trade Smarter with Fibonacci Pivot Points The YK-Fibo Pivot Indicator is a powerful technical analysis tool that combines the precision of Fibonacci retracements with the insights of Pivot Points. Whether you're a novice or seasoned trader, this indicator empowers you to spot profitable opportunities in the market with ease. Why Choose YK-Fibo Pivot? Pinpoint Support & Resistance: By calculating Fibonacci levels based on the previous day's high, low, and close prices, y
NEW check the FULL Version Including the private ICT tools limited so far until the release of the full 2016 Mentorship Core Content to the public. Indicator type: Money Management Calculator; Forex Position Size Calculator; Fixed or ATR value for Stop Loss and Take Profit levels; Average Position Size Indicator (True Average Price); Acc ount Information; Stop-out Level, Margin and Risk Exposure Warning, Forex Sessions; Institutional Levels Grid; Major Highs and Lows, Detailed Account Report an
A Boss Stats
Anthonius Soruh
Hi Trader, We are strategy development for Binary and Forex tools, our product have success for binary trading 1 min - 2 min experation. At the moment I build indicator for trading all day, not like Bonosu series with specific time. We launch A-Boss Stats Indicator for trading 1 minute to 5 minutes experation is mean can trade from 1 minutes - 5 minutes. Specification of A Boss Stats trading binary option: Work with all MT4 broker. Chart Time Frame M1 only, can use M5 Experation time for contact
This is a new strategy for SUPPLY DEMAND areas It is based on a calculation using the tick volume to detect the big price action in market for both bear /bull actions this smart volume action candles are used to determine the supply and demand areas prices in between main supply and demand lines indicate sideway market  up arrows will be shown when prices moves above the main supply and the secondary supply lines Down arrows will be shown when prices moves below the main demand and the secondary
Advanced Stochastic Scalper - is a professional indicator based on the popular Stochastic Oscillator. Advanced Stochastic Scalper is an oscillator with dynamic overbought and oversold levels, while in the standard Stochastic Oscillator, these levels are static and do not change. This allows Advanced Stochastic Scalper to adapt to the ever-changing market. When a buy or a sell signal appears, an arrow is drawn on the chart and an alert is triggered allowing you to open a position in a timely mann
Crypto_Forex-Indikator „3 Black Crows-Muster“ für MT4. - Der Indikator „3 Black Crows-Muster“ ist sehr leistungsstark für den Price Action-Handel: Kein Neuanstrich, keine Verzögerung. - Der Indikator erkennt bärische „3 Black Crows“-Muster auf dem Diagramm: Rotes Pfeilsignal auf dem Diagramm (siehe Bilder). - Mit PC-, Handy- und E-Mail-Benachrichtigungen. - Auch sein Bruder, der bullische „3 White Soldiers-Muster“-Indikator, ist verfügbar (folgen Sie dem Link unten). - Der Indikator „3 Black C
MA Alignment Scanner
Benedict Jamora
5 (1)
This indicator scans and displays currency pairs that have recently aligned moving averages on a given timeframe. You can configure which pairs the indicator will scan. It also includes all types of alert options. Bullish MA Alignment =  MA1>MA2>MA3>MA4>MA5 Bearish MA Alignment =  MA1<MA2<MA3<MA4<MA5 Features Attach to one chart and scans all the currency pairs configured and visible in the Market Watch Window It can monitor all the available timeframes from M1 to MN1 and sends alerts on every
This indicator is a conventional analytical tool for tick volumes changes. It calculates tick volumes for buys and sells separately, and their delta on every bar, and displays volumes by price clusters (cells) within a specified bar (usually the latest one). The algorithm used internally is the same as in the indicator VolumeDelta , but results are shown as cumulative volume delta bars (candlesticks). Analogous indicator for MetaTrader 5 exists - VolumeDeltaBars . This is a limited substitution
Shark Trading
Yaroslav Varankin
The indicator is designed to trade binary options on small time frames up to m 30 Signals The blue up arrow is a buy signal. The red dn arrow is a sell signal. The signal will appear together with the advent of a new candle  and during formation Signals on the current candle Expiration time one candle from the timeframe on which you are trading You can use moving average to filter out false signals. Or escort support levels. This tool is reliable in trading.
VR Cub
Vladimir Pastushak
VR Cub ist ein Indikator für den Erhalt hochwertiger Einstiegspunkte. Der Indikator wurde entwickelt, um mathematische Berechnungen zu erleichtern und die Suche nach Einstiegspunkten in eine Position zu vereinfachen. Die Handelsstrategie, für die der Indikator geschrieben wurde, hat sich seit vielen Jahren bewährt. Ihr großer Vorteil liegt in der Einfachheit der Handelsstrategie, die es auch unerfahrenen Händlern ermöglicht, erfolgreich damit zu handeln. VR Cub berechnet Positionseröffnungspunkt
Скрипт собирает размеры всех ценовых волн на текущем графике, которые не меньше заданной величины, и сохраняет их в CSV файл. Каждая строка таблицы будет содержать дату/время окончания волны и ее размер. Если вам нужно знать размеры волн в реальном времени, то воспользуйтесь индикатором Wave Size into ZigZag , Wave Size Histogram  или ZZ Histogram . ПАРАМЕТРЫ MinWaveSize:  минимальный размер дял волн, которые попадут в статистику PositiveValues:   true  - в файл сохраняется только размер волны
Käufer dieses Produkts erwarben auch
Gann Made Easy
Oleg Rodin
4.8 (116)
Gann Made Easy ist ein professionelles und einfach zu bedienendes Forex-Handelssystem, das auf den besten Handelsprinzipien unter Verwendung der Theorie von Mr. basiert. W.D. Gann. Der Indikator liefert genaue KAUF- und VERKAUFSsignale, einschließlich Stop-Loss- und Take-Profit-Levels. Mit PUSH-Benachrichtigungen können Sie auch unterwegs handeln. Bitte kontaktieren Sie mich nach dem Kauf! Ich werde meine Handelstipps und tolle Bonusindikatoren kostenlos mit Ihnen teilen! Wahrscheinlich haben Si
Enigmera
Ivan Stefanov
5 (7)
ENIGMERA: Der Kern des Marktes Wichtig: Die MQL5.com-Demo wird im Strategy Tester ausgeführt und spiegelt möglicherweise nicht vollständig die Funktionalität von Enigmera wider. Überprüfen Sie die Beschreibung, Screenshots und das Video für Details. Zögern Sie nicht, mir bei Fragen eine Nachricht zu senden! Der Code des Indikators wurde vollständig neu geschrieben. Version 3.0 fügt neue Funktionen hinzu und behebt Fehler, die seit der Einführung des Indikators aufgetreten sind. Einführung Dies
M1 Arrow
Oleg Rodin
5 (17)
Eine Intraday-Strategie, die auf zwei Grundprinzipien des Marktes basiert. Der Algorithmus basiert auf der Analyse von Volumina und Preiswellen mit zusätzlichen Filtern. Der intelligente Algorithmus des Indikators gibt nur dann ein Signal, wenn sich zwei Marktfaktoren zu einem vereinen. Der Indikator berechnet Wellen eines bestimmten Bereichs auf dem M1-Diagramm unter Verwendung der Daten des höheren Zeitrahmens. Und um die Welle zu bestätigen, verwendet der Indikator eine Volumenanalyse. Dieser
Scalper Inside PRO
Alexey Minkov
4.76 (63)
!SPECIAL SALE! An exclusive indicator that utilizes an innovative algorithm to swiftly and accurately determine the market trend. The indicator automatically calculates opening, closing, and profit levels, providing detailed trading statistics. With these features, you can choose the most appropriate trading instrument for the current market conditions. Additionally, you can easily integrate your own arrow indicators into Scalper Inside Pro to quickly evaluate their statistics and profitability
Ich präsentiere Ihnen den hervorragenden technischen Indikator Grabber, der als eine vollständig einsatzbereite „All-Inclusive“-Handelsstrategie funktioniert. In einem einzigen Code sind leistungsstarke Werkzeuge zur technischen Marktanalyse, Handelssignale (Pfeile), Alarmfunktionen und Push-Benachrichtigungen integriert. Jeder Käufer dieses Indikators erhält zusätzlich kostenlos: Grabber Utility: ein Tool zur automatischen Verwaltung offener Orders Schritt-für-Schritt-Videoanleitung: wie man de
Dynamic Forex28 Navigator
Bernhard Schweigert
5 (5)
Dynamic Forex28 Navigator – Das Forex-Handelstool der nächsten Generation AKTUELL 49 % RABATT. Dynamic Forex28 Navigator ist die Weiterentwicklung unserer seit langem beliebten Indikatoren und vereint die Leistung von drei in einem: Advanced Currency Strength28 Indicator (695 Bewertungen) + Advanced Currency IMPULSE mit ALERT (520 Bewertungen) + CS28 Combo Signals (Bonus) Details zum Indikator https://www.mql5.com/en/blogs/post/758844 Was bietet der Strength Indicator der nächsten Generation?
Scalper Vault
Oleg Rodin
5 (29)
Scalper Vault ist ein professionelles Scalping-System, das Ihnen alles bietet, was Sie für erfolgreiches Scalping benötigen. Dieser Indikator ist ein komplettes Handelssystem, das von Forex- und Binäroptionshändlern verwendet werden kann. Der empfohlene Zeitrahmen ist M5. Das System liefert Ihnen genaue Pfeilsignale in Richtung des Trends. Es liefert Ihnen auch Top- und Bottom-Signale und Gann-Marktniveaus. Die Indikatoren bieten alle Arten von Warnungen, einschließlich PUSH-Benachrichtigungen.
FX Volume
Daniel Stein
4.59 (34)
FX Volume: Erleben Sie den echten Marktüberblick aus der Sicht eines Brokers Kurzüberblick Möchten Sie Ihre Handelsstrategie auf das nächste Level bringen? FX Volume liefert Ihnen Echtzeit-Einblicke in die Positionierung von Retail-Tradern und Brokern — lange bevor verzögerte Berichte wie der COT verfügbar sind. Ob Sie nach beständigen Gewinnen streben oder einfach einen tieferen Vorteil am Markt suchen, FX Volume hilft Ihnen, große Ungleichgewichte zu erkennen, Breakouts zu bestätigen und Ihr
Golden Trend Indicator
Noha Mohamed Fathy Younes Badr
4.9 (10)
Golden Trend indicator  is The best indicator for predicting trend movement this indicator never lags and never repaints and never back paints    and give  arrow buy and sell    before the candle appear  and it will help you and  will make your trading decisions clearer its work on all currencies and  gold and crypto and all time frame This unique  indicator uses very secret algorithms to catch the  trends, so you can trade using this indicator and see the trend clear on charts  manual guide and
FX Power MT4 NG
Daniel Stein
4.94 (18)
FX Power: Analysieren Sie die Stärke von Währungen für intelligentere Handelsentscheidungen Übersicht FX Power ist Ihr unverzichtbares Werkzeug, um die tatsächliche Stärke von Währungen und Gold unter allen Marktbedingungen zu verstehen. Indem Sie starke Währungen kaufen und schwache verkaufen, vereinfacht FX Power Ihre Handelsentscheidungen und deckt Chancen mit hoher Wahrscheinlichkeit auf. Ob Sie Trends folgen oder extreme Delta-Werte nutzen, um Umkehrungen zu prognostizieren, dieses Tool p
- Lifetime update free Contact me for instruction, add group and any questions! Related Products:  Bitcoin Expert , Gold Expert - Non-repaint - I just sell my products in Elif Kaya profile, any other websites are stolen old versions, So no any new updates or support. Introduction The breakout and retest strategy is traded support and resistance levels. it involves price breaking through a previous level.  The break and retest strategy is designed to help traders do two main things, the first is
Algo Pumping MT4
Ihor Otkydach
5 (2)
PUMPING STATION – Ihre persönliche „All-inclusive“-Strategie Wir präsentieren Ihnen PUMPING STATION – einen revolutionären Forex-Indikator, der Ihr Trading in eine spannende und effektive Erfahrung verwandeln wird. Es handelt sich nicht nur um ein Hilfsmittel, sondern um ein vollwertiges Handelssystem mit leistungsstarken Algorithmen, die Ihnen helfen, stabiler zu traden. Beim Kauf dieses Produkts erhalten Sie KOSTENLOS: Exklusive Set-Dateien: Für automatische Einrichtung und maximale Leistung.
Easy Breakout
Mohamed Hassan
5 (10)
After your purchase, feel free to contact me for more details on how to receive a bonus indicator called VFI, which pairs perfectly with Easy Breakout for enhanced confluence!   Easy Breakout is a powerful price action trading system built on one of the most popular and widely trusted strategies among traders: the Breakout strategy ! This indicator delivers crystal-clear Buy and Sell signals based on breakouts from key support and resistance zones. Unlike typical breakout indicators, it levera
TPSproTREND PrO
Roman Podpora
4.68 (25)
VERSION MT5        —        ИНСТРУКЦИЯ RUS           —        INSTRUCTIONS  ENG Hauptfunktionen: Präzise Eingangssignale OHNE RENDERING! Wenn ein Signal erscheint, bleibt es relevant! Dies ist ein wichtiger Unterschied zu Redraw-Indikatoren, die ein Signal liefern und es dann ändern können, was zu einem Verlust des eingezahlten Geldes führen kann. Jetzt können Sie mit größerer Wahrscheinlichkeit und Genauigkeit in den Markt eintreten. Es gibt auch eine Funktion zum Einfärben der Kerzen nach de
Gold Venamax MT4
Sergei Linskii
5 (1)
Gold Venamax   – das ist der beste technische Indikator für Aktien. Der Indikatoralgorithmus analysiert die Preisbewegung eines Vermögenswerts und spiegelt die Volatilität und potenzielle Einstiegszonen wider. Indikatorfunktionen: Dies ist ein Super-Indikator mit Magic und zwei Blöcken von Trendpfeilen für komfortables und profitables Trading. Auf dem Diagramm wird eine rote Schaltfläche zum Wechseln von Blöcken angezeigt. Magic ist in den Indikatoreinstellungen eingestellt, sodass Sie den Indi
Volatility Trend System – ein Handelssystem, das Signale für Einstiege gibt. Das Volatilitätssystem liefert lineare und punktuelle Signale in Richtung des Trends sowie Signale zum Verlassen des Trends, ohne Neuzeichnung und Verzögerungen. Der Trendindikator überwacht die Richtung des mittelfristigen Trends, zeigt die Richtung und deren Änderung an. Der Signalindikator basiert auf Änderungen der Volatilität und zeigt Markteintritte an. Der Indikator ist mit mehreren Arten von Warnungen ausgestat
Derzeit 20% Rabatt! Die beste Lösung für jeden Neueinsteiger oder Expert Händler! Dieses Dashboard arbeitet mit 28 Währungspaaren. Es basiert auf 2 unserer Hauptindikatoren (Advanced Currency Strength 28 und Advanced Currency Impulse). Es bietet einen hervorragenden Überblick über den gesamten Forex-Markt. Es zeigt die Werte der Advanced Currency Strength, die Veränderungsrate der Währungen und die Signale für 28 Devisenpaare in allen (9) Zeitrahmen. Stellen Sie sich vor, wie sich Ihr Handel
Lux Trend
Mohamed Hassan
5 (3)
After purchase, please contact me to get your trading tips + more information for a great bonus!   Lux Trend is a professional strategy based on using Higher Highs and Lower Highs to identify and draw Trendline Breakouts! Lux Trend  utilizes two Moving Averages to confirm the overall trend direction before scanning the market for high-quality breakout opportunities, ensuring more accurate and reliable trade signals. This is a proven trading system used by real traders worldwide, demonstrating
TPSpro RFI Levels
Roman Podpora
4.85 (27)
ANWEISUNGEN    Russland -    ENG    Die Empfehlung basiert auf dem Indikator -   TPSpro   TREND PRO -   Version MT5 Weitere Funktionen: Отображения зон продавцов и покупателей! Die Anzeige zeigt bei Kauf und Verkauf alle üblichen Impulse/Zonen an. Bei der Aktivierung dieser Uhr/Zone wird nach Ablauf der Frist die Anzahl der Blumen geändert und die Zahlung von Blumen erfolgt. Dies sind nur wenige Schritte für mehr intuitive Sprachumgebungen. LOGIC AI – Die Funktion „Logic AI“ ist für die Aktivie
Introduction to X3 Chart Pattern Scanner X3 Cherart Pattern Scanner is the non-repainting and non-lagging indicator detecting X3 chart patterns including Harmonic pattern, Elliott Wave pattern, X3 patterns, and Japanese Candlestick patterns. Historical patterns match with signal patterns. Hence, you can readily develop the solid trading strategy in your chart. More importantly, this superb pattern scanner can detect the optimal pattern of its kind. In addition, you can switch on and off individu
Currency Strength Wizard ist ein sehr leistungsstarker Indikator, der Ihnen eine Komplettlösung für erfolgreichen Handel bietet. Der Indikator berechnet die Stärke dieses oder jenes Forex-Paares anhand der Daten aller Währungen in mehreren Zeitrahmen. Diese Daten werden in Form von benutzerfreundlichen Währungsindizes und Währungsstärkelinien dargestellt, anhand derer Sie die Stärke dieser oder jener Währung erkennen können. Sie müssen lediglich den Indikator an das Diagramm anhängen, mit dem Si
Gold Trend   - dies ist ein guter technischer Indikator für Aktien. Der Algorithmus des Indikators analysiert die Preisbewegung eines Vermögenswerts und spiegelt die Volatilität und mögliche Einstiegszonen wider. Die besten Indikatorsignale: - Für VERKAUFEN = rotes Histogramm + roter SHORT-Zeiger + gelber Signalpfeil in dieselbe Richtung. - Für KAUFEN = blaues Histogramm + blauer LONG-Zeiger + aquafarbener Signalpfeil in dieselbe Richtung. Vorteile des Indikators: 1. Der Indikator erzeugt
Supply Demand Analyzer
Suvashish Halder
5 (6)
Supply Demand Analyzer is an advanced trading indicator meticulously designed for the precise identification, analysis, and management of supply and demand zones. By integrating real-time data and advanced algorithms, this tool enables traders to recognize market phases, price movements, and structural patterns with unparalleled accuracy. It simplifies complex market dynamics into actionable insights, empowering traders to anticipate market behavior, identify trading opportunities, and make info
DERZEIT 31% RABATT! Die beste Lösung für jeden Newbie oder Expert Trader! Dieser Indikator ist ein einzigartiges, qualitativ hochwertiges und erschwingliches Handelsinstrument, da wir eine Reihe von proprietären Funktionen und eine geheime Formel eingebaut haben. Mit nur EINEM Chart liefert er Alerts für alle 28 Währungspaare. Stellen Sie sich vor, wie sich Ihr Handel verbessern wird, weil Sie in der Lage sind, den genauen Auslösepunkt eines neuen Trends oder einer Scalping-Gelegenheit zu erk
Apollo BuySell Predictor ist ein professionelles Handelssystem, das mehrere Handelsmodule umfasst. Es bietet einem Trader einzigartige Breakout-Zonen, Fibonacci-basierte Unterstützungs- und Widerstandsniveaus, Pivot-Trendlinie, Pullback-Volumensignale und andere hilfreiche Funktionen, die jeder Trader täglich benötigt. Das System funktioniert mit jedem Paar. Empfohlene Zeitrahmen sind M30, H1, H4. Der Indikator kann jedoch auch mit anderen Zeitrahmen arbeiten, mit Ausnahme der Zeitrahmen höher a
Linear Trend Predictor – Ein Trendindikator, der Einstiegspunkte und Richtungsunterstützungslinien kombiniert. Funktioniert nach dem Prinzip des Durchbrechens des Hoch-/Tiefpreiskanals. Der Indikatoralgorithmus filtert Marktrauschen und berücksichtigt Volatilität und Marktdynamik. Indikatorfunktionen  Mithilfe von Glättungsmethoden zeigt es den Markttrend und Einstiegspunkte zum Öffnen von Kauf- oder Verkaufsaufträgen an.  Geeignet zum Bestimmen kurzfristiger und langfristiger Marktbewegungen
Best Currency Strength Indicator
Tumelo Patrick Rakotsoane
4.5 (46)
Advanced Currency Strength Indicator The Advanced Divergence Currency Strength Indicator. Not only it breaks down all 28 forex currency pairs and calculates the strength of individual currencies across all timeframes , but, You'll be analyzing the WHOLE forex market in 1 window (In just 1 minute) . This indicator is very powerful because it reveals the true movements of the market.  It is highly recommended to  analyze charts knowing the performance of individual currencies or the countries eco
FX Levels MT4
Daniel Stein
5 (2)
FX Levels: Außerordentlich präzise Unterstützungs- und Widerstandszonen für alle Märkte Kurzüberblick Suchen Sie eine verlässliche Methode, um Support- und Resistance-Level in jedem Markt zu identifizieren—egal ob Währungspaare, Indizes, Aktien oder Rohstoffe? FX Levels vereint die traditionelle „Lighthouse“-Methode mit einem modernen dynamischen Ansatz und bietet nahezu universelle Genauigkeit. Durch unsere Erfahrung mit echten Brokern sowie automatischen täglichen und Echtzeit-Updates hilft
Probieren Sie "Chart Patterns All in One" im Demo-Modus aus und erhalten Sie einen Bonus. Senden Sie mir eine Nachricht, nachdem Sie es im Demo-Modus getestet haben, um Ihren Bonus zu erhalten. Hinterlassen Sie nach dem Kauf einen Kommentar, um 8 hochwertige Indikatoren als Bonus zu erhalten. Der Chart Patterns All-in-One Indikator hilft Tradern, verschiedene Chartmuster, die häufig in der technischen Analyse verwendet werden, zu visualisieren. Dieser Indikator unterstützt die Identifizierung m
Top Bottom Tracker ist ein auf hochentwickelten Algorithmen basierender Indikator, der den Markttrend analysiert und die Hochs und Tiefs des Trends erkennen kann / MT5 Version . Der Preis wird schrittweise steigen, bis er 500$ erreicht. Nächster Preis --> $99 Eigenschaften Kein Repainting Dieser Indikator ändert seine Werte nicht, wenn neue Daten eintreffen Handelspaare Alle Forex-Paare Zeitrahmen Alle Zeitrahmen Parameter ==== Indikator-Konfiguration ==== Konfigurationsparameter //
Weitere Produkte dieses Autors
Trend Screener Pro MT5
STE S.S.COMPANY
4.85 (79)
Nutzen Sie die Macht des Trendhandels mit Trend Screener Indicator: Ihrer ultimativen Trendhandelslösung, die auf Fuzzy-Logik und einem System mit mehreren Währungen basiert! Steigern Sie Ihren Trendhandel mit Trend Screener, dem revolutionären Trendindikator mit Fuzzy-Logik. Es handelt sich um einen leistungsstarken Trendfolgeindikator, der über 13 Premium-Tools und -Funktionen sowie 3 Handelsstrategien kombiniert und ihn zu einer vielseitigen Wahl macht, um Ihren Metatrader in einen Trendanaly
Support And Resistance Screener ist ein Level-Indikator für MetaTrader, der mehrere Tools innerhalb eines Indikators bietet. Die verfügbaren Werkzeuge sind: 1. Marktstruktur-Screener. 2. Bullische Pullback-Zone. 3. Bärische Pullback-Zone. 4. Tägliche Pivot-Punkte 5. wöchentliche Pivots-Punkte 6. monatliche Pivots-Punkte 7. Starke Unterstützung und Widerstand basierend auf harmonischem Muster und Volumen. 8. Zonen auf Bankebene. ZEITLICH BEGRENZTES ANGEBOT: HV Support and Resistance Indicator ist
Trend Line Map Pro MT5
STE S.S.COMPANY
4.09 (11)
Trend Line Map Indicator ist ein Add-On für Trend Screener Indicator. Es arbeitet als Scanner für alle Signale, die vom Trendscreener (Trendliniensignale) erzeugt werden. Es ist ein Trend Line Scanner basierend auf dem Trend Screener Indicator. Wenn Sie keinen Trend Screener Pro Indicator haben, funktioniert die Trend Line Map Pro nicht. It's a Trend Line Scanner based on Trend Screener Indicator. If you don't have Trend Screener Pro Indicator,     the Trend Line Map Pro will not work . Wen
Support Resistance screnner
STE S.S.COMPANY
4.94 (36)
Support And Resistance Screener ist ein Level-Indikator für MetaTrader, der mehrere Tools innerhalb eines Indikators bietet. Die verfügbaren Werkzeuge sind: 1. Marktstruktur-Screener. 2. Bullische Pullback-Zone. 3. Bärische Pullback-Zone. 4. Tägliche Pivot-Punkte 5. wöchentliche Pivots-Punkte 6. monatliche Pivots-Punkte 7. Starke Unterstützung und Widerstand basierend auf harmonischem Muster und Volumen. 8. Zonen auf Bankebene. ZEITLICH BEGRENZTES ANGEBOT: HV Support and Resistance Indicator ist
Trend Line Map Pro
STE S.S.COMPANY
4.47 (15)
Trend Line Map Indicator ist ein Add-On für Trend Screener Indicator . Es arbeitet als Scanner für alle Signale, die vom Trendscreener (Trendliniensignale) erzeugt werden. Es ist ein Trend Line Scanner basierend auf dem Trend Screener Indicator. Wenn Sie keinen Trend Screener Pro Indicator haben, funktioniert die Trend Line Map Pro nicht. Wenn Sie auf unseren MQL5-Blog zugreifen, können Sie die kostenlose Version des Trend Line Map-Indikators herunterladen. Probieren Sie es aus, bevor Sie e
Currency Strength Meter, gibt Ihnen einen schnellen visuellen Überblick darüber, welche Währungen derzeit stark und welche schwach sind. Das Messgerät misst die Stärke aller Forex-Kreuzpaare und wendet Berechnungen an, um die Gesamtstärke für jede einzelne Währung zu bestimmen. Wir berechnen die Stärke der Währung basierend auf dem Trend von 28 Paaren. Wenn Sie auf unseren MQL5-Blog zugreifen, können Sie die kostenlose Version des Indikators herunterladen. Probieren Sie es aus, bevor Sie es
Jeder Trader weiß, dass er oder sie nie mehr als 5 % (oder 7 %) pro Trade riskieren sollte. Dies ist ein Money-Management-Gesetz und es sollte jedes Mal eine brauchbare LotSize berechnet werden, da ein Trader für verschiedene Trading-Levels einen anderen StopLoss-Wert verwenden muss. Dieser Indikator berechnet eine angemessene LotSize für den Moment, in dem Sie ihn auf das Diagramm setzen und jedes Mal, wenn Sie die „Stop-Loss-Linie“ in eine beliebige Richtung ziehen. ZEITLICH BEGRENZTES ANGE
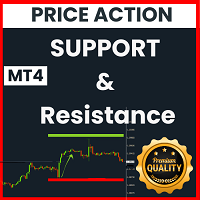
Unsere Unterstützungs- oder Widerstandsniveaus werden gebildet, wenn sich die Preisbewegung eines Marktes umkehrt und die Richtung ändert und einen Höchst- oder Tiefpunkt (Swing Point) im Markt hinterlässt. Unterstützungs- und Widerstandsniveaus können Handelsspannen ausmachen. Der Indikator identifiziert das Swing High und Swing Low basierend auf der Anzahl von X Balken (Periode), die im Indikatorsatz definiert sind. Hinweis: Wenn Ihnen unser Preisaktionsindikator gefällt, probieren Sie unser
FREE
Der Boom and Crash Spike Detector Indikator ist basierend auf einer fortschrittlichen Strategie kodiert, hauptsächlich um den Boom und Crash in den Preisen zu erkennen. Komplexe Algorithmen wurden implantiert, um Booms und Crashs mit hoher Wahrscheinlichkeit in den Preisen zu erkennen. Es warnt vor möglichen Boom- oder Crash-Phasen: Boom-Phase: Wenn der Preis zu schnell steigt. Crash-Phase: Wenn der Preis zu schnell sinkt. ZEITLICH BEGRENZTES ANGEBOT: Der Indikator ist für nur 30 $ und lebensl
Der Volatilitätsanalysator ist ein Momentum-Indikator, der von der Tendenz profitiert, dass der Preis nach der Konsolidierung in einer engen Handelsspanne stark ausbricht. Der Indikator verwendet auch einen Momentum-Oszillator, um die erwartete Richtung der Bewegung anzuzeigen, wenn der Squeeze ausgelöst wird. Dieses Histogramm oszilliert um die Nulllinie, ein steigendes Momentum über der Nulllinie zeigt eine Gelegenheit zum Long-Kauf an, während ein Momentum, das unter die Nulllinie fällt, ein
Currency Strength Meter, gibt Ihnen einen schnellen visuellen Überblick darüber, welche Währungen derzeit stark und welche schwach sind. Das Messgerät misst die Stärke aller Forex-Kreuzpaare und wendet Berechnungen an, um die Gesamtstärke für jede einzelne Währung zu bestimmen. Wir berechnen die Stärke der Währung basierend auf dem Trend von 28 Paaren. Wenn Sie auf unseren MQL5-Blog zugreifen, können Sie die kostenlose Version des Indikators herunterladen. Probieren Sie es aus, bevor Sie es
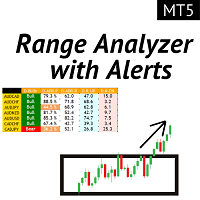
Die Average Daily Range zeigt die durchschnittliche Pip-Range eines Forex-Paares, gemessen über eine bestimmte Anzahl von Perioden. Händler können die ADR verwenden, um potenzielle Kursbewegungen außerhalb der durchschnittlichen täglichen Bewegung zu visualisieren. Wenn die ADR über dem Durchschnitt liegt, bedeutet dies, dass die tägliche Volatilität höher als üblich ist, was bedeutet, dass das Währungspaar möglicherweise über seine Norm hinausgeht. Unser ADR-Analysator besteht aus 5 Hauptfunk
Der Volatilitätsanalysator ist ein Momentum-Indikator, der von der Tendenz profitiert, dass der Preis nach der Konsolidierung in einer engen Handelsspanne stark ausbricht. Der Indikator verwendet auch einen Momentum-Oszillator, um die erwartete Richtung der Bewegung anzuzeigen, wenn der Squeeze ausgelöst wird. Dieses Histogramm oszilliert um die Nulllinie, ein steigendes Momentum über der Nulllinie zeigt eine Gelegenheit zum Long-Kauf an, während ein Momentum, das unter die Nulllinie fällt, ein
Die Average Daily Range zeigt die durchschnittliche Pip-Range eines Forex-Paares, gemessen über eine bestimmte Anzahl von Perioden. Händler können die ADR verwenden, um potenzielle Kursbewegungen außerhalb der durchschnittlichen täglichen Bewegung zu visualisieren. Wenn die ADR über dem Durchschnitt liegt, bedeutet dies, dass die tägliche Volatilität höher als üblich ist, was bedeutet, dass das Währungspaar möglicherweise über seine Norm hinausgeht. Unser ADR-Analysator besteht aus 5 Hauptfunk
Jeder Trader weiß, dass er oder sie nie mehr als 5 % (oder 7 %) pro Trade riskieren sollte. Dies ist ein Money-Management-Gesetz und es sollte jedes Mal eine brauchbare LotSize berechnet werden, da ein Trader für verschiedene Trading-Levels einen anderen StopLoss-Wert verwenden muss. Dieser Indikator berechnet eine angemessene LotSize für den Moment, in dem Sie ihn auf das Diagramm setzen und jedes Mal, wenn Sie die „Stop-Loss-Linie“ in eine beliebige Richtung ziehen. ZEITLICH BEGRENZTES ANGE
Der Boom and Crash Spike Detector Indikator ist basierend auf einer fortschrittlichen Strategie kodiert, hauptsächlich um den Boom und Crash in den Preisen zu erkennen. Komplexe Algorithmen wurden implantiert, um Booms und Crashs mit hoher Wahrscheinlichkeit in den Preisen zu erkennen. Es warnt vor möglichen Boom- oder Crash-Phasen: Boom-Phase: Wenn der Preis zu schnell steigt. Crash-Phase: Wenn der Preis zu schnell sinkt. ZEITLICH BEGRENZTES ANGEBOT: Der Indikator ist für nur 30$ und lebensla
Auswahl:
kourtfx
32
kourtfx 2025.02.15 12:20 
 

Amazing Indicator! If you know what your doing then this Indicator will be very helpful. And the Seller is a very honest and good man. Thanks for creating this Indicator!

STE S.S.COMPANY
295740
Antwort vom Entwickler Sayadi Achraf 2025.02.16 20:22
Thank you for your wonderful review! I'm thrilled to hear that you find the indicator both amazing and helpful. Your kind words about my honesty and dedication truly mean a lot. I'm grateful for your support, and I'm committed to continuing to improve the tool to help you succeed. Thanks again for your feedback!
jabri7
22
jabri7 2025.02.15 12:07 
 

I would give this indicator 10 stars if I could! For the past 7 months, it's been a game-changer in identifying trending currency pairs with the trend CSM. Previously, spotting trends across 28 pairs was a real challenge. Now, I can quickly identify strong trends and reversals. This system has truly transformed my trading, leading to noticeable success. I took a chance based on the positive reviews, and I'm so glad I did. Sayadi is incredibly responsive to questions. In fact, I've been so impressed that I'm getting the support and resistance screener indicator now. Thank you.

STE S.S.COMPANY
295740
Antwort vom Entwickler Sayadi Achraf 2025.02.16 20:24
Thank you for such an enthusiastic review! I'm thrilled to hear that the indicator has been satisfied by using our indicator over the past 7 months. It’s fantastic to know that it’s simplified identifying strong trends and reversals across multiple currency pairs, transforming your trading experience. Your trust and positive feedback mean the world to me, and I'm glad my support has been helpful. I'm excited for you to try out the support and resistance screener indicator too—here's to even more trading success!
bangi4826
396
bangi4826 2025.01.28 22:25 
 

I like that it is easy to check currency movements. It may take some people some time to get used to using it, but I think it's a good product.

STE S.S.COMPANY
295740
Antwort vom Entwickler Sayadi Achraf 2025.01.29 10:48
Thank you for your feedback! We're glad to hear that you find it easy to check currency movements with our tool. I'm happy to know that you found our indicator as a good indicator. Thank you for choosing our indicators. We understand that there may be a learning curve for some users, and we appreciate your patience as you get accustomed to it. Trend Screener is a truly all-in-one trend indicator that offers a wide range of features in a single tool. Integrating more than 15 features to work simultaneously is no simple task, but Trend Screener achieves it seamlessly.
neo.kley.bln
73
neo.kley.bln 2025.01.28 16:59 
 

Positive Review of the Trend Screener Indicator by Sayadi Achraf: In contrast, the Trend Screener Indicator by Sayadi Achraf is a real game-changer. It provides clear and reliable analysis, helping traders identify genuine trends in the market without unnecessary noise. Its user-friendliness and transparency make it stand out from everything else available. The focus is on empowering traders to make their own informed decisions rather than relying blindly on signals or automated programs. It consistently performs well under all market conditions and gives clear, easy-to-understand insights – a must-have for any serious trader.

STE S.S.COMPANY
295740
Antwort vom Entwickler Sayadi Achraf 2025.01.29 10:43
Thank you for your positive review and for recognizing the value of the Trend Screener Indicator by Sayadi Achraf! We’re thrilled to hear that you find it a game-changer in market analysis. Our goal has always been to provide traders with clear, reliable, and noise-free insights to help them make informed decisions with confidence. Your feedback reinforces our commitment to user-friendliness, transparency, and consistent performance across all market conditions. We truly appreciate your support and trust in our tool. Wishing you continued success in your trading journey!
Nelson Belchior
1239
Nelson Belchior 2024.11.13 10:00 
 

Very good indicator. It´s very reliable, although the higher the timeframe, higher is the winrate. One tip, if the owner can, it would be better to use a winrate statistic of each pair in order to see the past results.

STE S.S.COMPANY
295740
Antwort vom Entwickler Sayadi Achraf 2024.11.13 10:21
Thank you for your feedback! I'm glad you find the indicator reliable. I agree that higher timeframes often yield a better win rate due to market stability. Your suggestion of adding win rate statistics for each pair to analyze past results is excellent and would be beneficial for refining trading strategies. Personally, I always prefer trading during the most trending moments, and I use a trailing stop to stay aligned with market movements during strong trends. Here’s a potential money management plan you can consider: For a trade size of 0.1 lot, you can split it into two positions: Position 1: 0.05 lot with a take profit at a 1:1 risk/reward ratio based on the stop loss, with the stop loss set at the swing low/high.
Position 2: 0.05 lot with an open take profit, using a trailing stop to maximize gains. You can exit this position when reversal dots appear. Happy trading, and thank you for sharing your experience and insights!
tridars
22
tridars 2024.10.04 01:04 
 

Good Indicator, Author so helpfull and understanding.

STE S.S.COMPANY
295740
Antwort vom Entwickler Sayadi Achraf 2024.10.28 17:06
Thank you for your kind words! I'm thrilled to hear that you're finding the indicator helpful and appreciate the support. It's always my pleasure to assist and ensure you get the most out of the tools. Wishing you successful trading ahead!
2481695
19
2481695 2024.09.30 16:48 
 

Der Benutzer hat keinen Kommentar hinterlassen

STE S.S.COMPANY
295740
Antwort vom Entwickler Sayadi Achraf 2024.09.30 17:20
Hi sir, Thank you for taking the time to write your review about our indicator. I'm sending you now ASAP a message to assist you how to install our trend indicator.
-- Best regards.
Sayadi Ashref.
temcclain78
24
temcclain78 2024.09.11 16:35 
 

This outstanding product has been a game changer! In July, I bought the Trend Screener and the Trend Line Map Pro for $100 USD all together, signed up for a $200K challenge, and 6 days later I passed the challenge. August brought a market shift. So my honest recommendation, have a reliable trend based strategy already so you will know WHAT to look for. Buy the products so you will know WHERE and WHEN to look. I downloaded some free technical indicators to build my current strategy based on M1 (heads up), M5 (entry and exit), and M15 (overall trend). I have all 3 timeframes open when analysing and trading. The addition of the Trend Screener's analysis on all timeframes, and the Fuzzy Logic, make it a must have for me. The strongest trends, and best trades, happen when more timeframes align in that direction. The Trend Screener shows me what I am missing and makes Top Down Analysis quicker. These products have been the missing piece to the puzzle of trading for me / my "Aha moment". Although I'm a day trader, in July the Trend Line Map Pro made me want to become a swing trader. It gave an NZD alert based on the H4, and I placed my entries based on how I trade the lower timeframes. I placed my Take Profit based on H4 levels and saw amazing profit.

STE S.S.COMPANY
295740
Antwort vom Entwickler Sayadi Achraf 2024.09.12 16:14
Thank you for sharing your detailed experience with the Trend Screener and Trend Line Map Pro! It's fantastic to hear how these tools have been game changers for you, especially with your successful $200K challenge result in just 6 days! Your strategy of combining multiple timeframes—M1 for a heads up, M5 for entry and exit, and M15 for the overall trend—alongside the Trend Screener's multi-timeframe analysis, sounds like a solid approach to making informed trading decisions. I appreciate your honest advice about having a reliable trend-based strategy beforehand to maximize the benefits of these products. It's clear that the combination of the Trend Screener, Fuzzy Logic, and the Top Down Analysis has really helped streamline your process and provided that "Aha moment" in your trading journey. It's also inspiring to hear how the Trend Line Map Pro prompted you to explore swing trading opportunities with such great results. Thanks again for the valuable insights—this is very helpful for other traders considering these tools!
Matthew Nathan Brooks
199
Matthew Nathan Brooks 2024.09.04 19:24 
 

This is an amazing indicator. ive used it for 2 weeks on a demo on Gold and the results have been amazing. it took a couple days to get the setting right. but since then its been the best, will try on a demo for another 2 weeks. having a small issue with notification not coming to my phone all the time but thats not a big deal for me..

STE S.S.COMPANY
295740
Antwort vom Entwickler Sayadi Achraf 2024.09.12 16:14
Thank you for your feedback! I'm glad to hear that you're having such a great experience with the indicator on your demo account with Gold. It’s awesome to know that once you fine-tuned the settings, it’s been delivering amazing results for you! As for the notification issue, we appreciate you bringing it to our attention. We'll definitely look into that to ensure a smoother experience. It’s great to see that it hasn’t been a major inconvenience for you, and I hope your continued testing over the next couple of weeks brings even more positive outcomes. Thanks again for sharing your experience!
waqarqureshi1
94
waqarqureshi1 2024.08.05 14:25 
 

Amazing

STE S.S.COMPANY
295740
Antwort vom Entwickler Sayadi Achraf 2024.08.05 15:03
Thank you for taking the time to write your review, sir. My customer satisfaction is always our top priority.
Nagib Mahfuj Nayem
38
Nagib Mahfuj Nayem 2024.08.02 18:27 
 

This is really Insane. I just used only one week but more than 500 pips made with this indicator with only GOLD. And his support is really top notch. 100% Recommended.

STE S.S.COMPANY
295740
Antwort vom Entwickler Sayadi Achraf 2024.08.02 18:29
Hi Mr. Nayem, Thank you for taking the time to write your review of our trend indicator. Since 2020, we have been committed to offering the best trend indicator for our customers, making MetaTrader a true trend analyzer. Wishing you good and safe trading!
Gimel Abayon Roda
343
Gimel Abayon Roda 2024.07.16 07:07 
 

I have been using this indicator to analyze the market trend. The dashboard is very useful in identifying the overall market direction. The CSM trend is useful in identifying the strong, weak and ranging currencies. I am using this in 15min timeframe. Though not recommended by the seller to use it in timeframes lower than 30mins, the indicator can still help generate positive pips, especially when you use it with support and resistance indicator.

STE S.S.COMPANY
295740
Antwort vom Entwickler Sayadi Achraf 2024.07.16 12:20
Thank you for taking the time to write your review MR. Gimel. Since 2020, we have been working hard to keep improving our indicator to offer our customers the best indicator in the market to analyze market trends via many features. I invite you to check the list of all our free and premium indicators here: https://www.mql5.com/en/users/sayadi_lancer/seller
sami57
119
sami57 2024.07.08 23:04 
 

this is the best indicator i use

STE S.S.COMPANY
295740
Antwort vom Entwickler Sayadi Achraf 2024.07.10 13:32
Thank you for taking the time to write your review MR. Sami. We are here to offer all the necessary support for our customers. Since 2020, we have been working hard to keep improving our indicator to offer our customers the best indicator in the market to analyze market trends via many features. I invite you to check all the list of all our free and premium indicators here : https://www.mql5.com/en/users/sayadi_lancer/seller
fatambouzid
58
fatambouzid 2024.05.16 01:35 
 

This is one of the best indicators I have seen ! Multitimeframe trend analysis for selected currency pairs, with a clear trend summary information; currency strength information, plus a trend simulator so you can verify and set your expectations right in terms of TP that is proven by historical signals and success rate statistics, etc. I am using both MT5 and MT4 versions of the indicator as the main signal source for all my trades with a very high success rate for a a week now. From one single chart I have clear visibility to the current market conditions.

Leroy Pastran
437
Leroy Pastran 2024.05.15 18:57 
 

Great HTF Trend Tool! Thanks for creating this system!

Erik
169
Erik 2024.03.25 10:10 
 

I haven't tested the indicator properly yet. But I give 3 stars for the great support. My questions were answered in a short time. Problems were solved quickly. Excellent. The indicator itself only gave me losses.

STE S.S.COMPANY
295740
Antwort vom Entwickler Sayadi Achraf 2024.04.15 02:33
Thank you for taking the time to write your review MR. Erik. We are here to offer all the necessary support for our customers. Since 2020, we have been working hard to keep improving our indicator to offer our customers the best indicator in the market to analyze market trends via many features. I invite you to check all the list of all our free and premium indicators here : https://www.mql5.com/en/users/sayadi_lancer/seller
zakim1984
44
zakim1984 2024.03.19 02:44 
 

I'm using trend screener since a couple of months both MT4 and MT5 versions and its really a great indicator! The author also is very responsive and helpful..

STE S.S.COMPANY
295740
Antwort vom Entwickler Sayadi Achraf 2024.03.19 02:48
Thank you so much sir , for your honest review and your kind words! You dont know how happy i am really you made my day! I wish you more success in your trading! The Trend Screener is the best All-In-One Trend Indicator ! I am really glad that i help and that I could bring some positivity in you trading in general! thank you so much again!
tunsam61
32
tunsam61 2024.03.19 02:01 
 

The trend screener is one of the best indicators in the market if followed correctly. I've had the indicator for 3 days and has greatly helped my ability to predict the market. The developer has excellent customer support and always willing to go extra mile to satisfy his customers and answer any questions. I will recommend this product for anyone who is interested in making money from the financial market.

STE S.S.COMPANY
295740
Antwort vom Entwickler Sayadi Achraf 2024.03.19 02:58
Hi sir, Thank you for taking time to write your review. If you see the trend summary always Up Trend it means that you're MT4 is missing historical data. The trend summary will not give up trend for 15 instruments always. There is something wrong with the installation. I'm sending you now a private message asap to check this issue with you and assisting you to fix it and explain to you the best way to use trend screener indicator because you need to use the trend line for short terms trend and trend summary, just as a filter.
———————
Update: Can you check your private message please? I just sent you a message to assist you from there and ensure that you don’t get confused. Please let me know your feedback sir.
19990228
34
19990228 2024.02.22 14:02 
 

Der Benutzer hat keinen Kommentar hinterlassen

STE S.S.COMPANY
295740
Antwort vom Entwickler Sayadi Achraf 2024.02.22 14:13
Hi sir, Thank you for your review. I'm happy to know that you found our indicator an excellent Smart trend indicator that can assist you in analyzing the Properly market trend and improving your trade accuracy. I'm sending you now a private message to assist you from there.
burnoutnorthbowl1
55
burnoutnorthbowl1 2024.01.22 21:33 
 

I purchased this indicator only a few days ago and I can already tell it is very powerful if used correctly. Now I am going to get the map add on.

STE S.S.COMPANY
295740
Antwort vom Entwickler Sayadi Achraf 2024.01.25 21:19
Thank you soo much for the honest review and the kind words.
We are working day and night to create the best advanced and professional tools in the market. That's the goal here and we can get there only if our standards are held high and professional as well!
Please have a good and safe trading.
Antwort auf eine Rezension
Version 22.30 2025.01.31
1. Improve Buffers/Synchronization with icMarket data.
2. Improve indicator performance.
Version 22.10 2024.11.20
1. Improving signals performance in Strong down trend // Strong Up trend.
2. Fixing loading issues.
Version 22.0 2024.11.17
1. Add the Clean trend dots algorithm.
2. Add an option to customize the width of trend dots.
Version 21.20 2024.10.31
1. Improving arrow algorithm and fixing issue with last Metatrader version.
Version 21.10 2024.06.03
1. Improve signal quality.
2. Add Trend line period.
Version 20.10 2023.11.29
1. Change the Trend Scanner Layout by giving more flexibility in configuration to hide and display every column.
2. Add inputs to change timeframes for every column.
3. Optimize Trend breakout alerts and trend reversal alerts.
4. Add a period for the scanner to be adjusted for faster or slower trend calculation.
5. Change trend lines layout.
6. Optimize indicator setting.
7. Increase Scanner speed.
Version 19.21 2023.05.29
1. Fixing Spelling mistakes.
Version 19.20 2023.05.26
1. Optimize indicator speed.
2. Improve Trend CSM algorithm.
3. Improve Trend reversals dots.
4. Improve Strong Trend dots.
Version 19.3 2022.12.06
1. Improve indicator Speed for calculation with missing data.
Version 19.0 2021.08.29
1. Updating Alerts.
Version 18.1 2021.08.27
1. Adjusting signals design.
Version 18.0 2021.08.27
1. Add Strong Trend Signals.
2. Add Reversal Trend Signals.
3. Optimizing Trend Algorithm.
4. Add Scalper TP similator.
Version 16.30 2021.06.07
1. Optimizing Trend Dashboard for small timeframes.
Version 16.21 2021.05.08
1. Optimizing indicator speed.
Version 16.20 2021.04.18
1. Fixing issue with ultimate Screener EA.
Version 16.10 2021.04.18
1. Add support for Trend Screener Ultimate.
Version 16.0 2021.03.19
1. Add support to swing stoploss for Trend screener EA.
Version 15.80 2021.01.06
1. Add support to Trend Turbo EA
Version 15.60 2020.10.01
1. Add backtesting feature / Demo testing in the market.
Version 15.51 2020.08.22
1. Setting optimization.
Version 15.50 2020.08.22
1. Optimizing Suffix and prefix displaying.
Version 15.0 2020.07.29
1. Fixing the issue of Suffix / Current Chart Mode.
2. Buffers optimization for Eas.
3. Adjusting the default setting.
Version 13.0 2020.06.15
1. Fixing Fuzzy logic score issue in version 12.00.
Version 12.10 2020.06.07
Updates :

1. Add new Alert time ( GMT Or BROKER SERVER TIME or Local Computer time ).
2. Add Parameter to define Frequency of the Screener updating. ( Seconds )
3. Add Pairs manager: Display Screener based on Current Chart OR Display Screener based on Custom pairs List.
4. Hide - display button for the Success Rate Simulator.

Fixed issues :
1. Correcting button names.


Version 11.10 2020.04.18
1. Add a Spread feature.
Version 11.0 2020.04.14
1. Add enable-disable Button based on Customers requests.
Version 10.1 2020.04.09
1. Changing the default setting.
Version 10.0 2020.04.06
1. Add EAs Supporting with 3 methods.
Version 9.2 2020.04.01
1. Fixing issue with the default setting.
Version 9.1 2020.03.31
1. Optimization of Stoploss calculator.
Version 9.0 2020.03.31
1. Optimizing trend line signal.
Version 8.1 2020.03.19
1. Optimizing CSM updating timing.
2. Add enable-disable CSM.
Version 8.0 2020.03.17
1. Add Currency Strength Meter
Version 7.3 2020.03.13
1. Add Prefix and Suffix for pairs like "EURUSD.c"...etc.
Version 7.2 2020.03.10
1. Fixing display Success rate simulator.
Version 7.1 2020.03.07
1. Adjusting default colors.
Version 7.0 2020.03.07
1. Optimizing Fuzzy logic algorithm and Strong Trend identification.
2. Optimizing Alert generating in Strong Trend and Normal Trend.
3. Add feature to display trading type recommendation in Success Rate Simulator.
4. Add Max bars to Run Success Rate Simulator.
Version 6.11 2020.03.01
1. Correcting some spelling mistakes.
Version 6.10 2020.03.01
1. Add Hide-Display Second Box
Version 6.0 2020.03.01
1. Add TP levels and SL per level.
2. Add 2 options for Takeprofit
2.1 Floating TP with three Ratio.
2.2 TP simulator to find the best TP with the best success rate.
3. Add Chart change via Button in Trend Screener.
4. Optimizing button click event.
Version 5.50 2020.02.27
1. Add Arrows color feature.
Version 5.2 2020.02.26
1. Optimization refresher.
Version 5.1 2020.02.26
1. Fixing a refreshing issue.
Version 5.0 2020.02.25
1. Add max profit feature.
2. Optimizing trend line drawing.
Version 4.0 2020.02.21
1. Add Alerts Filters.
2. Add List of pairs to display all Currencies in the same charts.
3. Add metals, indices supporting.
Version 3.0 2020.02.20
1. Add symbols automatically to the MT4 MarketWatch.
Version 2.0 2020.02.16
1. Optimizing trend calculation.
2. Add Alerts features.
Version 1.70 2020.02.13
Fixing the EURUSD calculation issue.
Version 1.60 2020.02.13
1. Optimizing Fuzzy logic calculation.