• Übersicht
  • Bewertungen (41)
  • Diskussion (141)
  • Neue Funktionen

Support Resistance screnner

4.87

Support And Resistance Screener ist ein Level-Indikator für MetaTrader, der mehrere Tools innerhalb eines Indikators bietet. Die verfügbaren Werkzeuge sind:

1. Marktstruktur-Screener.

2. Bullische Pullback-Zone.

3. Bärische Pullback-Zone.

4. Tägliche Pivot-Punkte

5. wöchentliche Pivots-Punkte

6. monatliche Pivots-Punkte

7. Starke Unterstützung und Widerstand basierend auf harmonischem Muster und Volumen.

8. Zonen auf Bankebene.

ZEITLICH BEGRENZTES ANGEBOT: HV Support and Resistance Indicator ist für nur 50 $ und Lebensdauer erhältlich. ( Originalpreis 125 $ )
Möchten Sie den Indikator ohne die Metatrader Backtester-Einschränkung ausprobieren? Klicken Sie hier, um die Demoversion herunterzuladen.

Hauptmerkmale

  • Starke Unterstützungs- und Widerstandszonen basierend auf harmonischen und Volumen-Algorithmen.
  • Bullish- und Bearish-Pullback-Zonen basierend auf Harmonic- und Volume-Algorithmen.
  • Marktstruktur-Screener
  • Tägliche, wöchentliche und monatliche Pivot-Punkte.


Dokumentationen

Alle Dokumentationen zu Support und Resistance Screener ( Anweisungen ) und Strategiedetails sind in diesem Beitrag in unserem MQL5-Blog verfügbar: Klicken Sie hier.


Kontakt

Wenn Sie Fragen haben oder Hilfe benötigen, kontaktieren Sie mich per Privatnachricht.


Autor

SAYADI ACHREF , Fintech-Software-Ingenieur und Gründer von Finansya


Bewertungen 20
Simba Finance
185
Simba Finance 2024.08.02 07:48 
 

I'm using the indicator on the H1 timeframe and getting clear signals for my trading strategy with good results. Sayadi is very responsive and supportive.

amnonwr2 Waskar
164
amnonwr2 Waskar 2024.07.25 19:37 
 

very good product

cyubahiro
91
cyubahiro 2024.02.21 09:14 
 

Excellent Service and Products.

Empfohlene Produkte
Ultimate Supply Demand
Ramon Sobrevals Arce
5 (3)
After working during many months, with the help of Neural Networks, we have perfected the ultimate tool you are going to need for identifying key price levels (Supports and Resistances) and Supply and Demand zones. Perfectly suitable to trigger your trades, set up your future actions, decide your Take Profit and Stop Loss levels, and confirm the market direction. Price will always move between those levels, bouncing or breaking; from one zone to another, all the remaining movements are just mark
Unser Basic Support and Resistance Indikator ist die Lösung, die Sie für die Steigerung Ihrer technischen Analyse benötigen.Mit diesem Indikator können Sie Support- und Widerstandsebenen in der Tabelle projizieren/ MT5 -Version Funktionen Integration von Fibonacci -Ebenen: Mit der Option, Fibonacci -Werte neben Unterstützung und Widerstandsniveau anzuzeigen, gibt unser Indikator einen noch tieferen Einblick in das Marktverhalten und mögliche Umkehrbereiche. Leistungsoptimierung: Mit der Op
All Symbols   AND  All Time frames Scan                                                                                                                 Document Introduction   The ABCD is a basic harmonic pattern. The ABCD pattern is a visual, geometric chart pattern comprised of three consecutive price swings. It looks like a diagonal lightning bolt and can indicate an upcoming trading opp
Trade with Gann on your side!! MASTER CIRCLE 360 CIRCLE CHART, originally created by Gann admitted that this is “The Mother of all charts”. It is one of the last studies that this great trader left for us. The numeric tab le is apparently quite simple like all the tables and is based on square numbers, the SQUARE OF 12 and is by evolution, one of the most important square numbers. Here we can find CYCLE, PRICE AND TIME thanks to angles and grades, to show past and future support and resistance.
The Supply and Demand Zones indicator is one of the best tools we have ever made. This great tool automatically draws supply and demand zones, the best places for opening and closing positions. It has many advanced features such as multi timeframe zones support, displaying the width of zones, alert notifications for retouched zones, and much more. Because of market fractality, this indicator can be used for any kind of trading. Whether you are a positional, swing, or intraday trader does not ma
TWO PAIRS SQUARE HEDGE METER INDICATOR Try this brilliant 2 pairs square indicator It draws a square wave of the relation between your two inputs symbols when square wave indicates -1 then it is very great opportunity to SELL pair1 and BUY Pair2 when square wave indicates +1 then it is very great opportunity to BUY pair1 and SELL Pair2 the inputs are : 2 pairs of symbols         then index value : i use 20 for M30 charts ( you can try other values : 40/50 for M15 , : 30 for M30 , : 10 for H1 ,
Gold Bricks FX USES THE TREND WAVE INDICATOR AND IT CAN IDENTIFY THE BEGINNING AND THE END OF A NEW WAVE TREND MOVEMENT. AS AN OSCILLATOR, THE INDICATOR IDENTIFIES THE OVERBOUGHT AND OVERSOLD ZONES. IT WORKS GREAT TO CATCH THE SHORT TERM PRICE REVERSALS AND USES A MARTINGALE STRATEGY TO CLOSE ALL TRADES IN PROFIT. USE DEFAULT SETTINGS ON H1 OR HIGHER TIME FRAME ON ANY PAIR FOR MORE ACCURATE TRADES WHY THIS EA : Smart entries calculated by 4 great strategies The EA can be run on even a
The Candlestick Pattern Detector is an advanced MetaTrader 4 indicator designed to identify and highlight candlestick patterns on your charts. Currently, the indicator detects one specific candlestick pattern - the pinbar, known for its significance in technical analysis and trading strategies. This tool provides traders with visual cues, making it easier to spot potential market reversals or continuations. Features: Customizable Colors: Users can customize the colors of the bullish and bearish
--->  Check all the other products  <--- The Candle Bias is a coloring indicator that doesn't take account of the close price of the bars.  It will color the candle in the bearish color (of your choice) if the downard range is greater than the upward range.  Conversely, it will color the candle in the bullish color of your choice if the upward range is greater than the downward range.  This is a major helper for Multi Time Frame analysis, it works on every security and every Time Frame. You
In the stock market technical analysis, support and resistance is a concept that the movement of the price of a security will tend to stop and reverse at certain predetermined price levels. Support and resistance levels can be identified on any timeframe. However, the most significant ones are found on the higher time frames, such as daily, weekly, and monthly. This indicator using the weekly OHLC data to identify the relevant levels. This is a support and resistance indicator and providing majo
This indicator is a must have tool that scans the active chart for candlestick patterns. It labels each bar according the candlestick pattern(s) that it finds enabling you to more easily analyze price action and be more informed about your trading decision. There are 103 common and uncommon possible patterns plus 6 new patterns based on research that the indicator can identify. If a candlestick(s) meets the requirements for multiple patterns, the bar will be labeled with up to 4 patterns names f
RTrends
Nikolay Likhovid
The RTrends indicator does two things: first, it automatically draws the layout of the price chart by plotting trend lines and, secondly, it produces bearish and bullish signals. The layout reflects the fractal nature of the market. Trends from different time horizons are applied simultaneously on the chart. Thus, from a single chart a trader can see trend lines of higher timeframes. The lines, depending on the horizon, differ in color and width: the older the horizon, the thicker the line is. T
Laguerre SuperTrend Clouds adds an Adaptive Laguerre averaging algorithm and alerts to the widely popular SuperTrend indicator. As the name suggests, Laguerre SuperTrend Clouds (LSC) is a trending indicator which works best in trendy (not choppy) markets. The SuperTrend is an extremely popular indicator for intraday and daily trading, and can be used on any timeframe. Incorporating Laguerre's equation to this can facilitate more robust trend detection and smoother filters. The LSC uses the impro
MR BEAST INDICATOR ATR SUPLIED AND DEMAND ¡Descubre la herramienta definitiva para la toma de decisiones financieras con nuestro asesor experto! Diseñado para operar en la vanguardia de los mercados globales, este asesor se destaca por su capacidad única para analizar tendencias en tiempo real utilizando el indicador Average True Range (ATR) y el equilibrio de oferta y demanda. Al aprovechar el ATR, nuestro asesor experto evalúa la volatilidad actual del mercado, proporcionándote una visión clar
This indicator allows to analyze a chart using the rule of supple and demand. You will see zones of sales and purchases and determine the most profitable points to open positions. The indicator is based on the principle of market fractality. Chart zones show places where a strong buyer or seller has made the price reverse and change its direction. The indicator has several types of zones calculation. Color and type of zones displaying are set as desired. The zone width can be displayed in pips.
Dies ist ein MTF-Indikator für Unterstützungs- und Widerstandsniveaus basierend auf den   Extremwerten des Advanced ZigZag Dynamic   und/oder   Extended Fractal   Indikators mit Preisetiketten (kann deaktiviert werden). Für den MTF-Modus können höhere TFs ausgewählt werden. Standardmäßig werden die Ebenen basierend auf ZigZag-Indikatorpunkten generiert. Fraktale Indikatorpunkte können auch zusammen mit ZigZag oder stattdessen verwendet werden. Um die Verwendung zu vereinfachen und CPU-Zeit zu sp
PZ Support Resistance
PZ TRADING SLU
3.33 (3)
Sind Sie es leid, Unterstützungs- und Widerstandslinien zu zeichnen? Der Unterstützungswiderstand ist ein Multi-Zeitrahmen-Indikator, der Unterstützungs- und Widerstandslinien mit einer sehr interessanten Wendung automatisch erkennt und zeichnet: Wenn das Preisniveau im Laufe der Zeit getestet wird und seine Bedeutung zunimmt, werden die Linien dicker und dunkler. [ Installationsanleitung | Update-Anleitung | Fehlerbehebung | FAQ | Alle Produkte ] Steigern Sie Ihre technische Analyse über Nacht
This scanner is a tool used to support trading. Scanner searches on a wide market, in real time setups, created by mutual arrangements of candles (candles pattern). Its basic features are:  8 implemented trading setups (it is possible to add further setups, additional versions of the scanner),  the possibility of simultaneous scanning, all financial instruments available on the platform,  the possibility of simultaneous scanning, in all timeframes available on the platform,  the ability to manua
Volume by Price MT4
Brian Collard
4.71 (14)
The Volumebyprice.com Indicator for MetaTrader 4 features Volume Profile and Market Profile TPO (Time Price Opportunity). Volume and TPO histogram bar and line charts. Volume Footprint charts. TPO letter and block marker collapsed and split structure charts. Static, dynamic and flexible range segmentation and compositing methods with relative and absolute visualizations. Session hours filtering and segment concatenation with Market Watch and custom user specifications. Graphical layering, posit
[ MT5 Version ] Supply and Demand Multitimeframe Supply and Demand Multitimeframe is the first indicator in the market that combines multiple aspects like trading volume, price structure and momentum to identify Supply and Demand zones for every asset. The Supply and Demand indicator analyzes simultaneously up to 4 different TFs and represents their information in the current graph. Its interactive UI highlights everytime the price enters a Supply or Demand zone even if the zones are not visib
Master Scalping M1 ist ein innovativer Indikator, der einen Algorithmus verwendet, um den Trend schnell und genau zu bestimmen. Der Indikator berechnet den Zeitpunkt zum Öffnen und Schließen von Positionen, die Indikatoralgorithmen ermöglichen es Ihnen, die idealen Zeitpunkte für den Einstieg in einen Handel (Kauf oder Verkauf eines Vermögenswerts) zu finden, was den Erfolg von Transaktionen für die meisten Händler erhöht. Vorteile des Indikators: Einfach zu bedienen, überladen Sie das Diagramm
Daily Candle Predictor ist ein Indikator, der den Schlusskurs einer Kerze vorhersagt. Der Indikator ist in erster Linie für die Verwendung in D1-Charts gedacht. Dieser Indikator eignet sich sowohl für den traditionellen Devisenhandel als auch für den Handel mit binären Optionen. Der Indikator kann als eigenständiges Handelssystem oder als Ergänzung zu Ihrem bestehenden Handelssystem verwendet werden. Dieser Indikator analysiert die aktuelle Kerze und berechnet bestimmte Stärkefaktoren innerhalb
Mean Reversion Supply Demand Indicator Mean Reversion Supply Demand is the indicator to detect the important supply demand zone in your chart. The concept of supply demand trading relies on the quantity mismatching between buying and selling volumes in the financial market. Typically, supply demand zone serves to predict the turning point. The wave pattern, for any supply demand zone to work as an successful trade, looks like the price must touch the base zone, move away and then return to zone
The Th3Eng PipFinite indicator is based on a very excellent analysis of the right trend direction with perfect custom algorithms. It show the true direction and the best point to start trading. With StopLoss point and Three Take Profit points. Also it show the right pivot of the price and small points to order to replace the dynamic support and resistance channel, Which surrounds the price. And Finally it draws a very helpful Box on the left side on the chart includes (take profits and Stop loss
What are Heiken Ashi Candles? Heiken Ashi, derived from the Japanese term 'Heikin Ashi,' translates to average price bars. It's an indicator depicting price bars on a chart. Formula for Heiken Ashi candles: - Heiken Ashi opening price: (previous candle's opening + closing price) / 2 - Closing price Heiken Ashi: (opening + high + low + closing) / 4 - Heiken Ashi peak: Max of high, opening, or closing price - Heiken Ashi bottom price: Min of low, opening, or closing price How to Read Heik
Are you tired of drawing Support & Resistance levels for your Quotes? Are you learning how to spot Support & Resistances? No matter what is your case, Auto Support & Resistances will draw those levels for you! AND, it can draw them from other timeframes, right into you current chart, no matter what timeframe you are using... You can also Agglutinate regions/zones that are too much closer to each other and turning them into one single Support & Resistance Level. All configurable.
You can change the time period of the chart at the touch of a button. You can also change multiple charts at the touch of a button. You can also change multiple charts at the touch of a button, saving you the trouble of changing time periods. We are live-streaming the actual operation of the system. https://www.youtube.com/@ganesha_forex We do not guarantee your investment results. Investments should be made at your own risk. We sharll not be liable for any disadvantage or damage caused by
The Penta-O is a 6-point retracement harmonacci pattern which usually precedes big market movements. Penta-O patterns can expand and repaint quite a bit. To make things easier this indicator implements a twist: it waits for a donchian breakout in the right direction before signaling the trade. The end result is an otherwise repainting indicator with a very reliable trading signal. The donchian breakout period is entered as an input. [ Installation Guide | Update Guide | Troubleshooting | FAQ | A
Forex Indicator  " Shooting Star pattern" for MT4 Indicator  " Shooting Star pattern "  is very powerful indicator   for Price Action trading :    No repaint, No delays; Indicator   detects bearish Shooting Star patterns  on chart:    Red arrow signal on chart (see pictures) P C, Mobile & Email alerts   are included Indicator    " Shooting Star pattern"  is excellent to   combine with Support/Resistance  Levels // More great Expert Advisors and Indicators are available here:  https://www.mql5.co
Noize Absorption Index MT4
Ekaterina Saltykova
5 (1)
Noize Absorption Index - is the manual trading system that measures the difference of pressure between bears forces and bulls forces. Green line - is a noize free index that showing curent situation. Zero value of index shows totally choppy/flat market.Values above zero level shows how powerfull bullish wave is and values below zero measures bearish forces.Up arrow appears on bearish market when it's ready to reverse, dn arrow appears on weak bullish market, as a result of reverse expectation. S
Käufer dieses Produkts erwarben auch
Gann Made Easy
Oleg Rodin
4.88 (99)
Gann Made Easy ist ein professionelles und einfach zu bedienendes Forex-Handelssystem, das auf den besten Handelsprinzipien unter Verwendung der Theorie von Mr. basiert. W.D. Gann. Der Indikator liefert genaue KAUF- und VERKAUFSsignale, einschließlich Stop-Loss- und Take-Profit-Levels. Mit PUSH-Benachrichtigungen können Sie auch unterwegs handeln. Bitte kontaktieren Sie mich nach dem Kauf! Ich werde meine Handelstipps und tolle Bonusindikatoren kostenlos mit Ihnen teilen! Wahrscheinlich haben Si
Trend Punch
Mohamed Hassan
4.91 (23)
This indicator is unstoppable when combined with our other indicator called  Support & Resistance . After purchase, send us a message and you will get it   for  FREE as a BONUS! Introducing Trend Punch , the revolutionary forex trend indicator that will transform the way you trade! Trend Punch is uniquely designed to provide precise buy and sell arrows during strong market trends, making your trading decisions clearer and more confident. Whether you're trading major currency pairs or exotic sym
Trend Pulse
Mohamed Hassan
5 (5)
Please contact me after purchase to immediately get your PDF strategy + documentation for Trend Pulse !  Official release price of $89  (2 /50 copies left). Next price is $199 . Introducing Trend Pulse , a unique and robust indicator capable of detecting bullish, bearish, and even ranging trends! Trend Pulse uses a special algorithm to filter out market noise with real precision. If the current symbol is moving sideways, Trend Pulse will send you a ranging signal, letting you know that it'
Atomic Analyst
Issam Kassas
5 (3)
Zunächst einmal ist es erwähnenswert, dass dieser Handelsindikator nicht neu malt, nicht neu zeichnet und keine Verzögerung aufweist, was ihn sowohl für manuellen als auch für Roboterhandel ideal macht. Benutzerhandbuch: Einstellungen, Eingaben und Strategie. Der Atom-Analyst ist ein PA-Preisaktionsindikator, der die Stärke und das Momentum des Preises nutzt, um einen besseren Vorteil auf dem Markt zu finden. Ausgestattet mit fortschrittlichen Filtern, die helfen, Rauschen und falsche Signale z
Scalper Inside PRO
Alexey Minkov
4.75 (60)
An exclusive indicator that utilizes an innovative algorithm to swiftly and accurately determine the market trend. The indicator automatically calculates opening, closing, and profit levels, providing detailed trading statistics. With these features, you can choose the most appropriate trading instrument for the current market conditions. Additionally, you can easily integrate your own arrow indicators into Scalper Inside Pro to quickly evaluate their statistics and profitability. Scalper Inside
Derzeit 20% Rabatt! Die beste Lösung für jeden Neueinsteiger oder Expert Händler! Dieses Dashboard arbeitet mit 28 Währungspaaren. Es basiert auf 2 unserer Hauptindikatoren (Advanced Currency Strength 28 und Advanced Currency Impulse). Es bietet einen hervorragenden Überblick über den gesamten Forex-Markt. Es zeigt die Werte der Advanced Currency Strength, die Veränderungsrate der Währungen und die Signale für 28 Devisenpaare in allen (9) Zeitrahmen. Stellen Sie sich vor, wie sich Ihr Hande
Enigmera
Ivan Stefanov
5 (4)
ENIGMERA: Der Kern des Marktes https://www.enigmera.com Einführung Dieser Indikator und dieses Handelssystem sind ein bemerkenswerter Ansatz für die Finanzmärkte. ENIGMERA nutzt die fraktalen Zyklen zur genauen Berechnung von Unterstützungs- und Widerstandsniveaus. Er zeigt die echte Akkumulationsphase an und gibt Richtung und Ziele vor.  Ein System, das funktioniert, egal ob wir uns in einem Trend oder in einer Korrektur befinden.  Wie funktioniert es? ENIGMERA besteht aus drei Linien: der
PZ Day Trading
PZ TRADING SLU
3.67 (3)
Dieser Indikator erkennt Preisumkehrungen im Zick-Zack, wobei nur Preisaktionsanalysen und ein Donchian-Kanal verwendet werden. Es wurde speziell für den kurzfristigen Handel entwickelt, ohne dass ein Nachlackieren oder ein Backpainting erforderlich ist. Es ist ein fantastisches Werkzeug für clevere Trader, die darauf abzielen, das Timing ihrer Operationen zu verbessern. [ Installationsanleitung | Update-Anleitung | Fehlerbehebung | FAQ | Alle Produkte ] Erstaunlich einfach zu handeln Es bi
DERZEIT 26% RABATT Die beste Lösung für jeden Newbie oder Expert Trader! Dieser Indikator ist ein einzigartiges, qualitativ hochwertiges und erschwingliches Trading-Tool, da wir eine Reihe von proprietären Funktionen und eine neue Formel integriert haben. Mit nur EINEM Chart können Sie die Währungsstärke für 28 Forex-Paare ablesen! Stellen Sie sich vor, wie sich Ihr Handel verbessern wird, weil Sie in der Lage sind, den genauen Auslösungspunkt eines neuen Trends oder einer Scalping-Gelegenh
Currency Strength Wizard ist ein sehr leistungsstarker Indikator, der Ihnen eine Komplettlösung für erfolgreichen Handel bietet. Der Indikator berechnet die Stärke dieses oder jenes Forex-Paares anhand der Daten aller Währungen in mehreren Zeitrahmen. Diese Daten werden in Form von benutzerfreundlichen Währungsindizes und Währungsstärkelinien dargestellt, anhand derer Sie die Stärke dieser oder jener Währung erkennen können. Sie müssen lediglich den Indikator an das Diagramm anhängen, mit dem Si
TPSproTREND PrO
Roman Podpora
4.78 (18)
TPSpro TREND PRO   ist ein Trendindikator, der den Markt automatisch analysiert und Informationen über den Trend und jede seiner Änderungen liefert sowie Signale für den Einstieg in Geschäfte ohne Neuzeichnung gibt! Der Indikator verwendet jede Kerze und analysiert sie separat. bezieht sich auf verschiedene Impulse – Aufwärts- oder Abwärtsimpuls. Exakte Einstiegspunkte in Transaktionen für Währungen, Krypto, Metalle, Aktien, Indizes! Version MT5                   VOLLSTÄNDIGE BESCHREIBUNG DES
FX Power MT4 NG
Daniel Stein
5 (12)
Erhalten Sie Ihr tägliches Marktupdate mit Details und Screenshots über unser Morning Briefing hier auf mql5 und auf Telegram ! FX Power MT4 NG ist die nächste Generation unseres langjährig sehr beliebten Währungsstärkemessers FX Power. Und was bietet dieser Stärkezähler der nächsten Generation? Alles, was Sie am ursprünglichen FX Power geliebt haben PLUS GOLD/XAU-Stärkeanalyse Noch präzisere Berechnungsergebnisse Individuell konfigurierbare Analysezeiträume Anpassbares Berechnungslimit für noc
DERZEIT 31% RABATT! Die beste Lösung für jeden Newbie oder Expert Trader! Dieser Indikator ist ein einzigartiges, qualitativ hochwertiges und erschwingliches Handelsinstrument, da wir eine Reihe von proprietären Funktionen und eine geheime Formel eingebaut haben. Mit nur EINEM Chart liefert er Alerts für alle 28 Währungspaare. Stellen Sie sich vor, wie sich Ihr Handel verbessern wird, weil Sie in der Lage sind, den genauen Auslösepunkt eines neuen Trends oder einer Scalping-Gelegenheit zu e
PRO Renko System ist ein hochpräzises Handelssystem, das speziell für den Handel mit RENKO-Charts entwickelt wurde. Dies ist ein universelles System, das auf verschiedene Handelsinstrumente angewendet werden kann. Das System neutralisiert effektiv so genannte Marktgeräusche, die Ihnen Zugang zu genauen Umkehrsignalen geben. Der Indikator ist sehr einfach zu bedienen und hat nur einen Parameter, der für die Signalerzeugung verantwortlich ist. Sie können das Tool einfach an jedes Handelsinstr
Gold Channel is a volatility-based indicator, developed with a specific timing algorithm for the XAUUSD pair, which consists of finding possible corrections in the market. This indicator shows two outer lines, an inner line (retracement line) and an arrow sign, where the theory of the channel is to help identify overbought and oversold conditions in the market. The market price will generally fall between the boundaries of the channel. If prices touch or move outside the channel it is a tra
Order Block Hunter
Noha Mohamed Fathy Younes Badr
5 (2)
Order block hunter indicator is the best indicator for  hunt the order blocks that area where there has been a large concentration of limit orders waiting to be executed Order blocks are identified on a chart by observing previous price action and looking for areas where the price experienced significant movement or sudden changes in direction .This indicator does that for you by using very complicated codes and helps you to take the best areas To buy and sell because it make marks at the best a
Zunächst einmal ist es wichtig zu betonen, dass dieses Handelstool ein Nicht-Repaint-, Nicht-Redraw- und Nicht-Verzögerungsindikator ist, was es ideal für professionelles Trading macht. Online-Kurs, Benutzerhandbuch und Demo. Der Smart Price Action Concepts Indikator ist ein sehr leistungsstarkes Werkzeug sowohl für neue als auch erfahrene Händler. Er vereint mehr als 20 nützliche Indikatoren in einem und kombiniert fortgeschrittene Handelsideen wie die Analyse des Inner Circle Traders und Stra
BITTE LESEN SIE DIE INFORMATIONEN UNTEN, BEVOR SIE DAS PRODUKT KAUFEN! Apollo Pips PLUS SP ist ein einzigartiges Produkt! ES IST FÜR ALLE, DIE MEINEN NEUEN „APOLLO PIPS“-INDIKATOR PLUS „SUPER PACK“-BONUS MIT ZUGRIFF AUF ALLE MEINE HANDELSINDIKATOREN ERHALTEN MÖCHTEN! Mit dem Kauf des Produkts Apollo Pips PLUS SP erwerben Sie tatsächlich eine völlig neue Version meines Apollo Pips-Indikators. Diese Version des Indikators verfügt über einen verbesserten Algorithmus und einen benutzerfreundlichen P
Scalper Vault
Oleg Rodin
5 (29)
Scalper Vault ist ein professionelles Scalping-System, das Ihnen alles bietet, was Sie für erfolgreiches Scalping benötigen. Dieser Indikator ist ein komplettes Handelssystem, das von Forex- und Binäroptionshändlern verwendet werden kann. Der empfohlene Zeitrahmen ist M5. Das System liefert Ihnen genaue Pfeilsignale in Richtung des Trends. Es liefert Ihnen auch Top- und Bottom-Signale und Gann-Marktniveaus. Die Indikatoren bieten alle Arten von Warnungen, einschließlich PUSH-Benachrichtigungen.
NAM Order Blocks
NAM TECH GROUP, CORP.
5 (1)
MT4-Erkennungsanzeige für Auftragsblöcke mit mehreren Zeitrahmen. Eigenschaften - Vollständig anpassbar auf dem Diagrammbedienfeld, bietet vollständige Interaktion. - Verstecken und zeigen Sie das Bedienfeld, wo immer Sie möchten. - Erkennen Sie OBs in mehreren Zeiträumen. - Wählen Sie die anzuzeigende OB-Menge aus. - Verschiedene OBs Benutzeroberfläche. - Verschiedene Filter an OBs. - OB-Näherungsalarm. - ADR High- und Low-Leitungen. - Benachrichtigungsdienst (Bildschirmwar
TPSpro RFI Levels
Roman Podpora
4.83 (24)
Umkehr der ersten Impulsniveaus (RFI)       ANWEISUNGEN       Russland       -        ENG    Die Empfehlung basiert auf dem Indikator -   TPSpro   TREND PRO -   Version MT5 Die wichtigsten Elemente in der Branche sind entweder in Zonen oder in der Fabrik enthalten, oder sie führen zu einer Lösung bei einem Kauf oder dem Verkauf eines anderen Instruments. Wenn viele Menschen ihre Rechte nicht auf dem Händlerkonto verschlüsseln, werden die Folgen nicht schnell genug sein. Ich habe es damit abgesc
PZ Trend Trading
PZ TRADING SLU
4.8 (5)
Trend Trading ist ein Indikator, der so weit wie möglich von den Markttrends profitiert, indem er Pullbacks und Breakouts zeitlich festlegt. Sie findet Handelsmöglichkeiten, indem sie analysiert, was der Preis während etablierter Trends tut. [ Installationsanleitung | Update-Anleitung | Fehlerbehebung | FAQ | Alle Produkte ] Handeln Sie mit Zuversicht und Effizienz an den Finanzmärkten Profitieren Sie von etablierten Trends, ohne ins Wanken zu geraten Profitable Pullbacks, Ausbrüche und vor
Entdecken Sie das Geheimnis des erfolgreichen Forex -Handels mit unserem benutzerdefinierten MT4 -Indikator! Haben Sie sich jemals gefragt, wie Sie Erfolg auf dem Forex -Markt erzielen können und gleichzeitig Gewinne erzielen und gleichzeitig das Risiko minimieren können? Hier ist die Antwort, nach der Sie gesucht haben! Erlauben Sie uns, unseren proprietären MT4 -Indikator vorzustellen, der Ihren Handelsansatz revolutionieren wird. Einzigartige Vielseitigkeit Unser Indikator ist speziell
Clear Breakout
Martin Alejandro Bamonte
5 (1)
Der "Breakout Buy-Sell" Indikator ist darauf ausgelegt, potenzielle Kauf- und Verkaufsgelegenheiten basierend auf Preisdurchbrüchen während verschiedener Marktsitzungen (Tokio, London und New York) zu identifizieren und hervorzuheben. Dieser Indikator hilft Tradern, Kauf- und Verkaufszonen sowie Take-Profit (TP) und Stop-Loss (SL) Niveaus klar zu visualisieren. Nutzungsstrategie Der Indikator kann wie folgt verwendet werden: Erste Einstellungen : Wählen Sie die Marktsitzung und passen Sie den GM
RelicusRoad Pro
Relicus LLC
4.73 (141)
Jetzt 147 US -Dollar (nach ein paar Aktualisierungen auf 499 US -Dollar) - Unbegrenzte Konten (PCs oder MACs) RelicusRoad Benutzerhandbuch + Schulungsvideos + Zugang zur privaten Discord-Gruppe + VIP-Status EINE NEUE ART, DEN MARKT ZU BETRACHTEN RelicusRoad ist der weltweit leistungsstärkste Handelsindikator für Forex, Futures, Kryptowährungen, Aktien und Indizes und gibt Händlern alle Informationen und Tools, die sie benötigen, um profitabel zu bleiben. Wir bieten technische Analysen un
M1 Arrow
Oleg Rodin
4.73 (15)
Eine Intraday-Strategie, die auf zwei Grundprinzipien des Marktes basiert. Der Algorithmus basiert auf der Analyse von Volumina und Preiswellen mit zusätzlichen Filtern. Der intelligente Algorithmus des Indikators gibt nur dann ein Signal, wenn sich zwei Marktfaktoren zu einem vereinen. Der Indikator berechnet Wellen eines bestimmten Bereichs auf dem M1-Diagramm unter Verwendung der Daten des höheren Zeitrahmens. Und um die Welle zu bestätigen, verwendet der Indikator eine Volumenanalyse. Dieser
Advanced Supply Demand
Bernhard Schweigert
4.9 (314)
Derzeit 33% Rabatt! Die beste Lösung für jeden Anfänger oder erfahrenen Händler! Dieser Indikator ist ein einzigartiges, qualitativ hochwertiges und erschwingliches Trading-Tool, da wir eine Reihe von proprietären Funktionen und eine neue Formel integriert haben. Mit diesem Update werden Sie in der Lage sein, doppelte Zeitrahmenzonen anzuzeigen. Sie können nicht nur einen höheren TF (Zeitrahmen) anzeigen, sondern sowohl den Chart-TF als auch den höheren TF: SHOWING NESTED ZONES. Alle Supply Dema
Break and Retest
Mohamed Hassan
4.17 (18)
This Indicator only places quality trades when the market is really in your favor with a clear break and retest. Patience is key with this price action strategy! If you want more alert signals per day, you increase the number next to the parameter called: Support & Resistance Sensitivity.  After many months of hard work and dedication, we are extremely proud to present you our  Break and Retest price action indicator created from scratch. One of the most complex indicators that we made with ove
Connect Indicator
Sukunthakan Ngernbamrung
Connect Indicator is a tool used for connecting indicators between the MQL market and MT4. The connected indicators are made by our group and can be used for other applications, such as sending messages to the Line application or Telegram application. If you have any questions, please don't hesitate to ask us to receive support. Function and indicator buffer Buffer one is the high price of the previous candle. Buffer two is the high price of the previous candle. Usage To connect indicators to fu
Entry Points Pro
Yury Orlov
4.7 (226)
Dies ist ein Indikator für MT4, der genaue Signale für den Einstieg in einen Handel ohne Repainting (Neuzeichnen) liefert. Er kann auf alle Finanzwerte angewendet werden: Forex, Kryptowährungen, Metalle, Aktien, Indizes. Er liefert ziemlich genaue Schätzungen und sagt Ihnen, wann es am besten ist, eine Position zu eröffnen und zu schließen. Sehen Sie sich das Video (6:22) mit einem Beispiel für die Verarbeitung nur eines Signals an, das sich für den Indikator gelohnt hat! Die meisten Händler ver
Weitere Produkte dieses Autors
Trend Screener Pro MT5
STE S.S.COMPANY
4.88 (67)
Nutzen Sie die Macht des Trendhandels mit Trend Screener Indicator: Ihrer ultimativen Trendhandelslösung, die auf Fuzzy-Logik und einem System mit mehreren Währungen basiert! Steigern Sie Ihren Trendhandel mit Trend Screener, dem revolutionären Trendindikator mit Fuzzy-Logik. Es handelt sich um einen leistungsstarken Trendfolgeindikator, der über 13 Premium-Tools und -Funktionen sowie 3 Handelsstrategien kombiniert und ihn zu einer vielseitigen Wahl macht, um Ihren Metatrader in einen Trendanaly
Trend Screener
STE S.S.COMPANY
4.82 (92)
Trendindikator, bahnbrechende, einzigartige Lösung für Trendhandel und -filterung mit allen wichtigen Trendfunktionen in einem Tool! Es handelt sich um einen 100 % nicht neu zu malenden Multi-Timeframe- und Multi-Währungs-Indikator, der für alle Symbole/Instrumente verwendet werden kann: Forex, Rohstoffe, Kryptowährungen, Indizes und Aktien. Trend Screener ist ein effizienter Trendfolgeindikator, der Pfeiltrendsignale mit Punkten im Diagramm liefert. Die Funktionen, die im Trendanalysator-Indika
Support And Resistance Screener ist ein Level-Indikator für MetaTrader, der mehrere Tools innerhalb eines Indikators bietet. Die verfügbaren Werkzeuge sind: 1. Marktstruktur-Screener. 2. Bullische Pullback-Zone. 3. Bärische Pullback-Zone. 4. Tägliche Pivot-Punkte 5. wöchentliche Pivots-Punkte 6. monatliche Pivots-Punkte 7. Starke Unterstützung und Widerstand basierend auf harmonischem Muster und Volumen. 8. Zonen auf Bankebene. ZEITLICH BEGRENZTES ANGEBOT: HV Support and Resistance Indicator ist
Trend Line Map Pro
STE S.S.COMPANY
4.5 (16)
Trend Line Map Indicator ist ein Add-On für Trend Screener Indicator . Es arbeitet als Scanner für alle Signale, die vom Trendscreener (Trendliniensignale) erzeugt werden. Es ist ein Trend Line Scanner basierend auf dem Trend Screener Indicator. Wenn Sie keinen Trend Screener Pro Indicator haben, funktioniert die Trend Line Map Pro nicht. Wenn Sie auf unseren MQL5-Blog zugreifen, können Sie die kostenlose Version des Trend Line Map-Indikators herunterladen. Probieren Sie es aus, bevor S
Trend Line Map Pro MT5
STE S.S.COMPANY
4.17 (12)
Trend Line Map Indicator ist ein Add-On für Trend Screener Indicator. Es arbeitet als Scanner für alle Signale, die vom Trendscreener (Trendliniensignale) erzeugt werden. Es ist ein Trend Line Scanner basierend auf dem Trend Screener Indicator. Wenn Sie keinen Trend Screener Pro Indicator haben, funktioniert die Trend Line Map Pro nicht. It's a Trend Line Scanner based on Trend Screener Indicator. If you don't have Trend Screener Pro Indicator,     the Trend Line Map Pro will not work .
Unsere Unterstützungs- oder Widerstandsniveaus werden gebildet, wenn sich die Preisbewegung eines Marktes umkehrt und die Richtung ändert und einen Höchst- oder Tiefpunkt (Swing Point) im Markt hinterlässt. Unterstützungs- und Widerstandsniveaus können Handelsspannen ausmachen. Der Indikator identifiziert das Swing High und Swing Low basierend auf der Anzahl von X Balken (Periode), die im Indikatorsatz definiert sind. Hinweis: Wenn Ihnen unser Preisaktionsindikator gefällt, probieren Sie unse
FREE
Jeder Trader weiß, dass er oder sie nie mehr als 5 % (oder 7 %) pro Trade riskieren sollte. Dies ist ein Money-Management-Gesetz und es sollte jedes Mal eine brauchbare LotSize berechnet werden, da ein Trader für verschiedene Trading-Levels einen anderen StopLoss-Wert verwenden muss. Dieser Indikator berechnet eine angemessene LotSize für den Moment, in dem Sie ihn auf das Diagramm setzen und jedes Mal, wenn Sie die „Stop-Loss-Linie“ in eine beliebige Richtung ziehen. ZEITLICH BEGRENZTES AN
Der Boom and Crash Spike Detector Indikator ist basierend auf einer fortschrittlichen Strategie kodiert, hauptsächlich um den Boom und Crash in den Preisen zu erkennen. Komplexe Algorithmen wurden implantiert, um Booms und Crashs mit hoher Wahrscheinlichkeit in den Preisen zu erkennen. Es warnt vor möglichen Boom- oder Crash-Phasen: Boom-Phase: Wenn der Preis zu schnell steigt. Crash-Phase: Wenn der Preis zu schnell sinkt. ZEITLICH BEGRENZTES ANGEBOT: Der Indikator ist für nur 30$ und lebens
Currency Strength Meter, gibt Ihnen einen schnellen visuellen Überblick darüber, welche Währungen derzeit stark und welche schwach sind. Das Messgerät misst die Stärke aller Forex-Kreuzpaare und wendet Berechnungen an, um die Gesamtstärke für jede einzelne Währung zu bestimmen. Wir berechnen die Stärke der Währung basierend auf dem Trend von 28 Paaren. Wenn Sie auf unseren MQL5-Blog zugreifen, können Sie die kostenlose Version des Indikators herunterladen. Probieren Sie es aus, bevor Sie
Jeder Trader weiß, dass er oder sie nie mehr als 5 % (oder 7 %) pro Trade riskieren sollte. Dies ist ein Money-Management-Gesetz und es sollte jedes Mal eine brauchbare LotSize berechnet werden, da ein Trader für verschiedene Trading-Levels einen anderen StopLoss-Wert verwenden muss. Dieser Indikator berechnet eine angemessene LotSize für den Moment, in dem Sie ihn auf das Diagramm setzen und jedes Mal, wenn Sie die „Stop-Loss-Linie“ in eine beliebige Richtung ziehen. ZEITLICH BEGRENZTES AN
Die Average Daily Range zeigt die durchschnittliche Pip-Range eines Forex-Paares, gemessen über eine bestimmte Anzahl von Perioden. Händler können die ADR verwenden, um potenzielle Kursbewegungen außerhalb der durchschnittlichen täglichen Bewegung zu visualisieren. Wenn die ADR über dem Durchschnitt liegt, bedeutet dies, dass die tägliche Volatilität höher als üblich ist, was bedeutet, dass das Währungspaar möglicherweise über seine Norm hinausgeht. Unser ADR-Analysator besteht aus 5 Hauptfun
Der Volatilitätsanalysator ist ein Momentum-Indikator, der von der Tendenz profitiert, dass der Preis nach der Konsolidierung in einer engen Handelsspanne stark ausbricht. Der Indikator verwendet auch einen Momentum-Oszillator, um die erwartete Richtung der Bewegung anzuzeigen, wenn der Squeeze ausgelöst wird. Dieses Histogramm oszilliert um die Nulllinie, ein steigendes Momentum über der Nulllinie zeigt eine Gelegenheit zum Long-Kauf an, während ein Momentum, das unter die Nulllinie fällt, ein
Der Boom and Crash Spike Detector Indikator ist basierend auf einer fortschrittlichen Strategie kodiert, hauptsächlich um den Boom und Crash in den Preisen zu erkennen. Komplexe Algorithmen wurden implantiert, um Booms und Crashs mit hoher Wahrscheinlichkeit in den Preisen zu erkennen. Es warnt vor möglichen Boom- oder Crash-Phasen: Boom-Phase: Wenn der Preis zu schnell steigt. Crash-Phase: Wenn der Preis zu schnell sinkt. ZEITLICH BEGRENZTES ANGEBOT: Der Indikator ist für nur 30 $ und leben
Die Average Daily Range zeigt die durchschnittliche Pip-Range eines Forex-Paares, gemessen über eine bestimmte Anzahl von Perioden. Händler können die ADR verwenden, um potenzielle Kursbewegungen außerhalb der durchschnittlichen täglichen Bewegung zu visualisieren. Wenn die ADR über dem Durchschnitt liegt, bedeutet dies, dass die tägliche Volatilität höher als üblich ist, was bedeutet, dass das Währungspaar möglicherweise über seine Norm hinausgeht. Unser ADR-Analysator besteht aus 5 Hauptfun
Der Volatilitätsanalysator ist ein Momentum-Indikator, der von der Tendenz profitiert, dass der Preis nach der Konsolidierung in einer engen Handelsspanne stark ausbricht. Der Indikator verwendet auch einen Momentum-Oszillator, um die erwartete Richtung der Bewegung anzuzeigen, wenn der Squeeze ausgelöst wird. Dieses Histogramm oszilliert um die Nulllinie, ein steigendes Momentum über der Nulllinie zeigt eine Gelegenheit zum Long-Kauf an, während ein Momentum, das unter die Nulllinie fällt, ein
Auswahl:
Simba Finance
185
Simba Finance 2024.08.02 07:48 
 

I'm using the indicator on the H1 timeframe and getting clear signals for my trading strategy with good results. Sayadi is very responsive and supportive.

amnonwr2 Waskar
164
amnonwr2 Waskar 2024.07.25 19:37 
 

very good product

cyubahiro
91
cyubahiro 2024.02.21 09:14 
 

Excellent Service and Products.

STE S.S.COMPANY
288430
Antwort vom Entwickler Sayadi Achraf 2024.04.15 02:43
Thank you for taking time to write your review. I'm happy to know that you find our indicator a useful indicator for you. Since 4 years, we are doing our best to keep improving and giving the best indicators for our customers. Please if you have any suggestions or comments about our indicator, feel free to contact us. I invite you to check all the list of all our free and premium indicators here : https://www.mql5.com/en/users/sayadi_lancer/seller
DanyLbc747
865
DanyLbc747 2024.01.18 13:37 
 

I purchased the Support Resistance screnner as a supplement to the Trend Screener indicator and support for the great work of the author and his team.

trick 86
439
trick 86 2023.12.26 22:50 
 

can you add alert when strong support and resistance has been created and also an arrow on which candle(s) touched to verify strong zone?

STE S.S.COMPANY
288430
Antwort vom Entwickler Sayadi Achraf 2023.12.27 11:11
Hi sir, Thank you for taking the time to write your review. I'm happy to know that you liked our indicator. I'm sending you now a private message to check for more details about your suggestions.
--- Please have a good and safe trading. Best regards.
SAYADI Ashref.
mgl5fjn
481
mgl5fjn 2023.12.23 14:27 
 

Very useful tool.

Adrian Wong
226
Adrian Wong 2023.10.20 12:46 
 

Very useful indicator with so many features and what i love most is the Pullback Zone feature.

Juergen Loebach
908
Juergen Loebach 2023.06.21 11:42 
 

Support Resistance screnner helps me with daily decisions .I can highly recommend this product in conjunction with daily live trading.In addition, I would like to mention the exceptionally good service.

Dmitrii Castravet
454
Dmitrii Castravet 2023.04.08 17:28 
 

I have this indicator for couple of weeks on my vps server and signal I am getting on push notifications are not repaint. As is said on description JPY pairs are most profitable and my preference is cadjpy on M5 chart. If you change intensity you can have more arrow but , put money management in to no go against the trend. Firstly I thought is one indicator, then realised has different features built in like resistance levels where I used to watch how is getting pushed price from level as shown strong support where definitely works on price action strategy if someone interested. 5 star for product and communication as I received all support information during this period. Well done to all involved.

Poh Leng Lim
1709
Poh Leng Lim 2023.01.27 17:48 
 

If there is just one indicator you like to purchase for the whole of this year, this would be the one! The important zones are excellent and suit any strategies whether scalp or swing. Sayadi is extremely responsive and helpful! His post-sales service is top notch. 6 stars rating from me.

HMSTOMAHAWK
694
HMSTOMAHAWK 2023.01.07 15:19 
 

great tool in every way and the developer is very attentive to solving new features

Kesiena Eboh
194
Kesiena Eboh 2022.12.20 15:13 
 

A great indicator for identifying important zones. If combined with a good trend indicator, you can make consistent profits using it. Mr. Sayadi has also been very helpful providing extra support when needed.

babak saeedloo
62
babak saeedloo 2022.11.08 18:03 
 

I use this indicator with the Trend Screener indicator and they are working great. very good options in the input data panel and you can customize it for yourself. thank you sayadi

Siva77
472
Siva77 2022.10.24 02:58 
 

This is a gem of an indicator. I’m using the pullback arrows with very good results on the H1 timeframe. The author is very helpful with my request to add buffers to the arrows so that I could automate the pullback arrows trading. Thank you!

lauro1956
4586
lauro1956 2022.09.06 17:39 
 

Excellent results...honest and professional work

globetrotter777
473
globetrotter777 2022.08.09 00:54 
 

This indicator is a must-have for any serious minded trader. Quite impressed with how the indicator finds tops, bottoms and important zones accurately. One of the few level indicator in MLQ5 that comes fitted with full-blown alerts. Besides the author is responsive and provides good support

jabautista
3161
jabautista 2022.08.06 20:32 
 

Excellent indicator specially on the higher timeframes. Author is very responsive to any questions, issues, or suggestions for improvement.

STE S.S.COMPANY
288430
Antwort vom Entwickler Sayadi Achraf 2022.08.07 17:08
Dear sir. Thank you for your review. I'm happy to know that you liked our indicators. We are doing our best to improve our products. Please if you have any questions, feel free to write for me anytime sir. Thank you again for choosing our products, sir. Best regards.
SAYADI Ashraf.
canadianos
44
canadianos 2022.08.06 11:06 
 

Amazing features you built in this indicator with a great support !

STE S.S.COMPANY
288430
Antwort vom Entwickler Sayadi Achraf 2022.08.07 17:07
Dear sir. Thank you for your review. I'm happy to know that you liked our indicators. We are doing our best to improve our products. Please if you have any questions, feel free to write for me anytime sir. I will reply always in maximum of 24 hours based on my availability in front of the computer sir. Thank you again for choosing our products, sir. Best regards.
SAYADI Ashraf.
Prashant Dalvi
53
Prashant Dalvi 2022.08.04 15:29 
 

Repaints...

STE S.S.COMPANY
288430
Antwort vom Entwickler Sayadi Achraf 2023.06.21 11:48
Hi sir, Thank you for taking the time to write for your review. The indicator is one 100% no-repainting indicator. Please make sure that you set the option Keep Old Zone to True.
wuzzy66
911
wuzzy66 2022.06.08 20:31 
 

Another brilliant product you can trade if you which using either the bankers support and resistance put back zone either bearish or bullish even pivot points I can’t ask for more when developed product would 100% recommend to improve your trading

STE S.S.COMPANY
288430
Antwort vom Entwickler Sayadi Achraf 2022.06.09 09:51
Thank you for taking the time to write your review and thank you for your words. Our customers satisfaction is our top priority. Have a good and safe trading.
123
Antwort auf eine Rezension
Version 13.20 2023.12.13
1. Fixed email alerts issue with last Metatrader version.
Version 13.1 2023.09.25
1. Changing default setting of the indicator.
Version 13.0 2023.09.15
1. Add options to enable-disable every feature
Version 12.10 2023.06.19
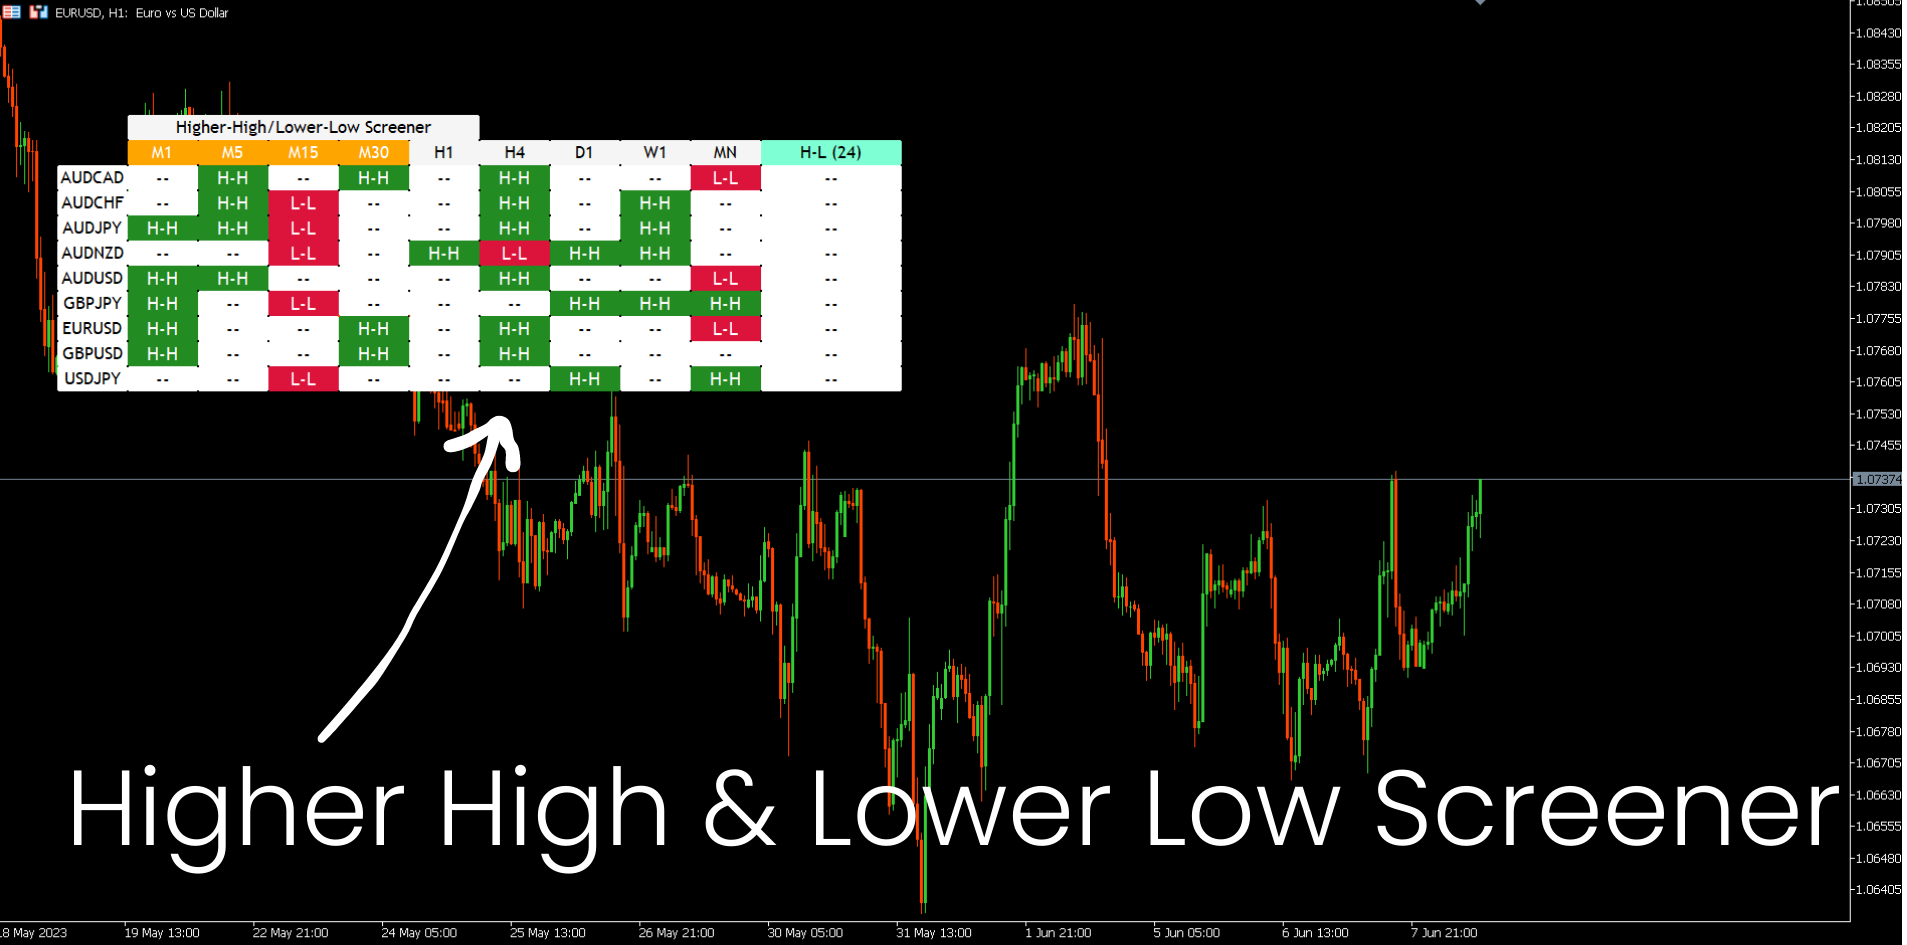
1. Fixing Alerts for HH-LL Screener.
Version 12.0 2023.06.08
1. Optimize Pullback zones to include markets ( Deriv pairs )
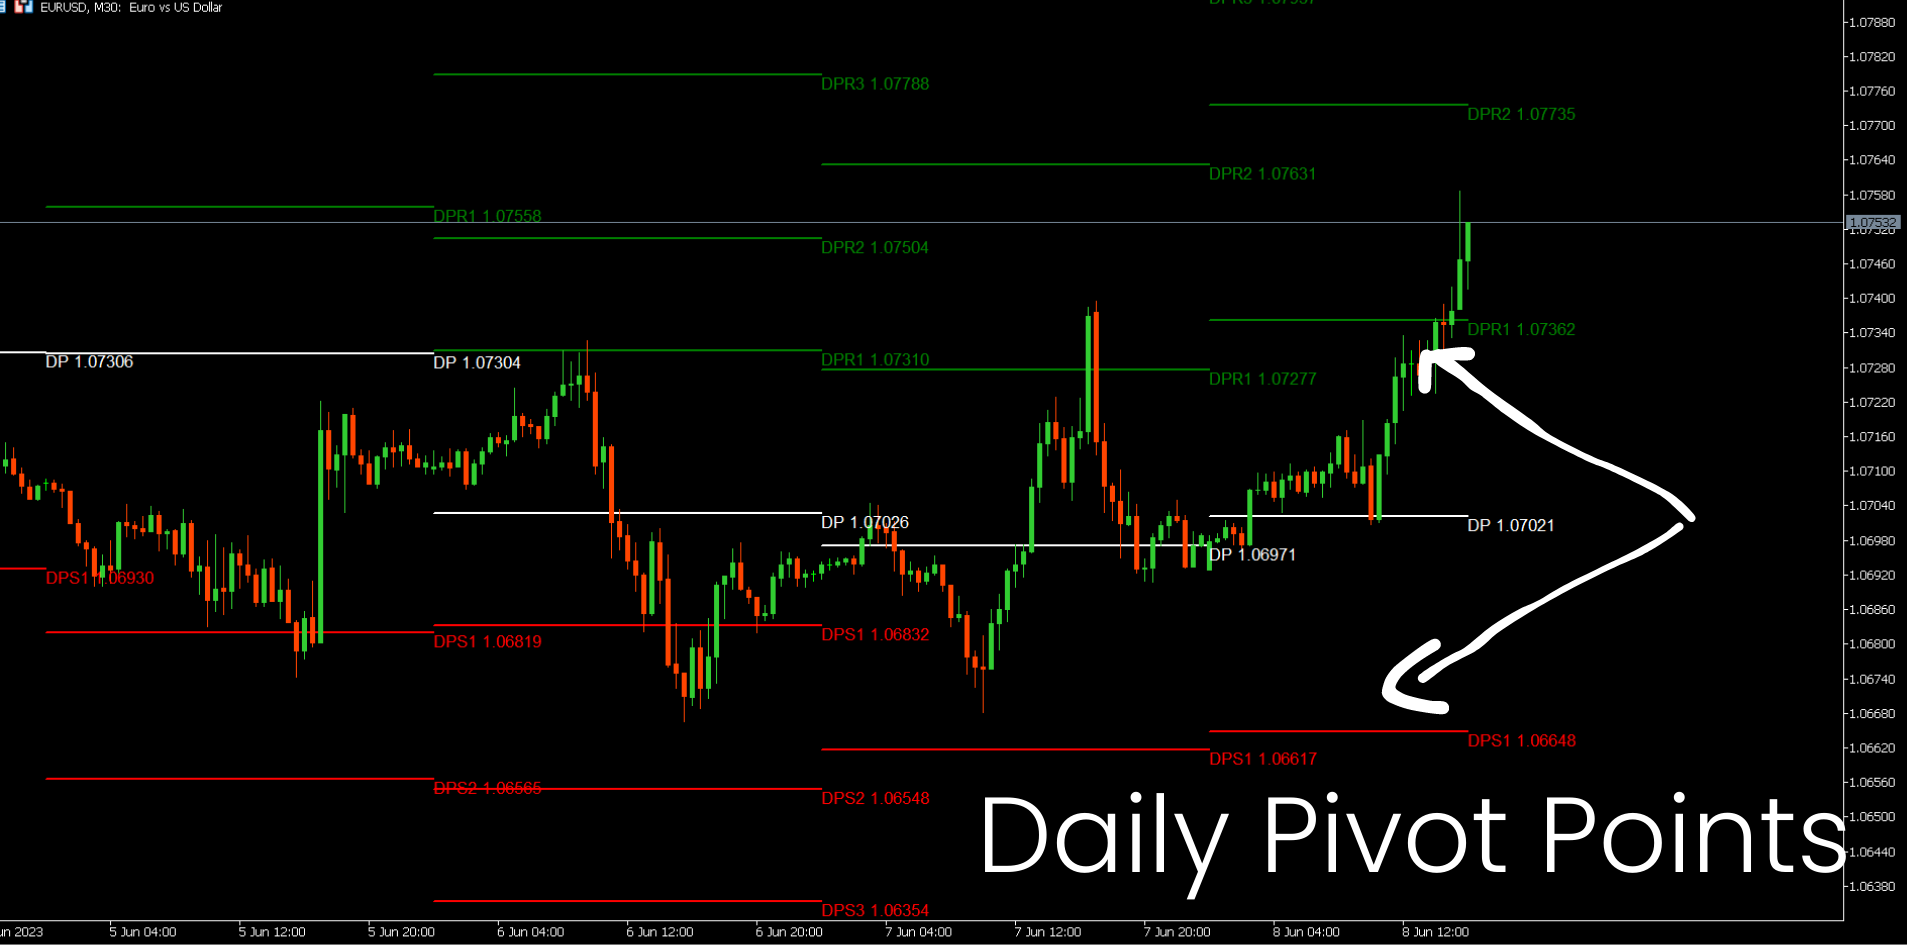
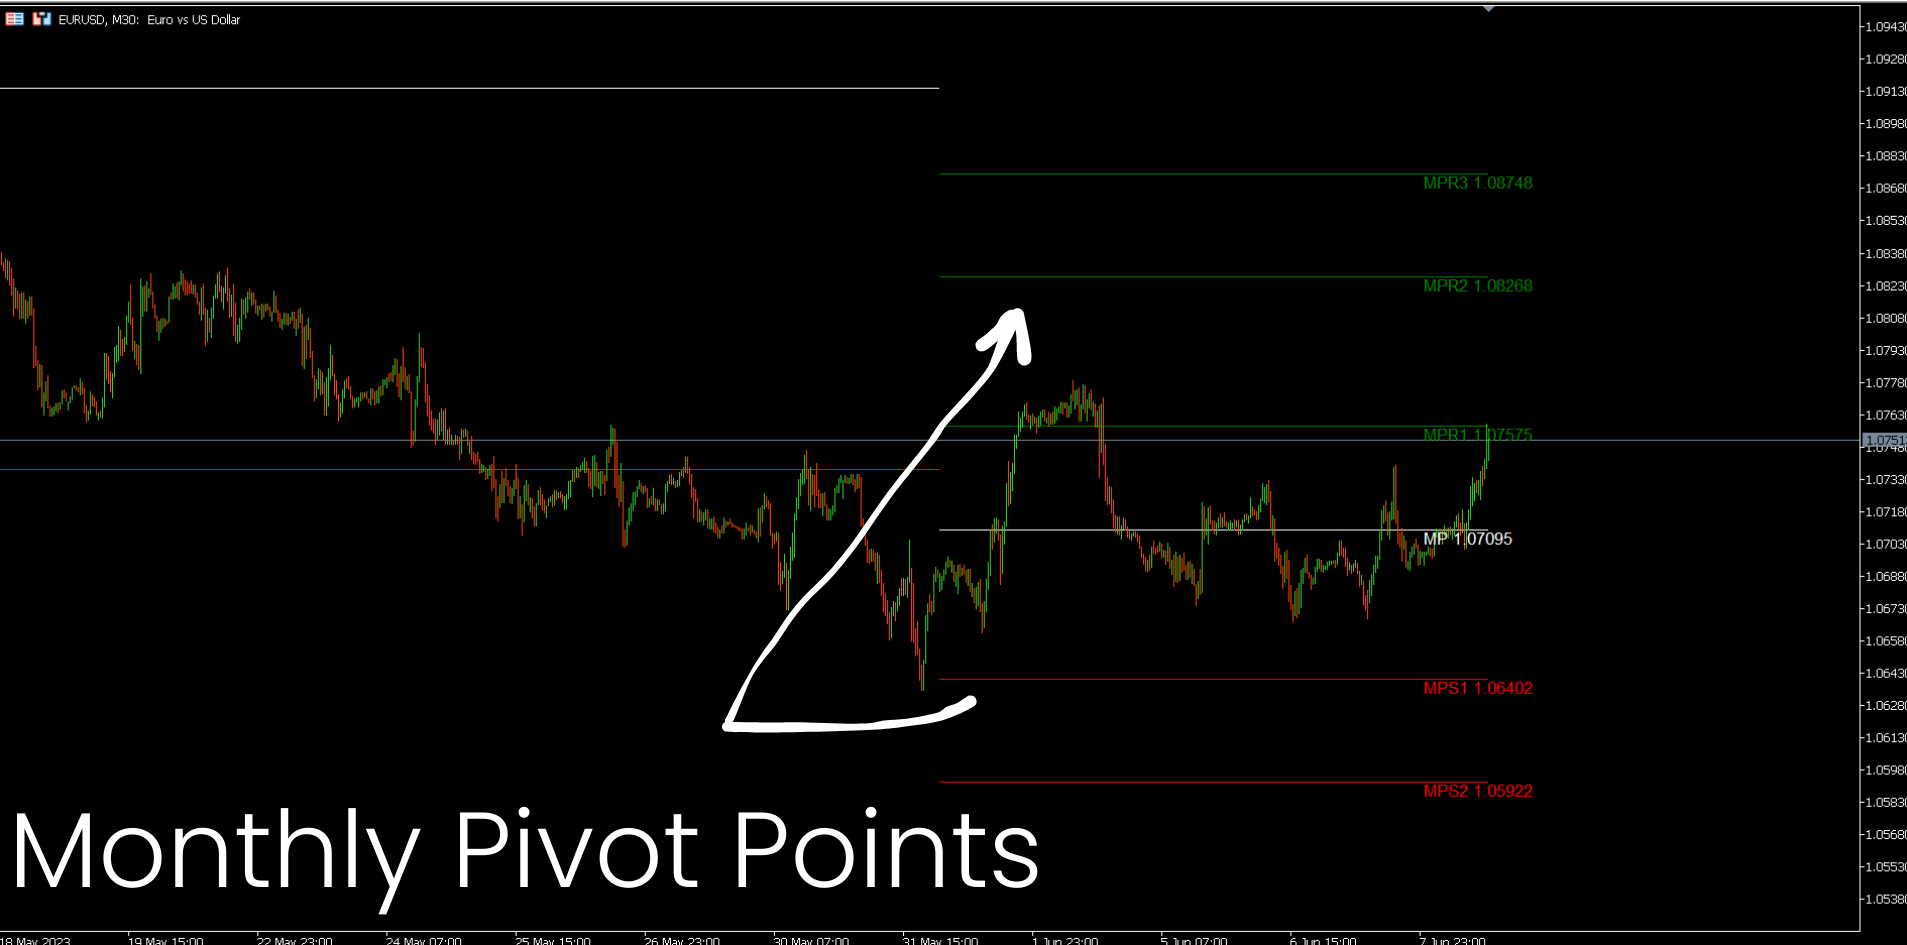
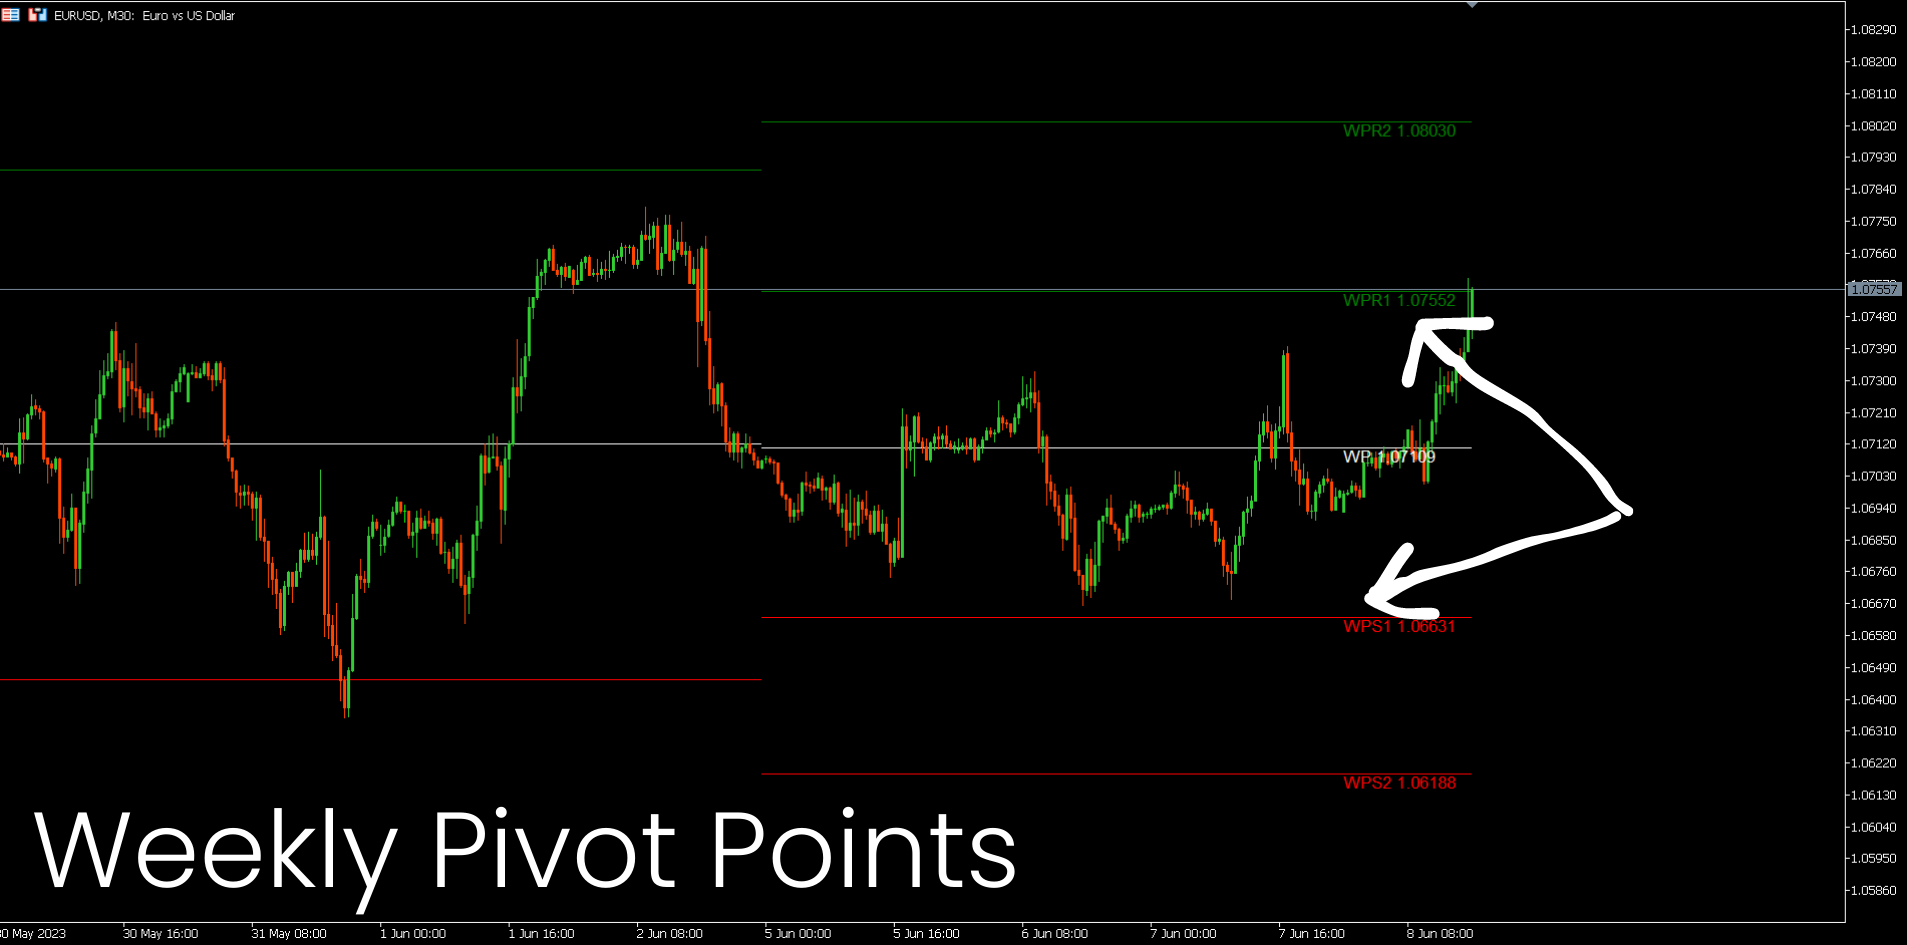
2. Enable 3 types of Pivots points.
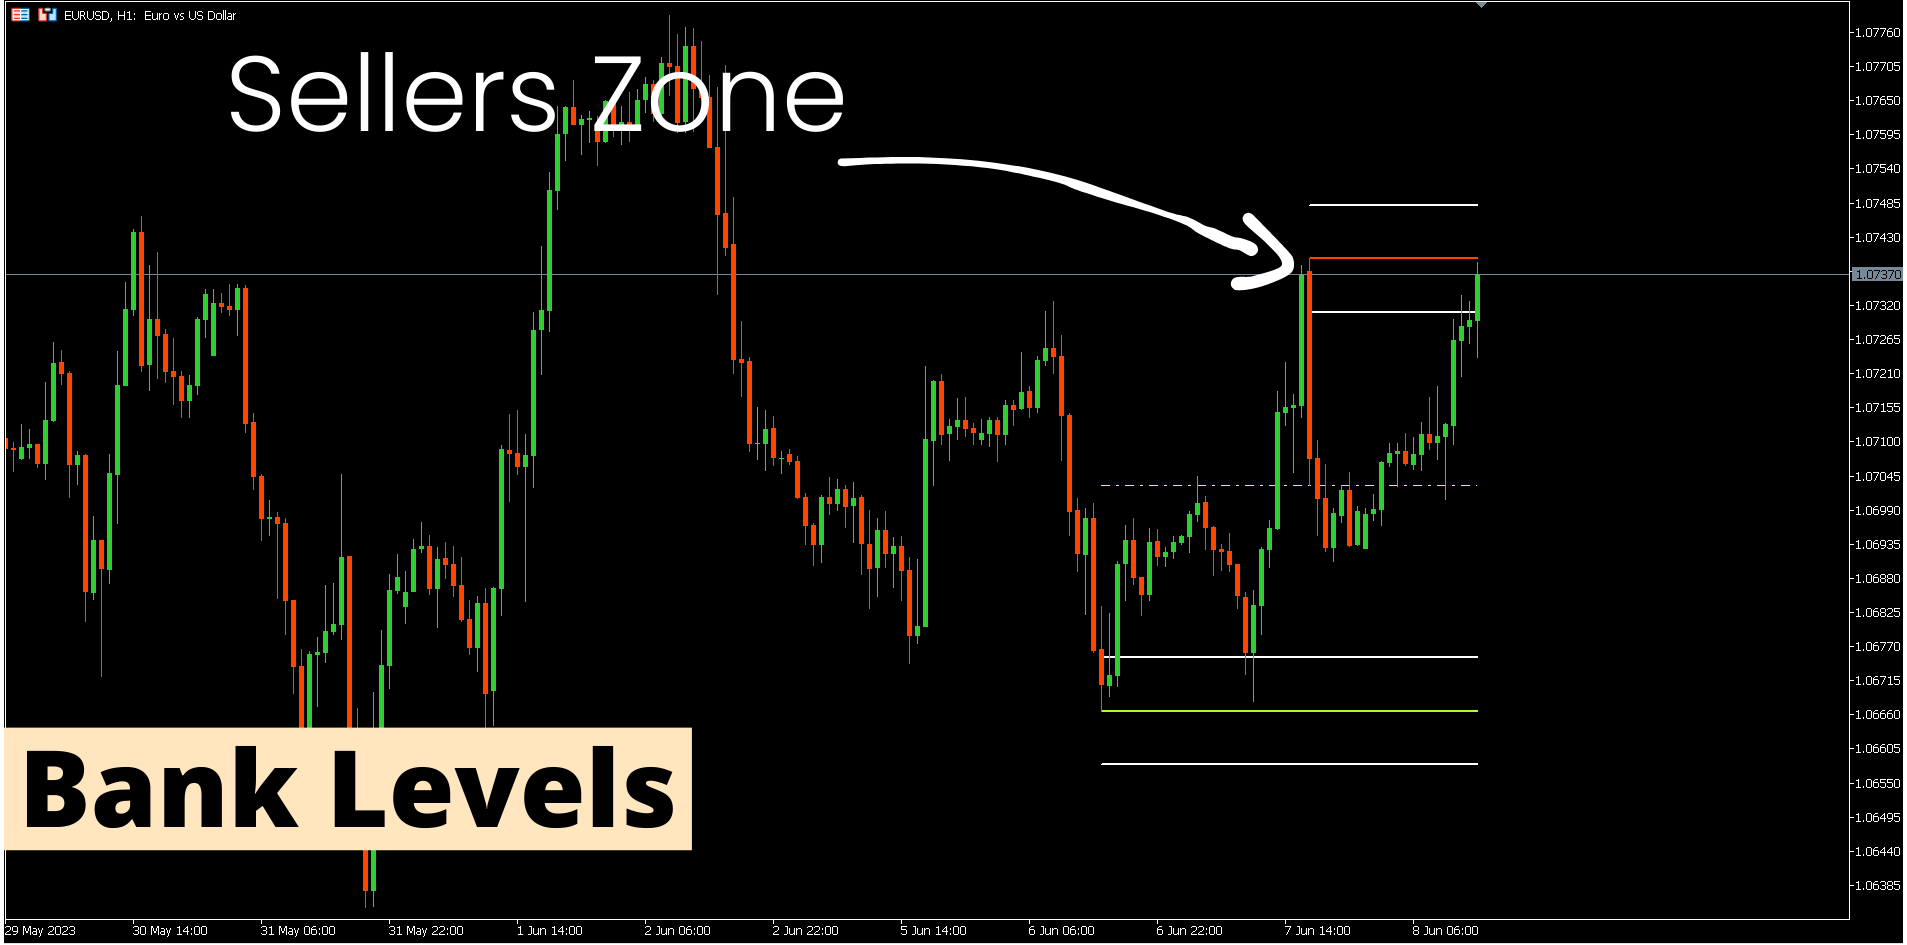
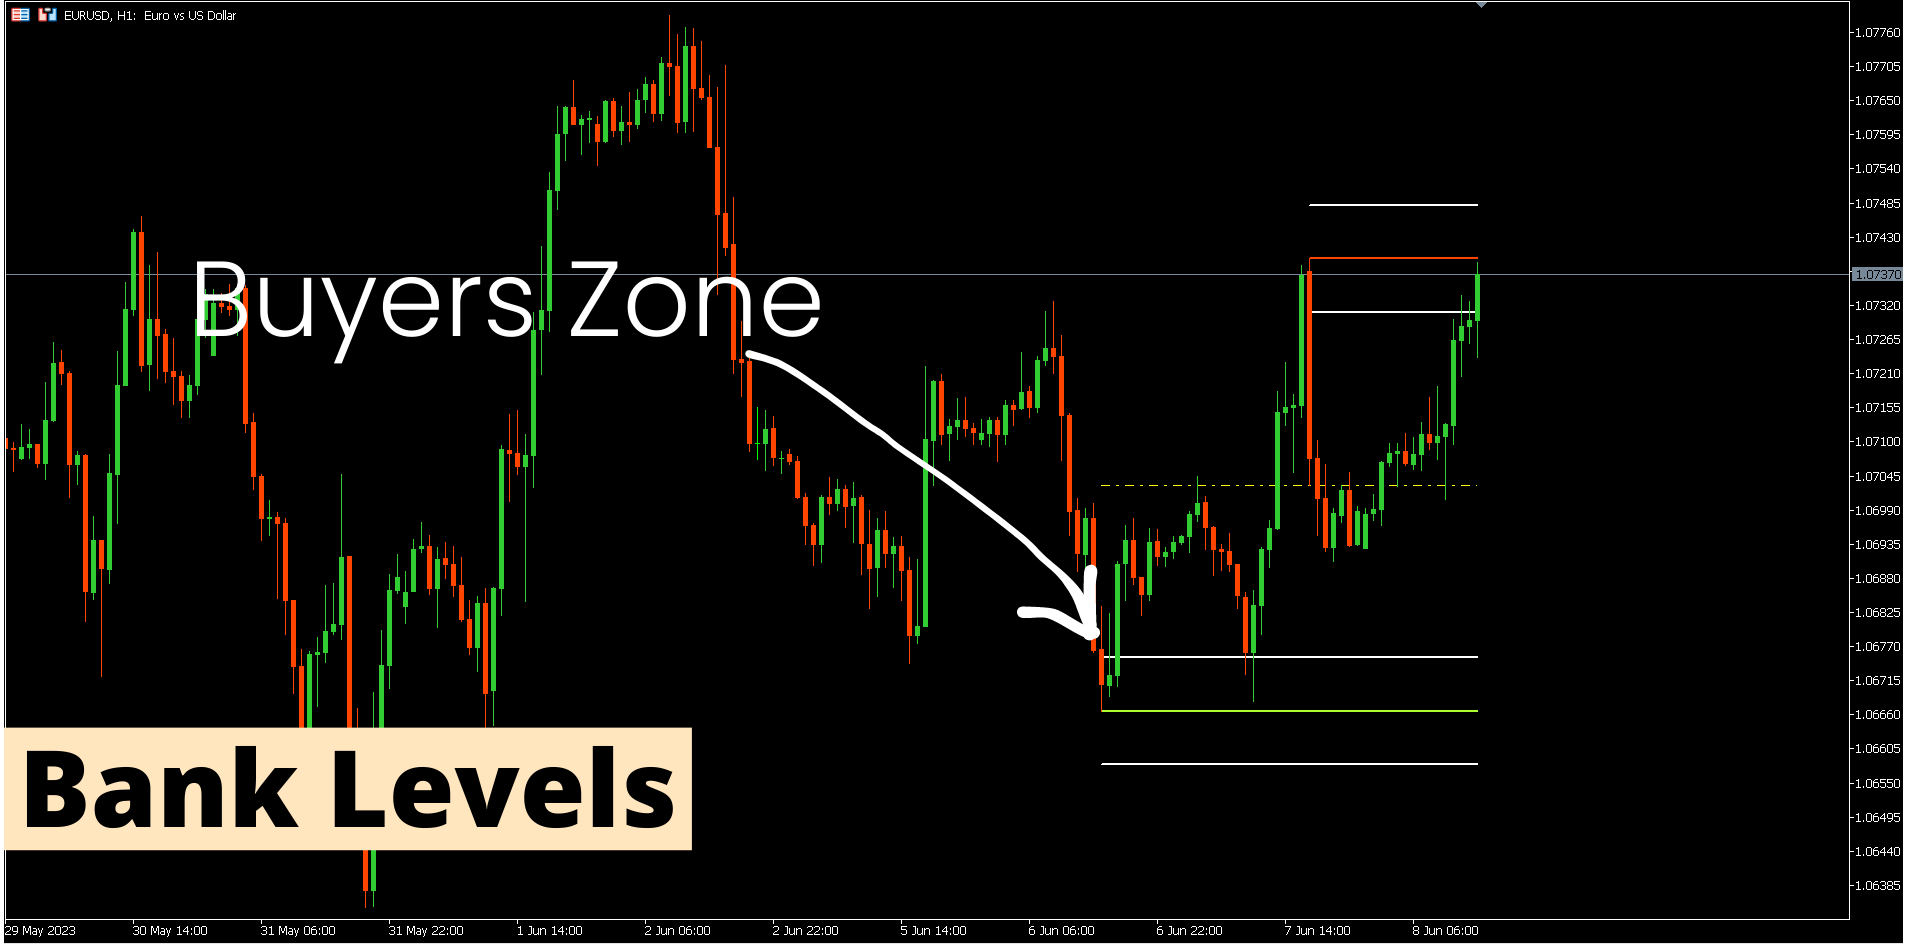
3. Optimize Bank level zones.
Version 11.10 2023.02.03
1. Combine breakout /Pullback Zones to get one zone type with arrows.
Version 10.10 2023.01.23
1. Fixing alert issue with In Buyers and Sellers Zones. ( PullBack - Breakout Zones Alerts )
2. Optimizing Buyers and Sellers backtesting speed.
Version 10.0 2023.01.18
1. Change Pullback Zones logic.
2. Add Breakout zones.
3. Remove the Bank level feature.
Version 9.30 2023.01.13
1. Improve the PullBack zone algorithm to wait for the bar to close to confirm zone.
Version 9.21 2022.12.30
1. Add Buffer for Pullback Zones.
2. Improve indicator speed performance.
Version 9.20 2022.12.06
1. Add Mid level of the Bank level features.
2. Optime Pullback Zone Buffers.
3. Fixing Array out of Range for Pivots point features ( Daily, weekly and monthly ).
Version 9.1 2022.08.08
1. Fixing changing mode issues and cleaning old zones
Version 9.0 2022.08.07
1. Optimizing Pullback feature algorithm.
2. Add an option to keep old pullback zones.
Version 8.51 2022.08.04
1. Add Price Label to support and resistance zones.
Version 8.50 2022.05.30
1. Add a new feature: Bank Levels.
2. Add Alerts to the Price Action Screener.
Version 8.22 2022.05.01
1. Add change arrow color for pullback zones.
Version 8.21 2022.04.13
1. Add sensitivity period for pullback zones.
Version 8.20 2022.03.23
1. Fixing Buttons Naviguator.
Version 8.10 2021.12.24
1. Add Pivots points levels.
2. Optimizing Pullback zones functions.
3. Fixing loading Strong Support and Resistance Zones.
Version 8.0 2021.12.23
1. Add Screener.
2. Fixing display issue.
Version 7.70 2021.10.15
1. Updating the indicator based on the last MT4 version.
Version 7.60 2021.07.22
1. Add support for GOLD
2. Optimizing the algorithm of support and resistance.
Version 7.50 2021.05.11
1. Optimizing indicator speed.
Version 7.30 2021.04.18
1. Add symbols screener.
Version 7.10 2020.08.25
1. Optimizing algorithm of identifying strong support and strong resistance.
Version 7.0 2020.06.05
1. Add hide-display Screener
Version 6.0 2020.04.21
1. Optimizing the process of chart cleaning.
Version 5.0 2020.04.09
1. Adjusting the default setting.
Version 4.0 2020.03.26
1. Add new parameters to adjust box sizes and text box size.
Version 3.33 2020.03.10
1. Optimizing indicator logic.
Version 2.20 2020.02.22
1. Add color for strong zones.
2. Add Display Strong zones only feature.
Version 2.0 2020.02.15
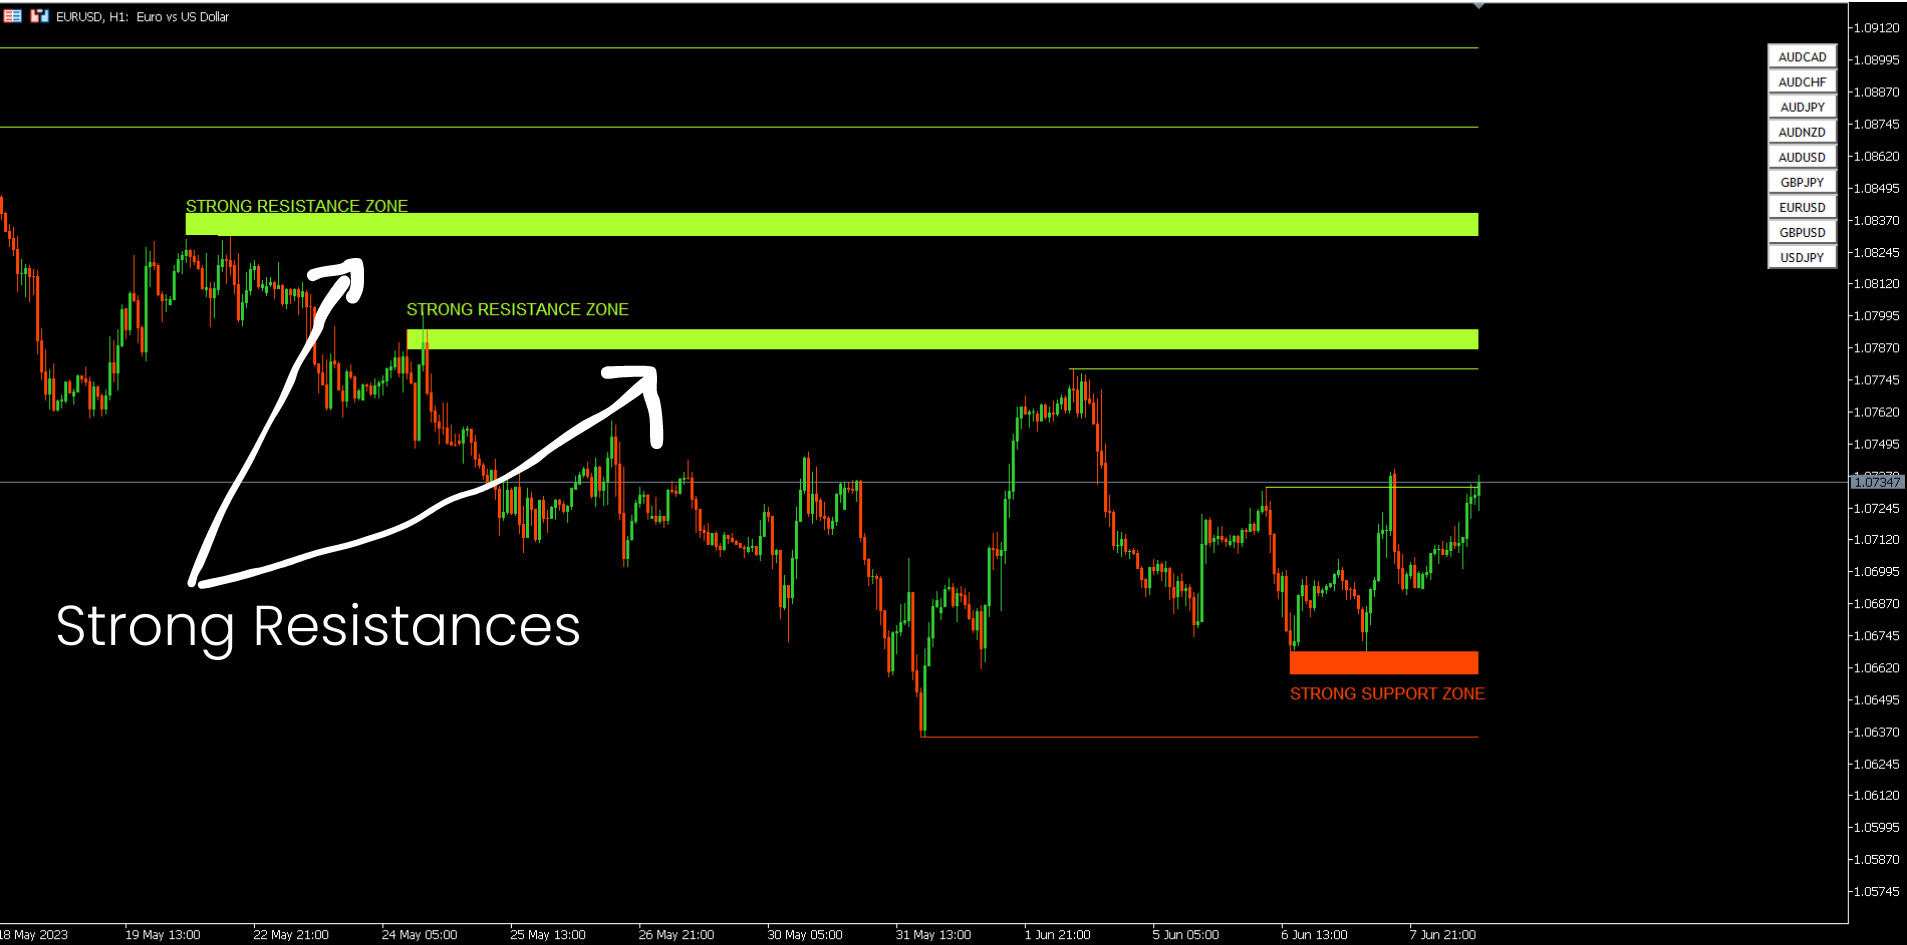
1. Add Strong support and resistance Zones