CSV2Chart
- Utilitys
- Pavel Zamoshnikov
- Version: 2.20
- Aktualisiert: 10 März 2023
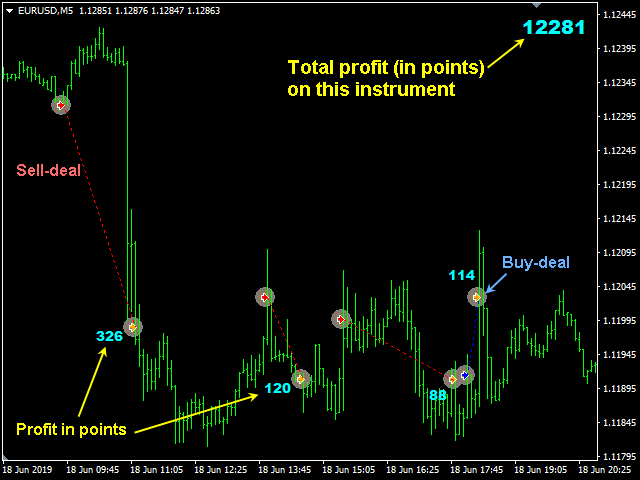
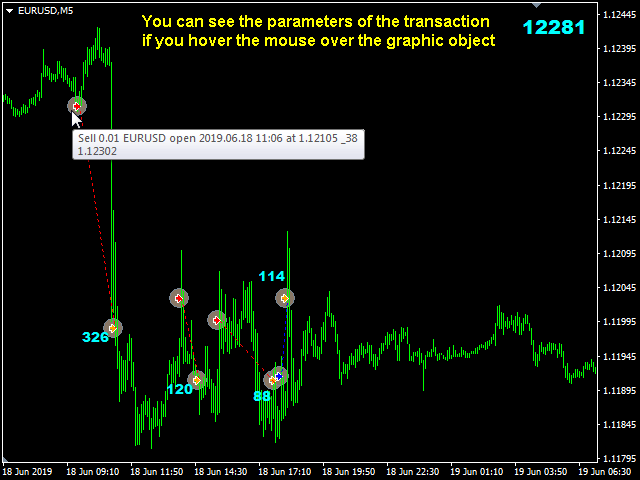
The script visually displays deals from CSV format reports on MT4 terminal charts.
It automatically recognizes popular formats:
- MQL5.com Trading Signals for MT4 / MT5 platforms
- MyFXBook service
Copy the report file to the <Data Folder>\MQL4\Files folder and run the script on any chart.
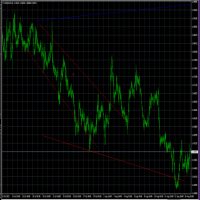
The script analyzes the CSV file, automatically creates new charts for all instruments that are found in the report, and draws the deals of each instrument on a separate chart.
The script additionally calculates and displays the profit/loss (in points) for each deal and the total profit for the entire trading time.
Parameters
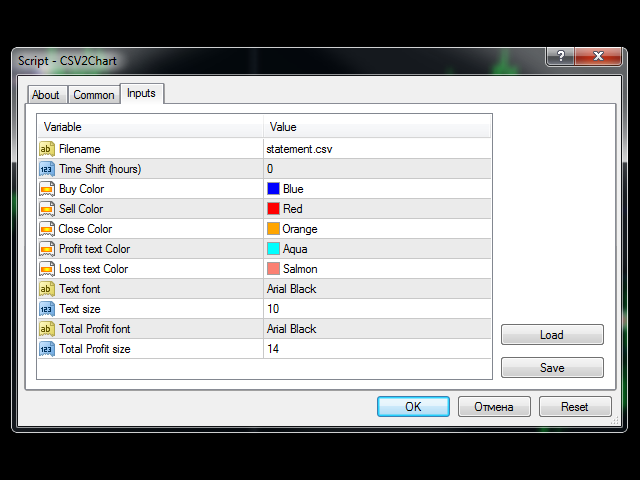
- Report File name - CSV file name with report. The file must be in the <Data Folder>\MQL4\Files folder.
- Time Shift (hours) - your broker's time offset relative to the report (in hours).
If the deals on the chart are "hanging" in the air, adjust this parameter - Buy Color - arrow color for Buy deals
- Sell Color - arrow color for Sell deals
- Close Color - arrow color for closing deals
- Profit text Color - color of profit text
- Loss text Color - color of loss text
- Text font - font of profit/los
- Text size - font size
- Total Profit font - font for displaying the total profit/loss in points
- Total Profit size - font size for total profit/loss in points

















Классный скрипт! Очень помогает в анализе торговли и сохранении истории.