• Übersicht
  • Bewertungen
  • Diskussion

AIS Linear Dynamic System MT4

Betrachten wir die Art der Preisänderungen auf dem Forex-Markt, ohne auf die Gründe zu achten, warum diese Änderungen auftreten. Mit diesem Ansatz können wir die Hauptfaktoren identifizieren, die die Preisbewegung beeinflussen.
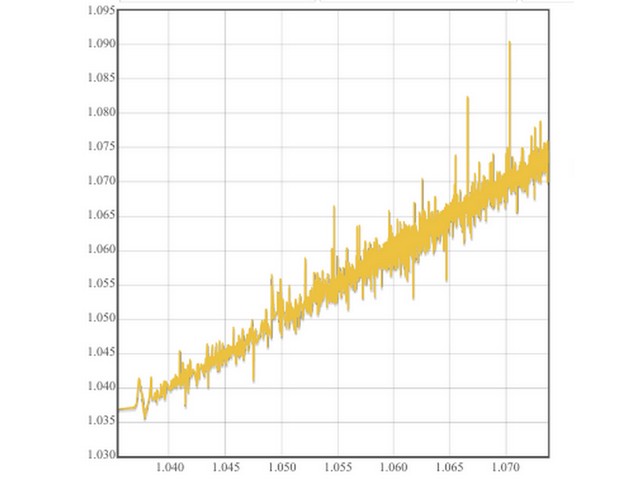
Nehmen wir zum Beispiel die Eröffnungskurse von Barren für das Währungspaar EUR-USD und den Zeitraum für das erste Halbjahr. Für diese Preise konstruieren wir das Lameray-Diagramm (Abbildung 1).
In diesem Diagramm ist ersichtlich, dass die Preisbewegung grundsätzlich nach einer linearen Gleichung erfolgt. Um die Parameter dieser Gleichung zu bestimmen, können Sie die Methode der kleinsten Quadrate verwenden. In diesem speziellen Beispiel hatte die Gleichung zum Ändern des Eröffnungspreises die folgende Form:
Open [i] = 0,99989 * Open [i + 1] +0,00013.
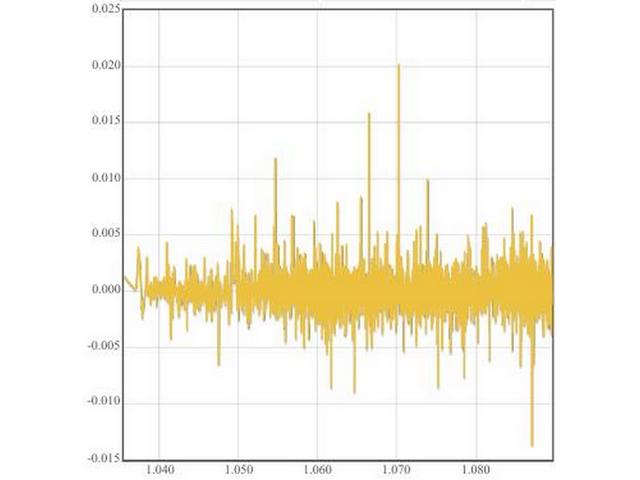
Lassen Sie uns überprüfen, wie gut diese Gleichung die Preisbewegung beschreibt. Dazu entfernen wir die lineare Komponente und analysieren die Residuen (Abbildung 2).
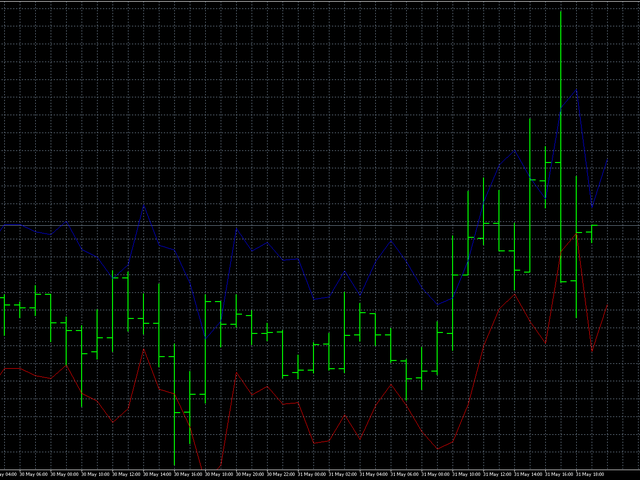
Wie aus der Abbildung hervorgeht, sind diese Rückstände ziemlich chaotisch, und wenn wir sie als Rauschen betrachten, können wir ein ziemlich einfaches System zur Vorhersage des Eröffnungskurses des nächsten Balkens erhalten, das in Form dieses Indikators implementiert wird.
Empfohlene Produkte
TrendPlus
Sivakumar Subbaiya
4 (13)
Trend Plus   Trendplus  Indicator   Time Frame: Suitable for any time frame.  Purpose: Trend Prediction. Blue and red candle indicate the buy and sell call respectively. Buy: When the blue candle is formed buy call is initiated. close the buy trades when the next red candle will formed.   Sell: When the Red candle is formed Sell call is initiated. close the Sell trades when the next blue candle will formed.   Happy trade!!
FREE
This indicator shows the latest untouched support and resistance as horizontal lines. The indicator can show support/resistance from higher timeframes. With this indicator you can e.g. easily see the support/resistance of the timeframes H4, D1 and W1 on a H1 chart, which can be a big advantage while time your entry on H1. This is the FREE version of the indicator: Support Resistance Multi Time Frame The free version works only on EURUSD and GBPUSD! Parameters referenceTF: the timeframe from wh
FREE
The indicator allows you to trade binary options. The recommended time frame is М1 and the expiration time is 1,2,3 minutes. The indicator suitable for auto and manual trading. A possible signal is specified as a arrows above/under a candle. You should wait until the candle closes! Arrows are not re-painted Trade sessions: TOKYO section (Half-end) Currency pairs: USD/JPY Working time frame: M1 Expiration time: 1,2,3 minutes. The indicator also shows good results when using the martingale strateg
FREE
Trend Ray
Andriy Sydoruk
The indicator shows the potential trend direction by cyclical-wave dependence. Thus, all the rays of the intersection will be optimal rays, in the direction of which the price is expected to move, taking into account the indicator period. Rays can be used as a direction for potential market movement. But we must not forget that the approach must be comprehensive, the indicator signals require additional information to enter the market.
Pivot Point Fibo RSJ ist ein Indikator, der die Unterstützungs- und Widerstandslinien des Tages mithilfe von Fibonacci-Kursen verfolgt. Dieser spektakuläre Indikator erzeugt bis zu 7 Unterstützungs- und Widerstandsebenen durch Pivot Point unter Verwendung von Fibonacci-Kursen. Es ist fantastisch, wie die Preise jedes Niveau dieser Unterstützung und dieses Widerstands respektieren, wo es möglich ist, mögliche Einstiegs- / Ausstiegspunkte einer Operation zu erkennen. Merkmale Bis zu 7 Unter
FREE
MegaTrends
Sivakumar Subbaiya
1 (1)
Megatrends  Indicator   Time Frame: Suitable for any time frame.  Purpose: Trend Prediction. Blue and red color indicate the buy and sell call respectively. Buy: When the blue line is originating it is opened buy call. Sell: When the Red line is origination it is opened sell call Happy trade!! this indicator is suitable for all time frame, but our recommended time frame to use 1hour and 4 hours, suitable for any chart.
FREE
Trend arrow Indicator
NGUYEN NGHIEM DUY
3.33 (9)
Trend arrow Indicator is an arrow Indicator used as an assistant tool for your trading strategy. The indicator analyzes the standard deviation of bar close for a given period and generates a buy or sell signals if the deviation increases. It good to combo with Martingale EA to follow Trend and Sellect Buy Only/Sell Only for EA work Semi-Automatic. You can use this  Indicator with any EAs in my Products.
FREE
UPD1 X00 Levels
Vitaliy Kuznetsov
5 (8)
Der Indikator zeigt   runde Level   auf dem Chart an. Sie werden auch   psychologische , Bank- oder Major Player Level genannt. Auf diesen Niveaus gibt es einen echten Kampf zwischen Bullen und Bären, die Anhäufung vieler Orders, was zu einer erhöhten Volatilität führt. Der Indikator passt sich   automatisch   an jedes Instrument und jeden Zeitrahmen an. Wenn das   Level 80   durchbrochen und dann getestet ist,   kaufen wir . Wenn   Level 20   durchbrochen und dann getestet wird,   verkaufen wi
FREE
Check my paid tools they work great and I share Ea's based on them for free please r ate The Dual Timeframe RSI (Relative Strength Index) indicator is a novel trading tool that allows traders to monitor RSI readings from two different timeframes on a single chart. This dual perspective enables traders to identify potential trend confirmations and divergences more effectively. For instance, a trader might use a 1-hour RSI alongside a daily RSI to ensure that short-term trades align with the bro
FREE
MTF Stochastic and RSI
Georgiy Gazaryan
5 (2)
A simple but effective helper that will allow you to track both global and local market trends. The indicator combines the work of two oscillators: Stochastic and RSI. Both indicators can be set to any timeframe. Advantages of Use Multitimeframe - you can adjust both indicators to the desired timeframes. To obtain the entry points, you can use the Elder's triple screen system. Highly customizable - you can configure not only the parameters of the indicators, but also their appearance (color an
FREE
Alpha Trend Zeichen ist seit langem ein sehr beliebtes Handelstool in unserem Unternehmen. Es kann unser Handelssystem überprüfen und Handelssignale klar anzeigen, und die Signale werden nicht driften. Hauptfunktionen: Anhand der Marktanzeige aktiver Bereiche können Indikatoren intuitiv bestimmen, ob der aktuelle Markttrend zu einem Trendmarkt oder zu einem volatilen Markt gehört. Und betreten Sie den Markt gemäß den Indikatorpfeilen, mit grünen Pfeilen für Kauf und roten Pfeilen für Verk
Price action finder
Siarhei Vashchylka
5 (5)
The Price Action Finder indicator is an indicator of entry points, which is designed to search and display patterns of the Price Action system on a price chart. The indicator is equipped with a system of trend filters, as well as a system of alerts and push notifications. Manual (Be sure to read before purchasing) | Version for MT5 Advantages 1. Patterns: Pin bar, Outside bar, Inside bar, PPR, Power bar, Hanging man, Inverted hammer 2. Pattern filtering system. Removes countertrend patterns fro
WH DrawFib Pro MT4
Wissam Hussein
5 (5)
Sind Sie es leid, Fibonacci-Levels manuell in Ihre Diagramme einzutragen? Suchen Sie nach einer bequemen und effizienten Möglichkeit, wichtige Unterstützungs- und Widerstandsniveaus in Ihrem Handel zu identifizieren? Suchen Sie nicht weiter!   Wir stellen Ihnen DrawFib Pro vor, den ultimativen MetaTrader 4-Indikator, der automatische   Fibonacci-   Level   durchführt       Es greift auf Ihre Diagramme zurück und gibt rechtzeitige Warnungen aus, wenn diese Werte überschritten werden. Mit DrawFib
FREE
LineBreakMT4
Nattadecha Tangpakinwat
Key Features: Type of Indicator: Line Break Chart Indicator Usage: Identifying trend reversals and potential market turning points. Input Parameters: The primary input parameter is 'Lines_Break,' which represents the number of lines the price needs to move to create a new line in the opposite direction. How it works: The indicator draws green and red histogram bars to represent the line break chart. Green bars indicate an upward trend, and red bars indicate a downward trend. The indicator calcul
FREE
KT Horizontal Lines MT4
KEENBASE SOFTWARE SOLUTIONS
In MetaTrader, plotting multiple   horizontal lines   and then tracking their respective price levels can be a hassle. This indicator automatically plots multiple horizontal lines at equal intervals for setting price alerts, plotting support and resistance levels, and other manual purposes. This indicator is suitable for Forex traders who are new and looking for chances to make quick profits from buying and selling. Horizontal lines can help traders find possible areas to start trading when the
Necessary for traders: tools and indicators Waves automatically calculate indicators, channel trend trading Perfect trend-wave automatic calculation channel calculation , MT4 Perfect trend-wave automatic calculation channel calculation , MT5 Local Trading copying Easy And Fast Copy , MT4 Easy And Fast Copy , MT5 Local Trading copying For DEMO Easy And Fast Copy , MT4 DEMO Easy And Fast Copy , MT5 DEMO The homeopathic indicator is also called the CCI indicator. The CCI indicator was propos
FREE
If you are good at trading at levels This indicator is all you need levels to manage your trades Market is usually follow current trend when break out some levels or reverse Trade at the Institutional traders level with the best supply and demand zone indicator available in MT4 and MT5 The Secret Profit Levels Signals indicator for MT4 is a complete trading system that provides traders with the entry price and 2 take profit levels. Technical analysts use support and resistance levels to iden
Two Period RSI
Libertas LLC
5 (4)
Two Period RSI compares long-term and short-term RSI lines, and plots a fill between them for improved visualization. Fill is colored differently according to an uptrend (short period RSI above long period RSI) or a downtrend (short period RSI below long period RSI). Short-term RSI crossing long-term RSI adds a more robust trend confirmation signal than using single period RSI alone. This is a small tool to help visualize and confirm RSI trends. We hope you enjoy! Looking for RSI alerts? You can
FREE
Super Reversal Pattern
Parfait Mujinga Ndalika
Super Reversal Pattern Indicator Unlock the power of advanced pattern recognition with our Super Reversal Pattern Indicator. Designed for traders seeking precision and reliability, this indicator identifies one of the most effective reversal patterns in technical analysis, offering a significant edge in your trading strategy. Key Features: Non-Repainting Accuracy: Enjoy the confidence of non-repainting technology. Once a Super Reversal Pattern is detected, it remains static, providing consis
OrderBlock TS Roman
Vladislav Vlastovskii
3.8 (5)
Индикатор строит блоки заказов (БЗ) по торговой системе (ТС) Романа. Поиск блоков осуществляется одновременно на двух таймфремах: текущем и старшем (определяемым в настройках). Для оптимизации и игнорирования устаревших блоков в настройках задается ограничение количества дней в пределах которых осуществляется поиск блоков. Блоки строятся по правилам ТС состоящем из трех шагов: какую свечу вынесли (что?); какой свечой вынесли (чем?); правило отрисовки (как?).
FREE
Discover the power of precision and efficiency in your trading with the " Super Auto Fibonacci " MT4 indicator. This cutting-edge tool is meticulously designed to enhance your technical analysis, providing you with invaluable insights to make informed trading decisions. Key Features: Automated Fibonacci Analysis: Say goodbye to the hassle of manual Fibonacci retracement and extension drawing. "Super Auto Fibonacci" instantly identifies and plots Fibonacci levels on your MT4 chart, saving you tim
FREE
The indicator detects and displays 3 Drives harmonic pattern (see the screenshot). The pattern is plotted by the extreme values of the ZigZag indicator (included in the resources, no need to install). After detecting the pattern, the indicator notifies of that by a pop-up window, a mobile notification and an email. The indicator highlights the process of the pattern formation and not just the complete pattern. In the former case, it is displayed in the contour triangles. After the pattern is com
Exclusive Stairs   is a trend indicator for the MetaTrader 4 platform. Its operation algorithm is based on moving averages, processed by special filters and price smoothing methods. This allows the   Exclusive Stairs   to generate signals much earlier than the conventional Moving Average. This indicator is suitable both for scalpers when used on the smaller timeframes and for traders willing to wait for a couple of days to get a good trade. Exclusive Stairs  for the MetaTrader 5 terminal :  http
Necessary for traders: tools and indicators Waves automatically calculate indicators, channel trend trading Perfect trend-wave automatic calculation channel calculation , MT4 Perfect trend-wave automatic calculation channel calculation , MT5 Local Trading copying Easy And Fast Copy , MT4 Easy And Fast Copy , MT5 Local Trading copying For DEMO Easy And Fast Copy , MT4 DEMO Easy And Fast Copy , MT5 DEMO Can set the cycle for other varieties of K line graph covered this window, fluctuations obse
FREE
Forex Indicator HTF Ichimoku for MT4 Ichimoku indicator is   one of the most powerful trend indicators .  H TF means -   H igher Time Frame This indicator is excellent for Trend Traders as well as combination with Price Action entries. HTF Ichimoku  Indicator allows you to attach Ichimoku from Higher time frame to your current chart. Up trend   - red line above blue one (and both lines are above cloud) /   Down trend   - red line below blue one  (and both lines are below cloud) Open BUY orders
Necessary for traders: tools and indicators Waves automatically calculate indicators, channel trend trading Perfect trend-wave automatic calculation channel calculation , MT4 Perfect trend-wave automatic calculation channel calculation , MT5 Local Trading copying Easy And Fast Copy , MT4 Easy And Fast Copy , MT5 Local Trading copying For DEMO Easy And Fast Copy , MT4 DEMO Easy And Fast Copy , MT5 DEMO Strongly recommend trend indicators,   automatic calculation of wave standard   and   MT5 ve
FREE
Follow The Line
Oliver Gideon Amofa Appiah
4.07 (14)
FOLLOW THE LINE GET THE FULL VERSION HERE: https://www.mql5.com/en/market/product/36024 This indicator obeys the popular maxim that: "THE TREND IS YOUR FRIEND" It paints a GREEN line for BUY and also paints a RED line for SELL.  It gives alarms and alerts of all kinds. IT DOES NOT REPAINT and can be used for all currency pairs and timeframes. Yes, as easy and simple as that. Even a newbie can use it to make great and reliable trades. NB: For best results, get my other premium indicators for more
FREE
Free automatic Fibonacci is an indicator that automatically plots a Fibonacci retracement based on the number of bars you select on the BarsToScan setting in the indicator. The Fibonacci is automatically updated in real time as new highest and lowest values appears amongst the selected bars. You can select which level values to be displayed in the indicator settings. You can also select the color of the levels thus enabling the trader to be able to attach the indicator several times with differe
FREE
Pair Direction
Mr Nukool Chanchingchit
5 (1)
What is a tool ? This indicator use for forecast direction of the 28 pairs, Calculates from multiple pairs and timeframes and present by percentage as 70-79% , 80-89% , 90-100% is a little, medium and strong trend. How to use Place the indicator on any pair and any timeframe. Pair   : Any Timeframe   : Any Input Parameter No Visit my products Target Profit Magic Target Profit All The Profit Tracker Currency Scoring Pair Direction
FREE
Indikator. "Indikatorwelle oder Indikator Ma". Unter Verwendung von 23 Standardindikatoren und dem Algorithmus des Autors werden die Einkäufe (von 0 bis +100) und die Verkäufe (von 0 bis -100) berechnet. Dann zeichnet der "Wave Indicator" mit den berechneten Levels eine Welle mit 21 gleitenden Durchschnitten. Die Wellenzahl entspricht der Mittelungsperiode der berechneten Pegel. Wellen Nr. 1 - 7 sich schnell bewegende Durchschnitte Wellen von Nr. 8 bis 14 gleitender Durchschnitte Well
Käufer dieses Produkts erwarben auch
Gann Made Easy
Oleg Rodin
4.83 (93)
Gann Made Easy ist ein professionelles und einfach zu bedienendes Forex-Handelssystem, das auf den besten Handelsprinzipien unter Verwendung der Theorie von Mr. basiert. W.D. Gann. Der Indikator liefert genaue KAUF- und VERKAUFSsignale, einschließlich Stop-Loss- und Take-Profit-Levels. Mit PUSH-Benachrichtigungen können Sie auch unterwegs handeln. Bitte kontaktieren Sie mich nach dem Kauf! Ich werde meine Handelstipps und tolle Bonusindikatoren kostenlos mit Ihnen teilen! Wahrscheinlich haben Si
Bull versus Bear
Mohamed Hassan
4.54 (13)
Black Friday Mega Sale!  For this week only,   Bull vs Bear   is   50%   OFF ! But act fast because this epic deal will disappear when the clock strikes midnight this   Friday! Official Release price of $65 for the first 90 /100   copies ( 10  copies left). Next price is $120 !  Send us a message after your purchase to receive more information on how to get your  BONUS  for FREE  that works in great combination with Bull vs Bear ! Bull versus Bear is an easy-to-use Forex indicator that gi
- Real price is 80$ - 40% Discount ( It is 49$ now ) Contact me for instruction, add group and any questions! Related Products:  Bitcoin Expert , Gold Expert Introduction The breakout and retest strategy is traded support and resistance levels. it involves price breaking through a previous level.  The break and retest strategy is designed to help traders do two main things, the first is to avoid false breakouts. Many false breakouts start with a candlestick that breaks out of a level but ends w
Golden Trend Indicator
Noha Mohamed Fathy Younes Badr
5 (4)
Golden Trend indicator  is The best indicator for predicting trend movement this indicator never lags and never repaints and never back paints    and give  arrow buy and sell    before the candle appear  and it will help you and  will make your trading decisions clearer its work on all currencies and  gold and crypto and all time frame This unique  indicator uses very secret algorithms to catch the  trends, so you can trade using this indicator and see the trend clear on charts  manual guide and
FX Volume
Daniel Stein
4.58 (33)
Verschaffen Sie sich einen echten Vorteil am Forex mit FX Volume: Dem ultimativen Volumenindikator FX Volume ist der erste und einzige Volumenindikator, der die echte Marktstimmung aus der Sicht eines Insiders aufzeigt. FX Volume bietet einzigartige Einblicke in die Positionierung von institutionellen Marktteilnehmern und Brokern und ermöglicht es Ihnen, mit der Voraussicht zu handeln, die normalerweise den großen Akteuren vorbehalten ist. Verabschieden Sie sich von den verzögerten COT-Bericht
Trins
Ivan Simonika
One of the main definitions for monitoring the currency market is the trend. The Trins indicator is designed to display the trend in a visual form. Trend is a stable direction of price movement. To find it, the indicator uses calculations designed to smooth out sharp fluctuations that do not affect the overall picture of price movement. The trend can be increasing (bullish trend) and decreasing (bearish trend). In most cases, the trend is growing for a long time and drops sharply, but in all
MetaBands M4
Vahidreza Heidar Gholami
5 (3)
MetaBands verwendet leistungsstarke und einzigartige Algorithmen, um Kanäle zu zeichnen und Trends zu erkennen, sodass es Tradern potenzielle Punkte für den Einstieg und Ausstieg aus Trades bieten kann. Es ist ein Kanalindikator sowie ein leistungsstarker Trendindikator. Es umfasst verschiedene Arten von Kanälen, die einfach durch Verwendung der Eingabeparameter zusammengeführt werden können. MetaBands verwendet alle Arten von Warnmeldungen, um Benutzer über Marktereignisse zu informieren. Funkt
FX Power MT4 NG
Daniel Stein
5 (14)
Schöpfen Sie die volle Leistung von FX Power NG aus: Dem ultimativen Währungsstärkemesser Seit mehr als acht Jahren unterstützt FX Power Händler weltweit mit zuverlässigen, präzisen Analysen der Währungsstärke. FX Power NG hebt dieses bewährte Tool nun auf die nächste Stufe und bietet fortschrittliche Funktionen, die Ihnen unübertroffene Genauigkeit, Anpassungsfähigkeit und Einblicke in Ihr Trading ermöglichen. Was macht FX Power NG zu einem Muss für ernsthafte Trader? FX Power NG baut auf a
Trend Screener
STE S.S.COMPANY
4.81 (89)
Trendindikator, bahnbrechende, einzigartige Lösung für Trendhandel und -filterung mit allen wichtigen Trendfunktionen in einem Tool! Es handelt sich um einen 100 % nicht neu zu malenden Multi-Timeframe- und Multi-Währungs-Indikator, der für alle Symbole/Instrumente verwendet werden kann: Forex, Rohstoffe, Kryptowährungen, Indizes und Aktien. ZEITLICH BEGRENZTES ANGEBOT: Der Support- und Resistance-Screener-Indikator ist für nur 50 $ und lebenslang verfügbar. (Ursprünglicher Preis 250 $) (Angebot
Trend Punch
Mohamed Hassan
4.95 (22)
Black Friday Mega Sale!  For this week only,   Trend Punch   is   50%   OFF ! But act fast because this epic deal will disappear when the clock strikes midnight this   Friday! This indicator is unstoppable when combined with our other indicator called  Support & Resistance . After purchase, send us a message and you will get it   for  FREE as a BONUS! Introducing Trend Punch , the revolutionary forex trend indicator that will transform the way you trade! Trend Punch is uniquely designed to pr
Atomic Analyst
Issam Kassas
5 (2)
Zunächst einmal ist es erwähnenswert, dass dieser Handelsindikator nicht neu malt, nicht neu zeichnet und keine Verzögerung aufweist, was ihn sowohl für manuellen als auch für Roboterhandel ideal macht. Benutzerhandbuch: Einstellungen, Eingaben und Strategie. Der Atom-Analyst ist ein PA-Preisaktionsindikator, der die Stärke und das Momentum des Preises nutzt, um einen besseren Vorteil auf dem Markt zu finden. Ausgestattet mit fortschrittlichen Filtern, die helfen, Rauschen und falsche Signale z
Scalper Inside PRO
Alexey Minkov
4.73 (56)
An exclusive indicator that utilizes an innovative algorithm to swiftly and accurately determine the market trend. The indicator automatically calculates opening, closing, and profit levels, providing detailed trading statistics. With these features, you can choose the most appropriate trading instrument for the current market conditions. Additionally, you can easily integrate your own arrow indicators into Scalper Inside Pro to quickly evaluate their statistics and profitability. Scalper Inside
TPSproTREND PrO
Roman Podpora
4.79 (19)
TPSpro TREND PRO   ist ein Trendindikator, der den Markt automatisch analysiert und Informationen über den Trend und jede seiner Änderungen liefert sowie Signale für den Einstieg in Geschäfte ohne Neuzeichnung gibt! Der Indikator verwendet jede Kerze und analysiert sie separat. bezieht sich auf verschiedene Impulse – Aufwärts- oder Abwärtsimpuls. Exakte Einstiegspunkte in Transaktionen für Währungen, Krypto, Metalle, Aktien, Indizes! Version MT5                   VOLLSTÄNDIGE BESCHREIBUNG DES
Entdecken Sie FX Levels: Ihr ultimativer Unterstützungs- und Widerstandsindikator für den Handelserfolg FX Levels ist mehr als nur ein Unterstützungs- und Widerstandsindikator; es ist ein Wendepunkt für ernsthafte Händler, die Präzision, Zuverlässigkeit und nahtlose Funktionalität für alle Handelssymbole wollen, egal ob Währungspaare, Indizes, Aktien oder Rohstoffe. FX Levels basiert auf der bewährten Lighthouse-Methode und wurde mit dynamischer Echtzeit-Anpassungsfähigkeit erweitert. FX Level
Dynamic Forex28 Navigator
Bernhard Schweigert
5 (2)
Dynamic Forex28 Navigator – Das Forex-Handelstool der nächsten Generation AKTUELL 49 % RABATT. Dynamic Forex28 Navigator ist die Weiterentwicklung unserer seit langem beliebten Indikatoren und vereint die Leistung von drei in einem: Advanced Currency Strength28 Indicator (695 Bewertungen) + Advanced Currency IMPULSE mit ALERT (520 Bewertungen) + CS28 Combo Signals (Bonus) Details zum Indikator https://www.mql5.com/en/blogs/post/758844 Was bietet der Strength Indicator der nächsten Generation?
TrendMaestro
Stefano Frisetti
5 (3)
note: this indicator is for METATRADER4, if you want the version for METATRADER5 this is the link:  https://www.mql5.com/it/market/product/108106 TRENDMAESTRO ver 2.4 TRENDMAESTRO recognizes a new TREND in the bud, he never makes mistakes. The certainty of identifying a new TREND is priceless. DESCRIPTION TRENDMAESTRO identifies a new TREND in the bud, this indicator examines the volatility, volumes and momentum to identify the moment in which there is an explosion of one or more of these data a
Hinterlassen Sie nach dem Kauf einen Kommentar, um 4 hochwertige Indikatoren als Bonus zu erhalten. Der Chart Patterns All-in-One Indikator hilft Tradern, verschiedene Chartmuster, die häufig in der technischen Analyse verwendet werden, zu visualisieren. Dieser Indikator unterstützt die Identifizierung möglicher Marktbewegungen, garantiert jedoch keine Rentabilität. Es wird empfohlen, den Indikator vor dem Kauf im Demomodus zu testen. Aktuelles Angebot : 50 % Rabatt auf den "Chart Patterns All i
Gold Stuff
Vasiliy Strukov
4.87 (243)
Gold Stuff-Ein Trendindikator, der speziell für Gold entwickelt wurde, kann auch auf allen Finanzinstrumenten verwendet werden. Der Indikator wird nicht neu gezeichnet und verzögert sich nicht. Empfohlener Zeitrahmen H1. Nach diesem Indikator geschrieben EA Gold Stuff Berater, können Sie es in meinem Profil finden. WICHTIG! Kontaktieren Sie mich sofort nach dem Kauf, um Anweisungen und Bonus zu erhalten!   Sie können eine kostenlose Kopie unseres Strong Support- und Trendscanner-Indikators
Derzeit 20% Rabatt! Die beste Lösung für jeden Neueinsteiger oder Expert Händler! Dieses Dashboard arbeitet mit 28 Währungspaaren. Es basiert auf 2 unserer Hauptindikatoren (Advanced Currency Strength 28 und Advanced Currency Impulse). Es bietet einen hervorragenden Überblick über den gesamten Forex-Markt. Es zeigt die Werte der Advanced Currency Strength, die Veränderungsrate der Währungen und die Signale für 28 Devisenpaare in allen (9) Zeitrahmen. Stellen Sie sich vor, wie sich Ihr Hande
Quantum Breakout Indicator PRO
Bogdan Ion Puscasu
4.96 (26)
Wir stellen vor       Quantum Breakout PRO   , der bahnbrechende MQL5-Indikator, der die Art und Weise, wie Sie mit Breakout-Zonen handeln, verändert!   Quantum Breakout PRO   wurde von einem Team erfahrener Händler mit über 13 Jahren Handelserfahrung entwickelt und soll Ihre Handelsreise mit seiner innovativen und dynamischen Breakout-Zonen-Strategie auf ein neues Niveau bringen. Der Quantum Breakout Indicator zeigt Ihnen Signalpfeile auf Breakout-Zonen mit 5 Gewinnzielzonen und Stop-Loss
KT Market Structure MT4
KEENBASE SOFTWARE SOLUTIONS
The KT Market Structure intelligently detects and displays Break of Structure (BOS) , Change of Character (CHoCH) , Equal Highs/Lows (EQL) , and various significant  swing high/low points using our proprietary algorithm for accurate pattern detection. It also offers advanced pattern analysis by effectively demonstrating the captured profit for each pattern. Features Accurate Pattern Detection: Our advanced algorithm analyzes multiple data points to ensure precise identification of market str
Connect Indicator
Sukunthakan Ngernbamrung
Connect Indicator is a tool used for connecting indicators between the MQL market and MT4. The connected indicators are made by our group and can be used for other applications, such as sending messages to the Line application or Telegram application. If you have any questions, please don't hesitate to ask us to receive support. Function and indicator buffer Buffer one is the high price of the previous candle. Buffer two is the high price of the previous candle. Usage To connect indicators to fu
Stratos Pali
Michela Russo
5 (1)
Stratos Pali Indicator   is a revolutionary tool designed to enhance your trading strategy by accurately identifying market trends. This sophisticated indicator uses a unique algorithm to generate a complete histogram, which records when the trend is Long or Short. When a trend reversal occurs, an arrow appears, indicating the new direction of the trend. Important Information Revealed Leave a review and contact me via mql5 message to receive My Top 5 set files for Stratos Pali at no cost! D
Order Block Hunter
Noha Mohamed Fathy Younes Badr
5 (9)
Order block hunter indicator is the best indicator for  hunt the order blocks that area where there has been a large concentration of limit orders waiting to be executed Order blocks are identified on a chart by observing previous price action and looking for areas where the price experienced significant movement or sudden changes in direction .This indicator does that for you by using very complicated codes and helps you to take the best areas To buy and sell because it make marks at the best a
Entry Arrow Alerts: Finds market entry opportunities then notifies you via mobile or desktop alerts The key features include: Conservative mode . One entry signal per direction. Ideal for the patient trader looking to capture longer term moves. Aggressive mode . Multiple possible entry signals per direction. Ideal for the active trader looking to capture multiple moves within the same trend. Trigger Line . Price entry line helps cut down on false signals. Display Window . Allows you to instantly
Trend Pulse
Mohamed Hassan
5 (5)
Black Friday Mega Sale!  For this week only, Trend Pulse is 50% OFF ! But act fast because this epic deal will disappear when the clock strikes midnight this Friday! Please contact me after purchase to immediately get your PDF strategy + documentation for Trend Pulse !  Introducing Trend Pulse , a unique and robust indicator capable of detecting bullish, bearish, and even ranging trends! Trend Pulse uses a special algorithm to filter out market noise with real precision. If the current sym
TakePropips Donchian Trend Pro
Eric John Pajarillaga Aldana
4.44 (16)
TakePropips Donchian Trend Pro   (MT4) ist ein leistungsstarkes und effektives Tool, das mithilfe des Donchian-Kanals automatisch die Richtung des Trends erkennt und Ihnen Handelssignale für den Ein- und Ausstieg liefert! Dieser Multifunktionsindikator umfasst einen Trendscanner, Handelssignale, ein statistisches Panel, einen Screener, Handelssitzungen und ein Dashboard für den Verlauf von Warnungen. Es wurde entwickelt, um Ihnen Handelssignale zu liefern und Ihnen Stunden beim Analysieren der C
Advanced Supply Demand
Bernhard Schweigert
4.91 (295)
Derzeit 33% Rabatt! Die beste Lösung für jeden Anfänger oder erfahrenen Händler! Dieser Indikator ist ein einzigartiges, qualitativ hochwertiges und erschwingliches Trading-Tool, da wir eine Reihe von proprietären Funktionen und eine neue Formel integriert haben. Mit diesem Update werden Sie in der Lage sein, doppelte Zeitrahmenzonen anzuzeigen. Sie können nicht nur einen höheren TF (Zeitrahmen) anzeigen, sondern sowohl den Chart-TF als auch den höheren TF: SHOWING NESTED ZONES. Alle Supply Dema
TPSpro RFI Levels
Roman Podpora
4.82 (22)
ANWEISUNGEN    Russland -    ENG    Die Empfehlung basiert auf dem Indikator -   TPSpro   TREND PRO -   Version MT5 Die wichtigsten Elemente in der Branche sind entweder in Zonen oder in der Fabrik enthalten, oder sie führen zu einer Lösung bei einem Kauf oder dem Verkauf eines anderen Instruments. Wenn viele Menschen ihre Rechte nicht auf dem Händlerkonto verschlüsseln, werden die Folgen nicht schnell genug sein. Ich habe es damit abgeschlossen, dass ich diese Folgen nun noch interpretieren un
Supply and Demand Dashboard PRO
Bernhard Schweigert
4.8 (20)
Derzeit 20% reduziert! Dieses Dashboard ist eine sehr leistungsfähige Software, die mit mehreren Symbolen und bis zu 9 Zeitrahmen arbeitet. Es basiert auf unserem Hauptindikator (Beste Bewertungen: Advanced Supply Demand ).   Das Dashboard gibt einen guten Überblick. Es zeigt: Gefilterte Angebots- und Nachfragewerte einschließlich der Zonenstärkebewertung, Pips-Abstände zu/und innerhalb von Zonen, Es hebt verschachtelte Zonen hervor, Es gibt 4 Arten von Alarmen für die gewählten Symbole in
Weitere Produkte dieses Autors
Die Auswahl der StopLoss- und TakeProfit-Stufen kann sich sehr stark auf die Gesamtperformance des Handels auswirken. Neben den offensichtlichen Parametern einer Transaktion - der Größe eines möglichen Gewinns oder wahrscheinlichen Verlusts - wirken sich die StopLoss- und TakeProfit-Werte auch auf die erwartete Dauer der Transaktion und die Rentabilität des Handels im Allgemeinen aus. Wenn Sie die optimale Transaktionsdauer bereits mithilfe des „ AIS-ODT “ -Skripts ermittelt haben, können Sie mi
FREE
Das Skript basiert auf der Simulation von Handelsgeschäften mit einem Zufallsgenerator. Auf diese Weise erhalten Sie auch bei gleichen Eingabeparametern völlig unterschiedliche Ergebnisse. Wenn Sie das Skript ausführen, wird ein Dialogfeld geöffnet, in dem Sie die gewünschten Werte für externe Variablen festlegen können. Im Block TradingOptions werden die grundlegenden Parameter definiert, die zur Simulation des Handels benötigt werden. StartBalance - legt die Anfangsgröße der Handelsbilanz fes
FREE
Das Skript basiert auf der Simulation von Handelsgeschäften mit einem Zufallsgenerator. Auf diese Weise erhalten Sie auch bei gleichen Eingabeparametern völlig unterschiedliche Ergebnisse. Wenn Sie das Skript ausführen, wird ein Dialogfeld geöffnet, in dem Sie die gewünschten Werte für externe Variablen festlegen können. Im Block  TradingOptions  werden die grundlegenden Parameter definiert, die zur Simulation des Handels benötigt werden. StartBalance  - legt die Anfangsgröße der Handelsbilanz
FREE
This script allows selecting the TakeProfit and StopLoss levels. It analyzes the history data, and then calculates the probability of reaching a given price level. How the script works Suppose you have a trading strategy and you want to select the TakeProfit and StopLoss levels. Run the script and set the parameter: Number of Bars - the average position holding time in bars. Once the script operation is complete, the AIS-PPL.csv file will be created in the Files folder in the terminal data cat
FREE
MinDeposit MT5
Aleksej Poljakov
3 (1)
The script analyzes the history of quotes and gives recommendations on the minimum deposit. The calculations take into account the variability of prices and the standard deviation. Margin requirements for the instrument are also taken into account. The result of the script is the minimum recommended deposit for trading the given currency pair.
FREE
Die Auswahl der StopLoss- und TakeProfit-Stufen kann sich sehr stark auf die Gesamtperformance des Handels auswirken. Neben den offensichtlichen Parametern einer Transaktion - der Größe eines möglichen Gewinns oder wahrscheinlichen Verlusts - wirken sich die StopLoss- und TakeProfit-Werte auch auf die erwartete Dauer der Transaktion und die Rentabilität des Handels im Allgemeinen aus. Wenn Sie die optimale Transaktionsdauer bereits mithilfe des „ AIS-ODT “ -Skripts ermittelt haben, können Sie mi
FREE
The script allows selecting the required 'Filter level' value of the AIS-MTF MT5 indicator. Run the script on the required chart and selected timeframe. Once its operation is complete, the HPS.csv file will be created in the Files folder. Open the file. You will see three columns. The 'Filter lvl' column represents the value of the 'Filter level' for the AIS-MTF indicator. Am. dev. - degree and direction of the indicator's deviation from the price level (sorted in ascending order). Negative valu
FREE
Dieses Skript ist so konzipiert, dass der Händler die durchschnittliche Dauer von Handelsgeschäften bestimmen kann, bei der das Verhältnis von möglichen Gewinnen und Verlusten optimal ist. Betrachten wir zunächst den allgemeinen Ansatz zur Bestimmung der optimalen Dauer von Handelsgeschäften. Wir führen die folgenden Variablen ein: R  - das Ergebnis der Transaktion; T  - die Zeit, während der die Transaktion offen war; W  - Die Zeit zwischen dem Abschluss der vorherigen und dem Öffnen der nächst
FREE
This script allows selecting the TakeProfit and StopLoss levels. It analyzes the history data, and then calculates the probability of reaching a given price level. How the script works Suppose you have a trading strategy and you want to select the TakeProfit and StopLoss levels. Run the script and set the parameter: Number of Bars - the average position holding time in bars. Once the script operation is complete, the AIS-PPL.csv file will be created in the Files folder in the terminal data cat
FREE
Dieses Skript ist so konzipiert, dass der Händler die durchschnittliche Dauer von Handelsgeschäften bestimmen kann, bei der das Verhältnis von möglichen Gewinnen und Verlusten optimal ist. Betrachten wir zunächst den allgemeinen Ansatz zur Bestimmung der optimalen Dauer von Handelsgeschäften. Wir führen die folgenden Variablen ein: R - das Ergebnis der Transaktion; T - die Zeit, während der die Transaktion offen war; W - Die Zeit zwischen dem Abschluss der vorherigen und dem Öffnen der nächsten
FREE
MinDeposit
Aleksej Poljakov
5 (1)
The script analyzes the history of quotes and gives recommendations on the minimum deposit. The calculations take into account the variability of prices and the standard deviation. Margin requirements for the instrument are also taken into account. The result of the script is the minimum recommended deposit for trading the given currency pair.
FREE
The script allows selecting the required 'Filter level' value of the AIS-MTF indicator. Run the script on the required chart and selected timeframe. Once its operation is complete, the HPS.csv file will be created in the Files folder. Open the file. You will see three columns. The 'Filter lvl' column represents the value of the 'Filter level' for the AIS-MTF indicator. Am. dev. - degree and direction of the indicator's deviation from the price level (sorted in ascending order). Negative values i
FREE
Mit dem Indikator AIS Correct Averages können Sie den Beginn einer Trendbewegung auf dem Markt festlegen. Eine weitere wichtige Eigenschaft des Indikators ist ein klares Signal für das Ende des Trends. Der Indikator wird nicht neu gezeichnet oder neu berechnet. Angezeigte Werte h_AE - Obergrenze des AE-Kanals l_AE - untere Grenze des AE-Kanals h_EC - Hoher vorhergesagter Wert für den aktuellen Balken l_EC - Niedriger vorhergesagter Wert für den aktuellen Balken Signale beim Arbeiten m
Der Indikator AIS Weighted Moving Average berechnet einen gewichteten gleitenden Durchschnitt und ermöglicht es Ihnen, den Beginn einer Trendmarktbewegung zu bestimmen. Die Gewichtskoeffizienten werden unter Berücksichtigung der Besonderheiten jedes Barrens berechnet. Auf diese Weise können Sie zufällige Marktbewegungen herausfiltern. Das Hauptsignal, das den Beginn eines Trends bestätigt, ist eine Richtungsänderung der Indikatorlinien und der Preis, der die Indikatorlinien kreuzt. WH (bl
Der AIS Advanced Grade Machbarkeitsindikator soll die Niveaus vorhersagen, die der Preis in der Zukunft erreichen könnte. Seine Aufgabe ist es, die letzten drei Balken zu analysieren und darauf basierend eine Prognose zu erstellen. Der Indikator kann für jeden Zeitrahmen und jedes Währungspaar verwendet werden. Mit Hilfe von Einstellungen erreichen Sie die gewünschte Qualität der Prognose. Vorhersagetiefe - legt die gewünschte Vorhersagetiefe in Balken fest. Es wird empfohlen, diesen Paramete
The indicator is designed to measure the price volatility. This allows determining the moments for opening or closing trade positions more accurately. High intensity of the market indicates the instability of its movement, but allows for better results. And, conversely, low intensity of the market indicates the stability of its movement. Parameters Bars to process - the number of bars to measure the price movements. A low value of this parameter allows determining the moments of rapid price mo
This indicator uses the Fibonacci p-numbers to smooth a price series. This allows combining the advantages of the simple and exponential moving averages. The smoothing coefficients depend on the level of the p-number, which is set in the indicator parameters. The higher the level, the greater the influence of the simple moving average and the less significant the exponential moving average. Parameters Fibonacci Numbers Order - order of the Fibonacci p-number, specified by trader. Valid values
The indicator is based on the analysis of interaction of two filters. The first filter is the popular Moving Average. It helps to identify linear price movements and to smooth minor price fluctuations. The second filter is the Sliding Median. It is a non-linear filter. It allows to filter out noise and single spikes in the price movement. A predictive filter implemented in this indicator is based on the difference between these filters. The indicator is trained during operation and is therefore
This indicator studies the price action as a combination of micro-trends. All micro-trends are analyzed and averaged. Price movement is filtered based on this averaging. IP_High and IP_Low (blue and red dashed lines) show the instantaneous price movement. They display the forecast only for the current price values, taking into account only the number of bars defined by the 'Filter level' parameter. SP_High and SP_Low (blue and red solid lines) smooth the price movements with respect to history.
Dieser Indikator implementiert einen einfachen linearen Glättungsprozess. Einer der Nachteile der exponentiellen Glättung ist das schnelle Abklingen des Signals. Dies macht es unmöglich, langfristige Trends in der Preisspanne vollständig zu verfolgen. Mit der linearen Glättung können Sie die Signalfilterung genauer und feiner einstellen. Der Indikator wird durch Auswahl von Parametern konfiguriert: LP - Mit diesem Parameter können Sie die Glättungszeit auswählen. Je größer sein Wert, dest
Dieser Indikator ist ein sequenzieller Hybridfilter, der auf einer Kombination von Median- und Gleitmittelwert-Eigenschaften basiert. Durch die Verwendung des Medianwerts können abnormale Ausreißer und zufällige Impulse in den Werten der Preisreihe herausgefiltert werden. Gleichzeitig wirkt sich der Medianfilter nicht auf den Trend der Preisbewegung aus und lässt ihn unverändert. Da der Medianfilter nichtlinear ist, werden die Werte mit einem einfachen gleitenden Durchschnitt gemittelt. Diese
Dieser Indikator ist eine Kombination aus zwei modifizierten Lanczos-Filtern. Der erste Filter dient zur Extrapolation des Preises. Auf der Grundlage vergangener Werte prognostiziert er eine mögliche Kursbewegung innerhalb der aktuellen Bar. Das heißt, es zeigt, was der Preis wäre, wenn die Trends der Vergangenheit unverändert blieben. Der zweite Filter zum Glätten und Mitteln der Preise innerhalb des Fensters, bestimmt durch den Filterpegel. Durch die Auswahl der Gewichte reagiert dieser Filter
Dieser Indikator ist informativer. Seine Arbeit basiert auf der Annahme, dass die Preisbewegung auf dem Markt als Rauschen einer bestimmten Farbe dargestellt werden kann, das von den Parametern der Verteilung der Preiswerte abhängt. Dadurch ist es möglich, die Preisänderung aus verschiedenen Blickwinkeln zu analysieren und die Preisbewegung als Rauschen einer bestimmten Farbe zu betrachten, Informationen über den aktuellen Stand des Marktes zu erhalten und eine Prognose über das Preisverhalten
Trotz einiger Nachteile des Indikators „ AIS Color Noise Filter “ erscheint die Idee, ihn zur Glättung der Preisreihen und der prognostizierten Preise zu verwenden, recht attraktiv. Dies hat mehrere Gründe: Erstens ermöglicht die Berücksichtigung mehrerer Lärmkomponenten die Erstellung einer Prognose auf Grundlage voneinander unabhängiger Faktoren, wodurch die Prognosequalität verbessert werden kann. zweitens verhalten sich die Rauschmerkmale der Preisreihen über die gesamte Historie hinweg rec
Sehr häufig werden bei der Untersuchung von Finanzreihen deren Glättungen angewendet. Mit der Glättung können Sie hochfrequente Komponenten entfernen - es wird angenommen, dass sie durch zufällige Faktoren verursacht werden und daher irrelevant sind. Die Glättung beinhaltet immer eine Art der Mittelung der Daten, bei der sich zufällige Änderungen in den Zeitreihen gegenseitig absorbieren. Zu diesem Zweck werden meist einfache oder gewichtete gleitende Durchschnittsmethoden sowie eine exponentie
Um langfristige und nicht zufällige Komponenten zu isolieren, muss nicht nur bekannt sein, um wie viel sich der Preis geändert hat, sondern auch, wie sich diese Änderungen ereignet haben. Mit anderen Worten - wir interessieren uns nicht nur für die Werte der Preisniveaus, sondern auch für die Reihenfolge, in der sich diese Niveaus gegenseitig ersetzen. Durch diesen Ansatz kann man langfristige und stabile Faktoren finden, die die Preisänderung zu einem bestimmten Zeitpunkt beeinflussen (oder be
Eine der leistungsstarken Analysemethoden ist die Modellierung von Finanzreihen mithilfe von Levy-Prozessen. Der Hauptvorteil dieser Prozesse besteht darin, dass mit ihnen eine Vielzahl von Phänomenen modelliert werden kann - von den einfachsten bis zu den komplexesten. Es genügt zu sagen, dass die Idee der fraktalen Preisbewegung auf dem Markt nur ein Sonderfall von Levy-Prozessen ist. Andererseits kann bei richtiger Auswahl der Parameter jeder Levy-Prozess als einfacher gleitender Durchschnit
Sehr oft steht der Händler vor der Aufgabe, das Ausmaß zu bestimmen, in dem sich der Preis in naher Zukunft ändern kann. Zu diesem Zweck können Sie die Johnson-Verteilungsart SB verwenden. Der Hauptvorteil dieser Verteilung besteht darin, dass sie auch mit einer kleinen Menge von akkumulierten Daten verwendet werden kann. Der empirische Ansatz zur Bestimmung der Parameter dieser Verteilung ermöglicht es Ihnen, das maximale und minimale Niveau des Preiskanals genau zu bestimmen. Diese Werte könn
Mit diesem Indikator können Sie die Wahrscheinlichkeit bestimmen, mit der der Preis das eine oder andere Niveau erreicht. Der Algorithmus ist recht einfach und basiert auf der Verwendung statistischer Daten zum Preisniveau eines bestimmten Währungspaares. Dank der gesammelten historischen Daten ist es möglich, das Ausmaß zu bestimmen, in dem sich der Preis während des aktuellen Balkens ändert. Trotz seiner Einfachheit kann dieser Indikator beim Handel von unschätzbarem Wert sein. Mit seiner Hil
Nachhaltige Ausschüttungen können zur Glättung von Finanzserien eingesetzt werden. Da zur Berechnung der Verteilungsparameter eine relativ tiefe Historie verwendet werden kann, kann eine solche Glättung in einigen Fällen im Vergleich zu anderen Methoden sogar noch effektiver sein. Die Abbildung zeigt beispielhaft die Verteilung der Eröffnungskurse des Währungspaares EUR-USD im ersten Halbjahr über zehn Jahre (Abbildung 1). Es sieht faszinierend aus, nicht wahr? Die Hauptidee, die diesem Ind
Auswahl:
Keine Bewertungen
Antwort auf eine Rezension