Candlestick Magnifying Glass
- Indikatoren
- Premier Global Holdings
- Version: 1.0
- Aktivierungen: 5
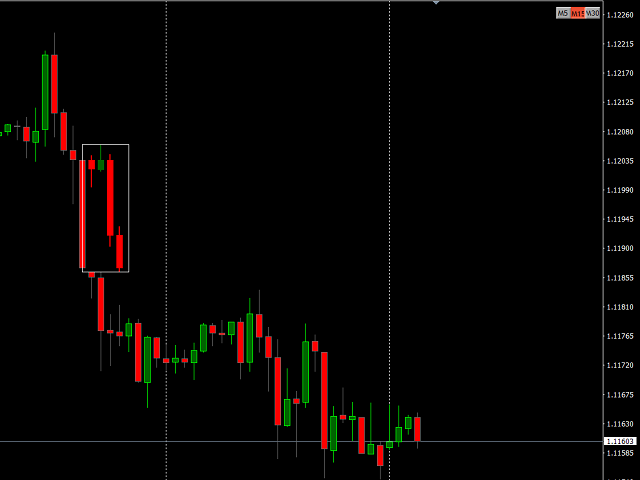
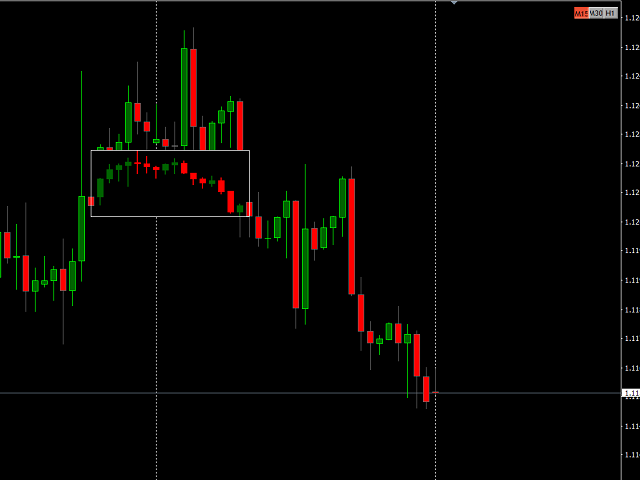
Needing to drill down further on a specific bar's behavior? No need to open another chart! The Magnifying Glass indicator can show the price action of a specific bar from a lower timeframe.
Just hover the cursor over the bar in question and one can see the lower timeframe candles that actually make up the bar on the chart. The candles display scaled to the actual bar that's hovered on to the bar's immediate right.
There is no input parameters, the selections are done entirely via buttons on the chart.
The available options are:
M5 chart:
- M1 (shows 5 M1 candles per bar)
M15 chart:
- M1 (shows 15 M1 candles per bar)
- M5 (shows 3 M5 candles per bar)
M30 chart:
- M1 (shows 30 M1 candles per bar)
- M5 (shows 6 M5 candles per bar)
- M15 (shows 2 M15 candles per bar)
H1 chart:
- M5 (shows 12 M5 candles per bar)
- M15 (shows 4 M15 candles per bar)
- M30 (shows 2 M30 candles per bar)
H4 chart:
- M15 (shows 16 M15 candles per bar)
- M30 (shows 8 M30 candles per bar)
- H1 (shows 4 H1 candles per bar)
D1 chart:
- H1 (shows 24 H1 candles per bar)
- H4 (shows 6 H4 candles per bar)
A few disclaimers...
1) The color scheme should adapt to the chart's colour scheme
2) The lower timeframe candles always appear as candlesticks, regardless of the chart as a line, bar, or candlestick chart
3) If the data on a lower timeframe is not available for the bar hovered on, no candles will display
