• Übersicht
  • Bewertungen (3)
  • Diskussion (27)
  • Neue Funktionen

Pair Power Matrix

3.67

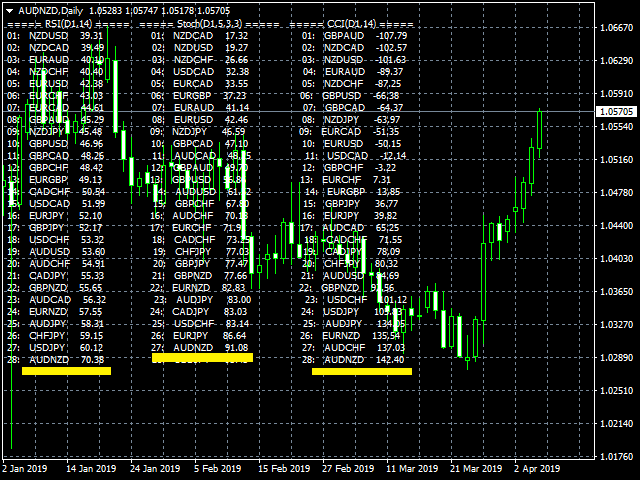
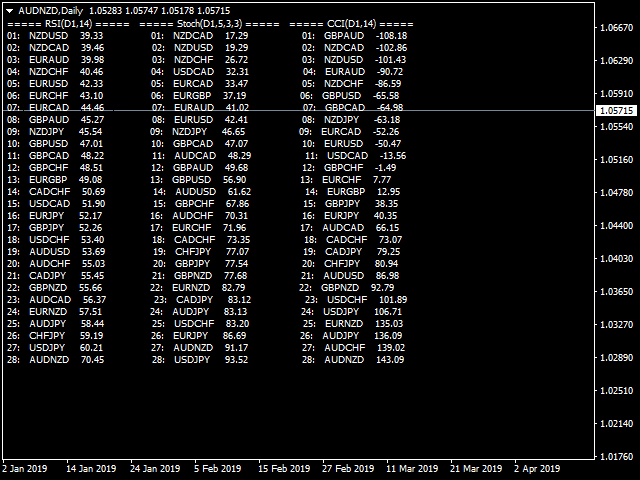
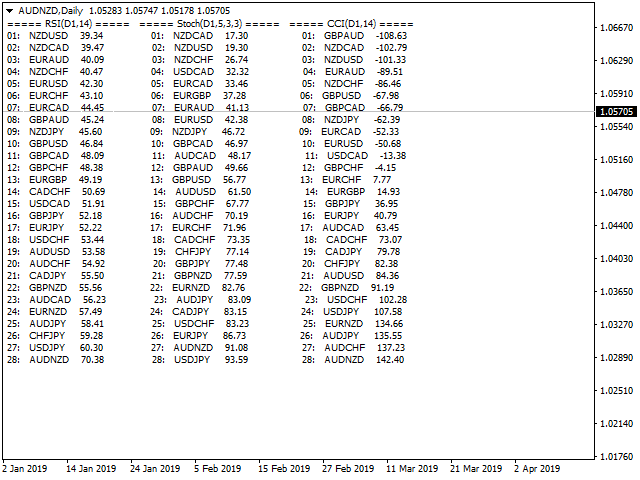
This indicator is designed to show the pair power of the major 28 paris with RSI,Stochostic,and CCI.

The power value is sorted from the weak to the strong.

  • The weaker pairs: the pairs occurs at least 2 times in the top 3 rows
  • The stronger pairs:  the pairs occurs at least 2 times in the bottom 3 rows

Users can add another symbol, so it can calculate 28+1 symbols.

A free EA with Pair Power Matrix --- https://www.mql5.com/en/blogs/post/732894
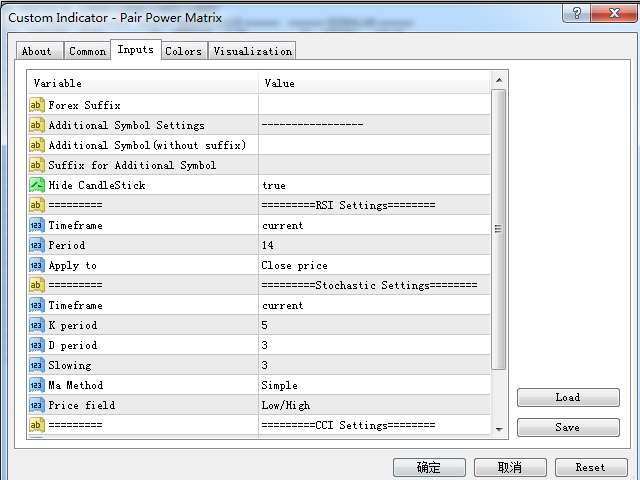
Inputs:

  • Forex Suffix -- the suffix of the major 28 forex symbols
  • Additional Symbol Settings
  • Additional Symbol(without suffix)  -- set the additional symbol,do not include the suffix.
  • Suffix for Additional Symbol -- set the suffix for the the additional symbol.
  • Hide CandleStick -- if it is true,the chart candlestick or bar will be hiden,namely invisible.

=========RSI Settings========

  • Timeframe -- the timeframe for RSI indicator
  • Period  -- the period for RSI indicator
  • Apply to -- the applied price for RSI indicator

=========Stochastic Settings========

  • Timeframe -- the timeframe for Stochastic indicator
  • K period -- the K period  for Stochastic indicator
  • D period -- the D period for Stochastic indicator
  • Slowing --  the slowing for Stochastic indicator
  • Ma Method -- the ma method for Stochastic indicator
  • Price field -- the price field for Stochastic indicator

=========CCI Settings========

  • Timeframe -- the timeframe for CCI indicator
  • Period -- the period for CCI indicator
  • Apply to -- the applied price for CCI indicator

=========Alert Settings========

  • Alert Period in Minute : send email or mobile notice as the period of the setting minutes.
  • Email -- if true, the indicator will send email with the strongest/weakest pairs as the period of the setting minutes.
  • Mobile -- if true the indicator will send mobile notice with the stronest/weakest pairs as the period of the setting minutes.


Bewertungen 3
4xplosion
1008
4xplosion 2020.04.14 02:03 
 

just got it and already proving well worth 5 stars....get it while still cheap!

Farooq Majoka
1817
Farooq Majoka 2019.04.12 07:22 
 

First trade off this indicator paid for one and half month rent in 6 hours. Trader's own method and the indicator use can yield good profits I feel !

Empfohlene Produkte
Currency StrengtT
Hafis Mohamed Yacine
What Is Currency StrengtT Indicator? A currency strengthT indicator is a graphical tool that shows the strength of a currency. Common indicators usually show the strength of a currency in relation to another currency, however, with some calculations it is possible to find the absolute strength of each individual currency. Therefore, a currency strength matrix indicator (or meter) is a tool that tries to express the absolute strength of a currency, so that you can compare this strength with
We present you the indicator "Candle closing counter", which will become your indispensable assistant in the world of trading. That’s why knowing when the candle will close can help: If you like to trade using candle patterns, you will know when the candle will be closed. This indicator will allow you to check if a known pattern has formed and if there is a possibility of trading. The indicator will help you to prepare for market opening and market closure. You can set a timer to create a p
Forex Gump
Andrey Kozak
2.83 (6)
Forex Gump is a fully finished semi-automatic trading system. In the form of arrows, signals are displayed on the screen for opening and closing deals. All you need is to follow the instructions of the indicator. When the indicator shows a blue arrow, you need to open a buy order. When the indicator shows a red arrow, you need to open a sell order. Close orders when the indicator draws a yellow cross. In order to get the most effective result, we recommend using the timeframes H1, H4, D1. There
Royal Dutch Skunk
Sayan Vandenhout
ROYAL DUTCH SKUNK USES THE TREND WAVE INDICATOR AND IT CAN IDENTIFY THE BEGINNING AND THE END OF A NEW WAVE TREND MOVEMENT. AS AN OSCILLATOR, THE INDICATOR IDENTIFIES THE OVERBOUGHT AND OVERSOLD ZONES. IT WORKS GREAT TO CATCH THE SHORT TERM PRICE REVERSALS AND USES A MARTINGALE STRATEGY TO CLOSE ALL TRADES IN PROFIT. USE DEFAULT SETTINGS ON H1 OR HIGHER TIME FRAME ON ANY PAIR FOR MORE ACCURATE TRADES WHY THIS EA : Smart entries calculated by 6 great strategies The EA can be run on even a $20000
MQLTA Currency Strength Matrix
MQL4 Trading Automation
4.38 (8)
Currency Strength Matrix (CSM) is an indicator that will show you the current strength of the major currencies in several timeframes, allowing you to sort the currencies for strength and spot possible trading setups. This indicator is ideal for scalping and in all those events of sudden big moves. How does it work? The CSM compares the value of the current moving average with the same moving average in the previous candle for all the 28 pairs and all 9 timeframes, producing a Matrix of Strengt
FREE
This product is a part of  ON Trade Waves Patterns Harmonic Elliot Wolfe you can test free version on EURJPY from this link  Wolf Waves Indicator E ntdecken Sie Wolf Waves - Ihr ultimatives Handelswerkzeug! Sind Sie auf der Suche nach einem leistungsstarken Tool, um Wolf Waves auf jedem Zeitrahmen leicht zu erkennen? Suchen Sie nicht weiter! Unser Wolf Waves-Indikator erledigt diese Aufgabe mühelos. Hier erfahren Sie, warum er perfekt für Sie ist: Hauptmerkmale: Automatische Erkennung: Unser
Master Scalping M1 ist ein innovativer Indikator, der einen Algorithmus verwendet, um den Trend schnell und genau zu bestimmen. Der Indikator berechnet den Zeitpunkt zum Öffnen und Schließen von Positionen, die Indikatoralgorithmen ermöglichen es Ihnen, die idealen Zeitpunkte für den Einstieg in einen Handel (Kauf oder Verkauf eines Vermögenswerts) zu finden, was den Erfolg von Transaktionen für die meisten Händler erhöht. Vorteile des Indikators: Einfach zu bedienen, überladen Sie das Diagramm
TWO PAIRS SQUARE HEDGE METER INDICATOR Try this brilliant 2 pairs square indicator It draws a square wave of the relation between your two inputs symbols when square wave indicates -1 then it is very great opportunity to SELL pair1 and BUY Pair2 when square wave indicates +1 then it is very great opportunity to BUY pair1 and SELL Pair2 the inputs are : 2 pairs of symbols         then index value : i use 20 for M30 charts ( you can try other values : 40/50 for M15 , : 30 for M30 , : 10 for H1 ,
KT Renko Patterns MT4
KEENBASE SOFTWARE SOLUTIONS
2.33 (3)
KT Renko Patterns scans the Renko chart brick by brick to find some famous chart patterns that are frequently used by traders across the various financial markets. Compared to the time-based charts, patterns based trading is easier and more evident on Renko charts due to their uncluttered appearance. KT Renko Patterns features multiple Renko patterns, and many of these patterns are extensively explained in the book titled Profitable Trading with Renko Charts by Prashant Shah. A 100% automate
This indicator Master XR indicator.Indicator displays trend movement. Indicator calculates automatically line. Features FiltPer - displays indicator period. deviation - displays indicator deviation. deviation2 - displays indicator deviation. How to understand the status: If (Timeframe M1-H1) FiltPer = 100; If ( Timeframe H4-MN) FiltPer = 5-20; ////////////////////////////////////////////////////////////////////////////////////////////////////////////////////////////////////////////////////// /
Noize Absorption Index MT4
Ekaterina Saltykova
5 (1)
Noize Absorption Index - is the manual trading system that measures the difference of pressure between bears forces and bulls forces. Green line - is a noize free index that showing curent situation. Zero value of index shows totally choppy/flat market.Values above zero level shows how powerfull bullish wave is and values below zero measures bearish forces.Up arrow appears on bearish market when it's ready to reverse, dn arrow appears on weak bullish market, as a result of reverse expectation. S
The Stochastic Oscillator is a momentum indicator that uses support and resistance levels. The term "stochastic" refers to the point of a current price in relation to its price range over a period of time. You can use a New Stochastic in the same way as classical one: Overbought and Oversold areas to make a Buy or Sell orders. This new indicator shows all variety of Fibonacci Levels (from 23.6 to 76.4) which can be used as Overbought and Oversold levels as well as points to close an open positio
MACDivergence MTF
Pavel Zamoshnikov
4.29 (7)
Advanced ideas of the popular MACD indicator: It detects and displays classic and reverse divergences (three methods of detecting divergences). It uses different color to highlight an uptrend and a downtrend. Two methods of determining a trend: а) MACD crosses the 0 level (classic signal); б) MACD crosses its own average (early signal). This is a multi-timeframe indicator: it can display MACD data from other timeframes. Two methods of drawing: classic histogram and line. It generates sound and v
Chart Patterns Detect 15 patterns (Ascending Triangle, Descending Triangle, Rising Wedge, Falling Wedge, Bullish Flag, Bearish Flag, Bullish Rectangle, Bearish Rectangle Symmetrical triangle, Head and Shoulders, Inverted Head and Shoulders, Triple top, Triple Bottom, Double Top, Double Bottom) Use historical data to calculate the probability of each pattern to succeed (possibility to filter notification according to the chance of success) gives graphic indication about the invalidation level and
ZhiBiCCI MT4
Qiuyang Zheng
5 (1)
[ZhiBiCCI] Indikatoren sind für alle Zyklusanwendungen und auch für alle Marktsorten geeignet. [ZhiBiCCI] Die grüne durchgezogene Linie ist eine Umkehrung der bullischen Divergenz. Die grüne gestrichelte Linie ist eine klassische bullische Divergenz. [ZhiBiCCI] Die durchgehende Linie zum Rot ist eine umgekehrte bearishe Divergenz. Die rote gepunktete Linie ist eine klassische bearishe Divergenz. [ZhiBiCCI] kann in den Parametern (Alert, Mail senden, Benachrichtigung senden) eingestellt wer
RTrends
Nikolay Likhovid
The RTrends indicator does two things: first, it automatically draws the layout of the price chart by plotting trend lines and, secondly, it produces bearish and bullish signals. The layout reflects the fractal nature of the market. Trends from different time horizons are applied simultaneously on the chart. Thus, from a single chart a trader can see trend lines of higher timeframes. The lines, depending on the horizon, differ in color and width: the older the horizon, the thicker the line is. T
Unser Basic Support and Resistance Indikator ist die Lösung, die Sie für die Steigerung Ihrer technischen Analyse benötigen.Mit diesem Indikator können Sie Support- und Widerstandsebenen in der Tabelle projizieren/ MT5 -Version Funktionen Integration von Fibonacci -Ebenen: Mit der Option, Fibonacci -Werte neben Unterstützung und Widerstandsniveau anzuzeigen, gibt unser Indikator einen noch tieferen Einblick in das Marktverhalten und mögliche Umkehrbereiche. Leistungsoptimierung: Mit der Op
MQLTrend
Mohammad Reza Aghaei
This tool helps you to control the situation at other times and include them in your trades when analyzing the market  This tool scans the market and reports the movement of the market at different times With the help of this tool, you can prevent many wrong analyzes With the help of this tool, you can have an overview of the market in the shortest time and save your time
FREE
TS krachobor
Magomed Zakaryaev
Всем привет! Выставляю свою торговую стратегию для форекс (далее - ТС). После покупки или аренды ТС пишете мне, я вас добавляют в закрытый чат телеграм, где дам все индикаторы и поддержку по торговле, и мы вместе будем торговать. Статистику по торговле в ТС я добавлю чуть позже, так как открыл новый счет по ТС, что бы было наглядно как проходит торговля. Кроме этого  я дам счет и пароль инвестора, можете сами смотреть в живую торговлю и решить для себя подходит ли она для вас. Два режима, 1) Сре
Strong Retracement Points Pro demo edition! SRP (Strong Retracement/Reversal Points) is a powerful and unique support and resistance indicator. It displays the closest important levels which we expect the price retracement/reversal! If all level are broken from one side, it recalculates and draws new support and resistance levels, so the levels might be valid for several days depending on the market! If you are still hesitating to start using this wonderful tool, you can check this link to see h
Volume Confirm Trend Zone is the indicator for filtering sideways and confirm trend to help your system trading. Indicator can use every currency pairs, every time frame, and every broker. You can see trend zone when color to change in volume indicator. Features When the color changes to the blue: Buy Zone is a strong trend. When the color changes to the red: Sell Zone is a strong trend.
Wolfe Wave Scanner MT4
Reza Aghajanpour
4.6 (10)
**  All Symbols  x  All Timeframes  scan just by pressing scanner button ** *** Contact me after the purchase to send you instructions and add you in "Wolfe Wave Scanner group" for sharing or seeing experiences with other users. Introduction: A Wolfe Wave is created with five-wave patterns in price. It shows supply and demand and a fight towards a balance price. T hese waves of price actions can help traders identify the boundaries of   the trend . Also  It helps forecast how the price will move
Trend Ray
Andriy Sydoruk
The indicator shows the potential trend direction by cyclical-wave dependence. Thus, all the rays of the intersection will be optimal rays, in the direction of which the price is expected to move, taking into account the indicator period. Rays can be used as a direction for potential market movement. But we must not forget that the approach must be comprehensive, the indicator signals require additional information to enter the market.
The Th3Eng PipFinite indicator is based on a very excellent analysis of the right trend direction with perfect custom algorithms. It show the true direction and the best point to start trading. With StopLoss point and Three Take Profit points. Also it show the right pivot of the price and small points to order to replace the dynamic support and resistance channel, Which surrounds the price. And Finally it draws a very helpful Box on the left side on the chart includes (take profits and Stop loss
SX Currency Strength indicator allows users to analyze currency strength through a selected period, with results resetting periodically and accumulating thereafter. It displays the historical relative strength of eight major currencies (USD, EUR, GBP, JPY, AUD, CHF, CAD and NZD) across a selected timeframe. Assessing a currency's relative strength aids in evaluating its performance against a basket of other currencies. Users can select to visualize relative strength of the currencies in the shap
Love Trend
Maryna Shulzhenko
Love Trend indicator showing buy and sell areas. The indicator follows the price movement around the opening price. It also displays information about the trend following the breakout of the low and high. The indicator has a very simple but effective graphic: an orange dot is displayed above the open price, and a blue dot is displayed below the open price. The indicator also includes an audible alert and a pop-up window to alert you when the candle closes at these important levels. The indicator
FXArk Kcci
Nithaam Davis
The KCCi uses a Grid method with a breakeven feature, its based around the CCI and Kijun-Sen of the Ichimoku indicator. Its recommended to be used with a cent account as it requires a high volume of capital along with a broker that allows numerous open positions, along with this low spreads are desired. All major pairs can be traded with this EA, including commodities and on all TFs though before any usage please optimize . IMPORTANT: These parameters will need to be increased to the max o
Der Indikator zeigt harmonische Muster auf dem Chart,   ohne   mit minimaler Verzögerung neu zu zeichnen. Die Suche nach Indikator-Tops basiert auf dem Wellenprinzip der Preisanalyse. Mit den erweiterten Einstellungen können Sie Parameter für Ihren Handelsstil auswählen. Beim Öffnen einer Kerze (Bar) wird bei der Bildung eines neuen Musters ein Pfeil der wahrscheinlichen Richtung der Preisbewegung festgelegt, der unverändert bleibt. Der Indikator erkennt folgende Muster und deren Varianten: ABCD
Matrixs
Andriy Sydoruk
Matrix is a Forex arrow indicator. Displays signals simply and clearly! The arrows show the direction of the transaction, and are colored accordingly, which can be seen in the screenshots. As you can see, trading with such an indicator is easy. I waited for an arrow to appear in the desired direction - I opened a deal. An arrow formed in the opposite direction - closed the deal. The indicator also displays the lines with the help of which the arrow signals are formed, taking into account the int
The Penta-O is a 6-point retracement harmonacci pattern which usually precedes big market movements. Penta-O patterns can expand and repaint quite a bit. To make things easier this indicator implements a twist: it waits for a donchian breakout in the right direction before signaling the trade. The end result is an otherwise repainting indicator with a very reliable trading signal. The donchian breakout period is entered as an input. [ Installation Guide | Update Guide | Troubleshooting | FAQ | A
Käufer dieses Produkts erwarben auch
Gann Made Easy
Oleg Rodin
4.88 (100)
Gann Made Easy ist ein professionelles und einfach zu bedienendes Forex-Handelssystem, das auf den besten Handelsprinzipien unter Verwendung der Theorie von Mr. basiert. W.D. Gann. Der Indikator liefert genaue KAUF- und VERKAUFSsignale, einschließlich Stop-Loss- und Take-Profit-Levels. Mit PUSH-Benachrichtigungen können Sie auch unterwegs handeln. Bitte kontaktieren Sie mich nach dem Kauf! Ich werde meine Handelstipps und tolle Bonusindikatoren kostenlos mit Ihnen teilen! Wahrscheinlich haben Si
Trend Punch
Mohamed Hassan
4.91 (23)
This indicator is unstoppable when combined with our other indicator called  Support & Resistance . After purchase, send us a message and you will get it   for  FREE as a BONUS! Introducing Trend Punch , the revolutionary forex trend indicator that will transform the way you trade! Trend Punch is uniquely designed to provide precise buy and sell arrows during strong market trends, making your trading decisions clearer and more confident. Whether you're trading major currency pairs or exotic sym
Gold Stuff
Vasiliy Strukov
4.9 (270)
Gold Stuff-Ein Trendindikator, der speziell für Gold entwickelt wurde, kann auch auf allen Finanzinstrumenten verwendet werden. Der Indikator wird nicht neu gezeichnet und verzögert sich nicht. Empfohlener Zeitrahmen H1. Nach diesem Indikator geschrieben EA Gold Stuff Berater, können Sie es in meinem Profil finden. WICHTIG! Kontaktieren Sie mich sofort nach dem Kauf, um Anweisungen und Bonus zu erhalten!   Sie können eine kostenlose Kopie unseres Strong Support- und Trendscanner-Indikators
FX Power MT4 NG
Daniel Stein
5 (13)
Erhalten Sie Ihr tägliches Marktupdate mit Details und Screenshots über unser Morning Briefing hier auf mql5 und auf Telegram ! FX Power MT4 NG ist die nächste Generation unseres langjährig sehr beliebten Währungsstärkemessers FX Power. Und was bietet dieser Stärkezähler der nächsten Generation? Alles, was Sie am ursprünglichen FX Power geliebt haben PLUS GOLD/XAU-Stärkeanalyse Noch präzisere Berechnungsergebnisse Individuell konfigurierbare Analysezeiträume Anpassbares Berechnungslimit für noc
BITTE LESEN SIE DIE INFORMATIONEN UNTEN, BEVOR SIE DAS PRODUKT KAUFEN! Apollo Pips PLUS SP ist ein einzigartiges Produkt! ES IST FÜR ALLE, DIE MEINEN NEUEN „APOLLO PIPS“-INDIKATOR PLUS „SUPER PACK“-BONUS MIT ZUGRIFF AUF ALLE MEINE HANDELSINDIKATOREN ERHALTEN MÖCHTEN! Mit dem Kauf des Produkts Apollo Pips PLUS SP erwerben Sie tatsächlich eine völlig neue Version meines Apollo Pips-Indikators. Diese Version des Indikators verfügt über einen verbesserten Algorithmus und einen benutzerfreundlichen P
TPSproTREND PrO
Roman Podpora
4.79 (19)
TPSpro TREND PRO   ist ein Trendindikator, der den Markt automatisch analysiert und Informationen über den Trend und jede seiner Änderungen liefert sowie Signale für den Einstieg in Geschäfte ohne Neuzeichnung gibt! Der Indikator verwendet jede Kerze und analysiert sie separat. bezieht sich auf verschiedene Impulse – Aufwärts- oder Abwärtsimpuls. Exakte Einstiegspunkte in Transaktionen für Währungen, Krypto, Metalle, Aktien, Indizes! Version MT5                   VOLLSTÄNDIGE BESCHREIBUNG DES
Trend Pulse
Mohamed Hassan
5 (5)
Please contact me after purchase to immediately get your PDF strategy + documentation for Trend Pulse !  Official release price of $89  (2 /50 copies left). Next price is $199 . Introducing Trend Pulse , a unique and robust indicator capable of detecting bullish, bearish, and even ranging trends! Trend Pulse uses a special algorithm to filter out market noise with real precision. If the current symbol is moving sideways, Trend Pulse will send you a ranging signal, letting you know that it'
Scalper Inside PRO
Alexey Minkov
4.75 (60)
An exclusive indicator that utilizes an innovative algorithm to swiftly and accurately determine the market trend. The indicator automatically calculates opening, closing, and profit levels, providing detailed trading statistics. With these features, you can choose the most appropriate trading instrument for the current market conditions. Additionally, you can easily integrate your own arrow indicators into Scalper Inside Pro to quickly evaluate their statistics and profitability. Scalper Inside
Atomic Analyst
Issam Kassas
5 (3)
Zunächst einmal ist es erwähnenswert, dass dieser Handelsindikator nicht neu malt, nicht neu zeichnet und keine Verzögerung aufweist, was ihn sowohl für manuellen als auch für Roboterhandel ideal macht. Benutzerhandbuch: Einstellungen, Eingaben und Strategie. Der Atom-Analyst ist ein PA-Preisaktionsindikator, der die Stärke und das Momentum des Preises nutzt, um einen besseren Vorteil auf dem Markt zu finden. Ausgestattet mit fortschrittlichen Filtern, die helfen, Rauschen und falsche Signale z
Trend Screener
STE S.S.COMPANY
4.82 (92)
Trendindikator, bahnbrechende, einzigartige Lösung für Trendhandel und -filterung mit allen wichtigen Trendfunktionen in einem Tool! Es handelt sich um einen 100 % nicht neu zu malenden Multi-Timeframe- und Multi-Währungs-Indikator, der für alle Symbole/Instrumente verwendet werden kann: Forex, Rohstoffe, Kryptowährungen, Indizes und Aktien. Trend Screener ist ein effizienter Trendfolgeindikator, der Pfeiltrendsignale mit Punkten im Diagramm liefert. Die Funktionen, die im Trendanalysator-Indika
Currency Strength Wizard ist ein sehr leistungsstarker Indikator, der Ihnen eine Komplettlösung für erfolgreichen Handel bietet. Der Indikator berechnet die Stärke dieses oder jenes Forex-Paares anhand der Daten aller Währungen in mehreren Zeitrahmen. Diese Daten werden in Form von benutzerfreundlichen Währungsindizes und Währungsstärkelinien dargestellt, anhand derer Sie die Stärke dieser oder jener Währung erkennen können. Sie müssen lediglich den Indikator an das Diagramm anhängen, mit dem Si
- Real price is 80$ - 40% Discount ( It is 49$ now ) Contact me for instruction, any questions! Introduction The breakout and retest strategy is traded support and resistance levels. it involves price breaking through a previous level.  The break and retest strategy is designed to help traders do two main things, the first is to avoid false breakouts. Many false breakouts start with a candlestick that breaks out of a level but ends with an immediate candlestick that brings the price back into t
Derzeit 20% Rabatt! Die beste Lösung für jeden Neueinsteiger oder Expert Händler! Dieses Dashboard arbeitet mit 28 Währungspaaren. Es basiert auf 2 unserer Hauptindikatoren (Advanced Currency Strength 28 und Advanced Currency Impulse). Es bietet einen hervorragenden Überblick über den gesamten Forex-Markt. Es zeigt die Werte der Advanced Currency Strength, die Veränderungsrate der Währungen und die Signale für 28 Devisenpaare in allen (9) Zeitrahmen. Stellen Sie sich vor, wie sich Ihr Hande
Clear Breakout
Martin Alejandro Bamonte
5 (1)
Der "Breakout Buy-Sell" Indikator ist darauf ausgelegt, potenzielle Kauf- und Verkaufsgelegenheiten basierend auf Preisdurchbrüchen während verschiedener Marktsitzungen (Tokio, London und New York) zu identifizieren und hervorzuheben. Dieser Indikator hilft Tradern, Kauf- und Verkaufszonen sowie Take-Profit (TP) und Stop-Loss (SL) Niveaus klar zu visualisieren. Nutzungsstrategie Der Indikator kann wie folgt verwendet werden: Erste Einstellungen : Wählen Sie die Marktsitzung und passen Sie den GM
DERZEIT 26% RABATT Die beste Lösung für jeden Newbie oder Expert Trader! Dieser Indikator ist ein einzigartiges, qualitativ hochwertiges und erschwingliches Trading-Tool, da wir eine Reihe von proprietären Funktionen und eine neue Formel integriert haben. Mit nur EINEM Chart können Sie die Währungsstärke für 28 Forex-Paare ablesen! Stellen Sie sich vor, wie sich Ihr Handel verbessern wird, weil Sie in der Lage sind, den genauen Auslösungspunkt eines neuen Trends oder einer Scalping-Gelegenh
PRO Renko System ist ein hochpräzises Handelssystem, das speziell für den Handel mit RENKO-Charts entwickelt wurde. Dies ist ein universelles System, das auf verschiedene Handelsinstrumente angewendet werden kann. Das System neutralisiert effektiv so genannte Marktgeräusche, die Ihnen Zugang zu genauen Umkehrsignalen geben. Der Indikator ist sehr einfach zu bedienen und hat nur einen Parameter, der für die Signalerzeugung verantwortlich ist. Sie können das Tool einfach an jedes Handelsinstr
Gold Channel is a volatility-based indicator, developed with a specific timing algorithm for the XAUUSD pair, which consists of finding possible corrections in the market. This indicator shows two outer lines, an inner line (retracement line) and an arrow sign, where the theory of the channel is to help identify overbought and oversold conditions in the market. The market price will generally fall between the boundaries of the channel. If prices touch or move outside the channel it is a tra
Zunächst einmal ist es wichtig zu betonen, dass dieses Handelstool ein Nicht-Repaint-, Nicht-Redraw- und Nicht-Verzögerungsindikator ist, was es ideal für professionelles Trading macht. Online-Kurs, Benutzerhandbuch und Demo. Der Smart Price Action Concepts Indikator ist ein sehr leistungsstarkes Werkzeug sowohl für neue als auch erfahrene Händler. Er vereint mehr als 20 nützliche Indikatoren in einem und kombiniert fortgeschrittene Handelsideen wie die Analyse des Inner Circle Traders und Stra
DERZEIT 31% RABATT! Die beste Lösung für jeden Newbie oder Expert Trader! Dieser Indikator ist ein einzigartiges, qualitativ hochwertiges und erschwingliches Handelsinstrument, da wir eine Reihe von proprietären Funktionen und eine geheime Formel eingebaut haben. Mit nur EINEM Chart liefert er Alerts für alle 28 Währungspaare. Stellen Sie sich vor, wie sich Ihr Handel verbessern wird, weil Sie in der Lage sind, den genauen Auslösepunkt eines neuen Trends oder einer Scalping-Gelegenheit zu e
NAM Order Blocks
NAM TECH GROUP, CORP.
5 (1)
MT4-Erkennungsanzeige für Auftragsblöcke mit mehreren Zeitrahmen. Eigenschaften - Vollständig anpassbar auf dem Diagrammbedienfeld, bietet vollständige Interaktion. - Verstecken und zeigen Sie das Bedienfeld, wo immer Sie möchten. - Erkennen Sie OBs in mehreren Zeiträumen. - Wählen Sie die anzuzeigende OB-Menge aus. - Verschiedene OBs Benutzeroberfläche. - Verschiedene Filter an OBs. - OB-Näherungsalarm. - ADR High- und Low-Leitungen. - Benachrichtigungsdienst (Bildschirmwar
RelicusRoad Pro
Relicus LLC
4.73 (141)
Jetzt 147 US -Dollar (nach ein paar Aktualisierungen auf 499 US -Dollar) - Unbegrenzte Konten (PCs oder MACs) RelicusRoad Benutzerhandbuch + Schulungsvideos + Zugang zur privaten Discord-Gruppe + VIP-Status EINE NEUE ART, DEN MARKT ZU BETRACHTEN RelicusRoad ist der weltweit leistungsstärkste Handelsindikator für Forex, Futures, Kryptowährungen, Aktien und Indizes und gibt Händlern alle Informationen und Tools, die sie benötigen, um profitabel zu bleiben. Wir bieten technische Analysen un
PZ Trend Trading
PZ TRADING SLU
4.8 (5)
Trend Trading ist ein Indikator, der so weit wie möglich von den Markttrends profitiert, indem er Pullbacks und Breakouts zeitlich festlegt. Sie findet Handelsmöglichkeiten, indem sie analysiert, was der Preis während etablierter Trends tut. [ Installationsanleitung | Update-Anleitung | Fehlerbehebung | FAQ | Alle Produkte ] Handeln Sie mit Zuversicht und Effizienz an den Finanzmärkten Profitieren Sie von etablierten Trends, ohne ins Wanken zu geraten Profitable Pullbacks, Ausbrüche und vor
TPSpro RFI Levels
Roman Podpora
4.83 (24)
Umkehr der ersten Impulsniveaus (RFI)       ANWEISUNGEN       Russland       -        ENG    Die Empfehlung basiert auf dem Indikator -   TPSpro   TREND PRO -   Version MT5 Die wichtigsten Elemente in der Branche sind entweder in Zonen oder in der Fabrik enthalten, oder sie führen zu einer Lösung bei einem Kauf oder dem Verkauf eines anderen Instruments. Wenn viele Menschen ihre Rechte nicht auf dem Händlerkonto verschlüsseln, werden die Folgen nicht schnell genug sein. Ich habe es damit abgesc
Break and Retest
Mohamed Hassan
4.17 (18)
This Indicator only places quality trades when the market is really in your favor with a clear break and retest. Patience is key with this price action strategy! If you want more alert signals per day, you increase the number next to the parameter called: Support & Resistance Sensitivity.  After many months of hard work and dedication, we are extremely proud to present you our  Break and Retest price action indicator created from scratch. One of the most complex indicators that we made with ove
Order Block Hunter
Noha Mohamed Fathy Younes Badr
5 (2)
Order block hunter indicator is the best indicator for  hunt the order blocks that area where there has been a large concentration of limit orders waiting to be executed Order blocks are identified on a chart by observing previous price action and looking for areas where the price experienced significant movement or sudden changes in direction .This indicator does that for you by using very complicated codes and helps you to take the best areas To buy and sell because it make marks at the best a
Scalper Vault
Oleg Rodin
5 (29)
Scalper Vault ist ein professionelles Scalping-System, das Ihnen alles bietet, was Sie für erfolgreiches Scalping benötigen. Dieser Indikator ist ein komplettes Handelssystem, das von Forex- und Binäroptionshändlern verwendet werden kann. Der empfohlene Zeitrahmen ist M5. Das System liefert Ihnen genaue Pfeilsignale in Richtung des Trends. Es liefert Ihnen auch Top- und Bottom-Signale und Gann-Marktniveaus. Die Indikatoren bieten alle Arten von Warnungen, einschließlich PUSH-Benachrichtigungen.
IX Power MT4
Daniel Stein
5 (6)
IX Power bringt die unschlagbare Präzision von FX Power endlich auch zu Nicht-Forex-Symbolen. Es bestimmt präzise die Intensität von kurz-, mittel- und langfristigen Trends in Ihren Lieblingsindizes, Aktien, Rohstoffen, ETFs und sogar Kryptowährungen. Sie können alles analysieren, was Ihr Terminal zu bieten hat. Probieren Sie es aus und erleben Sie, wie sich Ihr Timing beim Handel deutlich verbessert . IX Power Hauptmerkmale 100% präzise, nicht nachpinselnde Berechnungsergebnisse - für
Zeichnen Sie automatisch Unterstützungs- und Widerstandsniveaus PLUS Antriebskerzenlücken auf Ihrem Chart ein, so dass Sie sehen können, wohin sich der Preis wahrscheinlich als Nächstes bewegen und/oder möglicherweise umkehren wird. Dieser Indikator wurde entwickelt, um als Teil der Positionshandelsmethodik verwendet zu werden, die auf meiner Website (The Market Structure Trader) gelehrt wird, und zeigt Schlüsselinformationen für die Zielsetzung und potenzielle Einstiege an. Der Indikator v
M1 Arrow
Oleg Rodin
4.73 (15)
Eine Intraday-Strategie, die auf zwei Grundprinzipien des Marktes basiert. Der Algorithmus basiert auf der Analyse von Volumina und Preiswellen mit zusätzlichen Filtern. Der intelligente Algorithmus des Indikators gibt nur dann ein Signal, wenn sich zwei Marktfaktoren zu einem vereinen. Der Indikator berechnet Wellen eines bestimmten Bereichs auf dem M1-Diagramm unter Verwendung der Daten des höheren Zeitrahmens. Und um die Welle zu bestätigen, verwendet der Indikator eine Volumenanalyse. Dieser
Werden Sie Breaker Trader und profitieren Sie von Änderungen der Marktstruktur, wenn sich der Preis umkehrt. Der Order Block Breaker Indikator zeigt an, wann sich eine Trend- oder Preisbewegung der Erschöpfung nähert und bereit ist, sich umzukehren. Es weist Sie auf Änderungen in der Marktstruktur hin, die normalerweise auftreten, wenn eine Umkehrung oder ein größerer Rückzug bevorsteht. Der Indikator verwendet eine proprietäre Berechnung, die Ausbrüche und Preisdynamik identifiziert. Jedes
Weitere Produkte dieses Autors
Dieser Indikator zeigt die relative Stärke von acht Hauptwährungen (USD, EUR, GBP, AUD, NZD, CAD, CHF, JPY). Kraftwerte werden im Bereich von 0 bis 100 normalisiert. Werte über 60 bedeuten stark. Ein Wert unter 40 deutet auf Schwäche hin. Fahrkarte Only Show Current Pair   -       Bei „true“ wird nur das aktuelle Diagrammpaar angezeigt. Ansonsten werden alle acht Kurven angezeigt. Bars To Show     – Anzahl der Balken zur Anzeige der Kraftkurve. Ma Periods To Smooth Curves     : Gleitende Dur
Der Indikator besteht aus zwei Teilen. Teil I: Farbkerzen zeigen den großen Trend Farbkerzen dienen dazu, den Marktzustand anhand von Farbkerzen zu identifizieren. Wie in den Screenshots gezeigt, befindet sich der Markt in einem Zustand, in dem Sie Long-Orders platzieren oder Short-Orders beenden sollten, wenn die Farbe Aqua ist. Wenn die Farbe Tomate ist, ist es an der Zeit, Short-Orders aufzugeben oder Long-Orders zu beenden. Wenn sich die Farbe ändert, ist es besser, auf den Abschluss zu wart
Dieser Indikator zeigt die relative Stärke von acht Hauptwährungen (USD, EUR, GBP, AUD, NZD, CAD, CHF, JPY). Kraftwerte werden im Bereich von 0 bis 100 normalisiert. Werte über 60 bedeuten stark. Ein Wert unter 40 deutet auf Schwäche hin. Das Grundprinzip Gegeben sind acht Währungen, USD, EUR, GBP, AUD, NZD, CAD, CHF, JPY, wobei jedes Paar aus zwei Währungen kombiniert werden kann, was insgesamt 28 Paare ergibt. Ein umgekehrter Algorithmus wird verwendet, um die Stärke der acht Währungen aus d
Gamma Bands   This indcator shows the trend with the color histogram. It is simple and easy to use. Usage: If the histogram changes from the aqua to the fuchsia, which means the trend is up. If the histogram changes from the fuchsia to the aqua,which means the trend is down. Inputs: MaPeriods: the periods of moving average. f1: the multiplier of inner bands f2: the multiplier of outer bands   Popup Window Alert Email Alert Mobile Push Alert Alerts When the trend changes for the long trend to the
Dieser Berater ist ein Dashboard, mit dem Sie mehrere Paare mit einem Klick handeln können. klicken       Offen       Schaltfläche zum Öffnen der Bestellung für das ausgewählte Paar. klicken       schließen       Schaltfläche zum Schließen der Bestellung für das ausgewählte Paar. Das Bestelllos ist die vom Benutzer eingegebene Nummer. Positive Zahlen entsprechen Kaufaufträgen, negative Zahlen entsprechen Verkaufsaufträgen. Um die gesamte Bestellung statt nur teilweise zu schließen, klicken Sie
OrderManager Pro
Ziheng Zhuang
4.33 (9)
This Expert Advisor is designed to manage orders. It offers the following functions: Set a stop loss for an order having none. Set a take profit for an order having none. Close the last order if the total orders of a symbol are over the setting. Close the order if its lots are over the setting. Close the order if its profit in pips is over the setting. Close the order if its loss in pips is over the setting. Close the order if its profit in amount is over the setting. Close the order if its loss
FREE
Überwachung. Dieser Berater ist nur für Absicherungskonten gedacht. Metatrader 4-Version       Quick Panel Pro Merkmale Stapelberechnungen sind schnell und einfach. Berechnungen erfolgen sofort, wenn Sie die Stopplinie verschieben. Die meisten Geschäftsvorgänge können mit einem Klick auf diese Bedienfelder schnell erledigt werden. Wechseln Sie schnell zwischen den Panels, indem Sie einfach auf die grüne Schaltfläche klicken. EA kann im Strategy Tester ausgeführt werden. Mit dieser Funktion kö
This indcator shows the trend with the color histogram. It is simple and easy to use. Usage: If the histogram changes from the aqua to the fuchsia, which means the trend is up. If the histogram changes from the fuchsia to the aqua,which means the trend is down. Inputs: MaPeriods: the periods of moving average. f1: the multiplier of inner bands f2: the multiplier of outer bands Popup Window Alert Email Alert Mobile Push Alert Alerts When the trend changes from the long trend to the short trend or
Slippage Monitor
Ziheng Zhuang
4.75 (4)
This EA is designed to monitor the slippage of opening and closing orders, and save the records in files. It is useful to record the slippage and evaluate brokers. The record files are saved in the folder  MT4_Data_Folder\MQL4\Files.  Go to "File " --> "Open Data Folder" . Warning : Do NOT open the files directly, otherwise it will affect the exectution of EA, just copy them to another folder and open them. Usage: Open a chart and load the EA on it, just need only one EA to run, it monitors a
FREE
Slippage Monitor MT5
Ziheng Zhuang
4.8 (5)
This EA is designed to monitor the slippage of opening and closing orders, and save the records in csv file. It is useful to record the slippage and evaluate brokers. The record files are saved in the folder  MT5_Data_Folder\MQL5\Files.  Go to   "File " --> "Open Data Folder"   . Warning :   Do NOT open the files directly, otherwise it will affect the exectution of EA, just copy them to another folder and open them. Usage: Open a chart and load the EA on it, just need only one EA to run, it m
FREE
Account Summary MT5
Ziheng Zhuang
4.67 (3)
This is a MetaTrader 5 script. It helps to summarize all trades into every symbol. Input Select Period: This is 7-option input. It includes Last Month, This Month, Last Week, This Week, Today, All History, and Date Specified. Specify Starting Date: Enter a date if you selected Date Specified in "Select Period" input. Specify Ending Date: Enter a date if you selected Date Specified in "Select Period" input. The summary is saved into a file in MQL5\Files folder. MT4 Version:   https://www.mql5.c
FREE
Account Summary
Ziheng Zhuang
5 (1)
This is a MetaTrader 4 script. It helps to summarize all trades into every symbol. Input Select Period: This is 7-option input. It includes Last Month, This Month, Last Week, This Week, Today, All History, and Date Specified. Specify Starting Date: Enter a date if you selected Date Specified in "Select Period" input. Specify Ending Date: Enter a date if you selected Date Specified in "Select Period" input. The summary is saved into a file in MQL4\Files folder. Also, there is pop-up window for
FREE
Account Export
Ziheng Zhuang
5 (2)
This is a MetaTrader 4 script. It helps to export all trades into a CSV file as per Symbol and selected periods. Input Select Symbol: This is 2-option input. Select current symbol or all symbols to export its orders. Select Period: This is 7-option input. It includes Last Month, This Month, Last Week, This Week, Today, All History, and Date Specified. Specify Starting Date: Enter a date if you selected Date Specified in "Select Period" input. Specify Ending Date: Enter a date if you selected D
FREE
Dieser EA hat die Funktionen: Es bietet eine sortierte Paarleistung von       die wichtigsten 28 Paare   ,           Erleichtert den Handel durch die Auswahl der stärkeren oder schwächeren Paare. Mit dem Indikator wird die Paarstärke berechnet       Relative Währungsstärke   , die in EA erstellt wird, die Standardeingaben sind D1,90,0 Es können beliebige Symbole oder Paare gehandelt werden, nicht aber die Beschränkung auf die 28 wichtigsten Devisenpaare. Es enthält 6 Tags:       PPI, manueller H
FREE
Dieser Advisor bietet die folgenden Funktionen: Eröffnen Sie eine Position: Eröffnen Sie eine Long- oder Short-Order, wenn der Preis die Trendlinie kreuzt. Schließen: Schließen Sie eine Long- oder Short-Position, wenn der Preis die Trendlinie kreuzt. Trailing Stop Loss – Der EA erhöht weiterhin den Stop-Loss für Long-Orders oder verringert den Stop-Loss für Short-Orders entlang der Trendlinie. Die Linie kann eine Trendlinie oder eine horizontale Linie sein.       Trendlinien können Radien oder S
Der Indikator besteht aus zwei Teilen. Teil I: Farbkerzen zeigen den großen Trend Farbkerzen dienen dazu, den Marktzustand anhand von Farbkerzen zu identifizieren. Wie in den Screenshots gezeigt, befindet sich der Markt in einem Zustand, in dem Sie Long-Orders platzieren oder Short-Orders beenden sollten, wenn die Farbe Aqua ist. Wenn die Farbe Tomate ist, ist es an der Zeit, Short-Orders aufzugeben oder Long-Orders zu beenden. Wenn sich die Farbe ändert, ist es besser, auf den Abschluss zu wart
Quick Panel
Ziheng Zhuang
Dieses Gremium ist ein Fachberater und bietet 6 Gruppen von Handelspanels. MT5-Version:   Schnelle Panelabdeckung Merkmale Die meisten Handelsvorgänge können schnell durch Klicken auf die Schaltflächen in diesen Bedienfeldern ausgeführt werden. Das Wechseln der Panels ist so einfach wie das Klicken auf die grüne Schaltfläche. Der EA kann auf einem visuellen Diagramm im Strategietester ausgeführt werden und bietet eine einfache Möglichkeit, den Handel auf der Grundlage historischer Daten zu übe
Quick Panel Pro
Ziheng Zhuang
5 (1)
Dieser EA ist ein professionelles Handelstool, das flexibles Risikomanagement und 6 Sätze von Handelspanels integriert. MT5-Version:  Quick Panel Pro Hedging Merkmale Stapelberechnungen sind schnell und einfach. Berechnungen erfolgen sofort, wenn Sie die Stopplinie verschieben. Die meisten Geschäftsvorgänge können mit einem Klick auf diese Bedienfelder schnell erledigt werden. Wechseln Sie schnell zwischen den Panels, indem Sie einfach auf die grüne Schaltfläche klicken. EA kann im Strategy Test
This indicator shows the main trend on the current chart. Features This indicator includes two bands, one is the inner white bands, another is the outer blue bands. If the white dotted line crosses down the white solid line, this means that the trend has changed to be bearish. If the white dotted line crosses up the white solid line, this means that the trend has changed to be bullish. Once the crossing happened, it will not repaint. Settings ShowColorCandle: if 'true', it will show the colo
This indicator shows main trend, entry zone and exit zone. This is a muti-timeframe indicator, so it is always repainting in the current period of the higher timeframe. Features Colorful Histogram: it indicates the main trend, the tomato means the market is bearish,and the sky blue means the market is bullish. Inner Blue Bands: it is entry zone for entry market, the market is relatively safe for entry. Outer Yellow Bands: it is exit zone for exit market, the market is oversold or overbought.
The purpose of the inidcator is to identify the reversal point. The blue arrow is buy signal and the yellow star is its stop loss. The red arrow is sell signal and the yellow star is its stop loss. Alert feature: if there is a signal, the indicator will send alerts of  popup window,email or mobile push. Inputs: Popup Window Alert: it is false in default Email Alert : it is false in default Mobile Push Alert: it is false in default. MetaTrader 5 Version: Reversal Point Please note that the singa
Note: This EA only works on Hedging account. The MetaTrader 4 version Quick Panel This Panel is an Expert Advisor, which provides six groups of trading panel. Features Most trading operations can be quickly made by clicking the button on these panels. Changing panels is quick just by clicking the green button. The EA can run on visual chart on the strategy tester, which provides an easy method to practice trading on history data. Show the average price on a yellow-background panel and draw th
The purpose of the inidcator is to identify the reversal point. The blue arrow is buy signal and the yellow star is its stop loss. The red arrow is sell signal and the yellow star is its stop loss. Please note that the singal is against trend,it could be continual fail. Alert feature: if there is a signal, the indicator will send alerts of  popup window,email or mobile push. Inputs: Popup Window Alert: it is false in default Email Alert : it is false in default Mobile Push Alert: it is false in
Dieser Advisor bietet die folgenden Funktionen: Eröffnen Sie eine Position: Eröffnen Sie eine Long- oder Short-Order, wenn der Preis die Trendlinie kreuzt. Schließen: Schließen Sie eine Long- oder Short-Position, wenn der Preis die Trendlinie kreuzt. Trailing Stop Loss – Der EA erhöht weiterhin den Stop-Loss für Long-Orders oder verringert den Stop-Loss für Short-Orders entlang der Trendlinie. Die Linie kann eine Trendlinie oder eine horizontale Linie sein.       Trendlinien können Radien oder S
Dieser Berater ist ein Dashboard, mit dem Sie mehrere Paare mit einem Klick handeln können. klicken       Offen       Schaltfläche zum Öffnen der Bestellung für das ausgewählte Paar. klicken       schließen       Schaltfläche zum Schließen der Bestellung für das ausgewählte Paar. Das Bestelllos ist die vom Benutzer eingegebene Nummer. Positive Zahlen entsprechen Kaufaufträgen, negative Zahlen entsprechen Verkaufsaufträgen. Um die gesamte Bestellung statt nur teilweise zu schließen, klicken Sie
Auswahl:
Aaron George Mathew
211
Aaron George Mathew 2020.06.01 03:48 
 

First 2 trades hit stop loss. Not good..

4xplosion
1008
4xplosion 2020.04.14 02:03 
 

just got it and already proving well worth 5 stars....get it while still cheap!

Farooq Majoka
1817
Farooq Majoka 2019.04.12 07:22 
 

First trade off this indicator paid for one and half month rent in 6 hours. Trader's own method and the indicator use can yield good profits I feel !

Antwort auf eine Rezension
Version 4.30 2020.04.17
Add the parameter information of RSI,Stoch,CCI when sending email/mobile push.
Version 4.20 2020.03.06
fixed bugs from additional suffix.
Version 4.10 2020.01.12
code optimizaion in alert function
Version 4.0 2020.01.10
Version 4.00
Add alert function by email and mobile push.
Send the weaker and stronger paris.
Version 3.0 2020.01.06
code optimization
Version 2.0 2019.05.13
Show the weaker paris which have at least 2 times in the top 3.
Show the stronger pairs which have at least 2 times in the bottom 3.
Version 1.10 2019.04.06
Code Optimazition