Candle Transition
- Indikatoren
- Yu Zhang
- Version: 1.4
- Aktualisiert: 6 Juni 2020
- Aktivierungen: 20
According to trading experience:
- Some symbols are easy to reverse on certain days, such as Monday, or afternoon, and so on. So comparing the current price with the corresponding historical moment price is valuable.
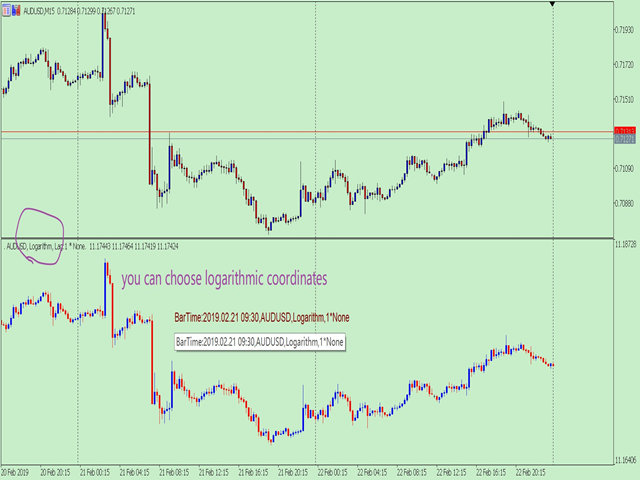
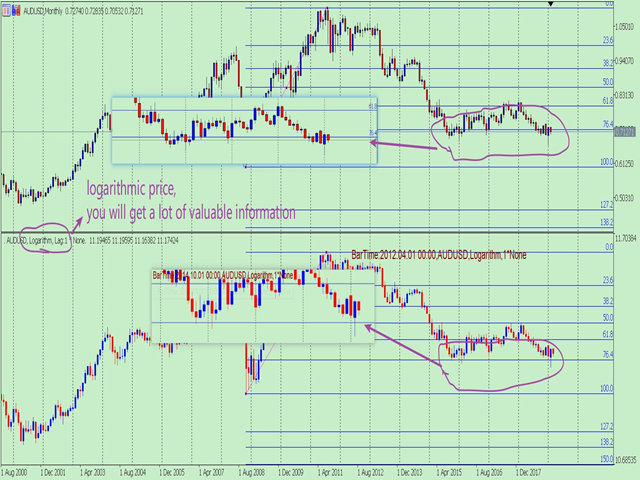
- If the price coordinate system uses a logarithmic price, you will get a lot of valuable information.
1. What is this?
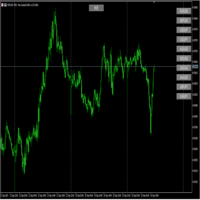
This program can convert the symbol price and add it to your Chart. You can compare it with your major chart.
The DEMO version Link:https://www.mql5.com/en/market/product/36198/
2. Function
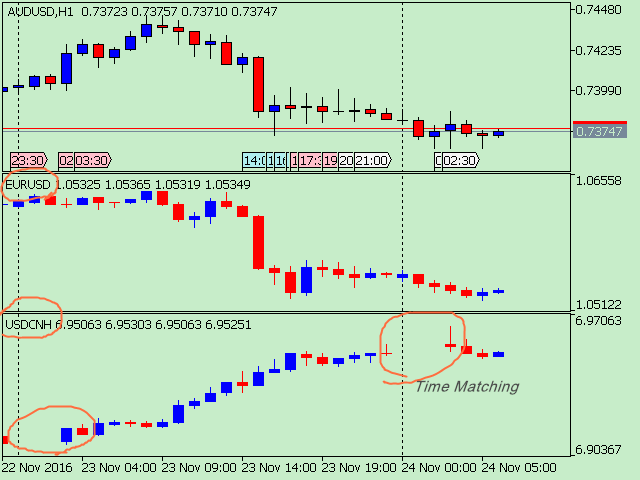
- You can enter the symbol you want, which can watch multiple Symbols on a single Chart.
- Time to match : Unified the Candle line corresponding to the time.Some Symbols have less than 24 hours of trading per day, so matching the time is required.
- The price coordinates have original mode and logarithmic mode.
- You can choose the degree of lag of Candle. For example, the current Chart is 2019-2-22 on Friday, you can choose to overlay the symbol of previous Friday.
- you can identify lag time for convenience.
3. How to use
Parameter:
- Input_Forex=""; //Input your symbol, default chart symbol.
- CoordinateMode=Original; //Price Coordinate mode: Original / Logarithm.
- LagUnit=W1; //The added Candle's Lag Unit.
- Also LagUnit can be selected D1/H12/H8... That means the basic unit of lag.
- LagCount=1; //The added Candle's Lag Count.
- if LagUnit=W1 and LagCount=2, That means total lag of 2 weeks.
- color BullCandle=clrRed; //Set Bull Candle Color
- color BearCandle=clrBlue; //Set Bear Candle Color
- color OtherCandle=clrBlack; //Set Other Candle Color
PS:
If you don't have data on your system, you might encounter the following: Suddenly nothing can be seen, which means your system is downloading data. Because I added the ability to download data in this program.











Der Benutzer hat keinen Kommentar hinterlassen