VolumeProfile
- Indikatoren
- Robert Hess
- Version: 1.37
- Aktualisiert: 20 Oktober 2022
- Aktivierungen: 5
Beschreibung:
Das Volumen Profil zeigt detailierte Informationen von historischen trading Aktivitäten in bestimmten Preisbereichen (Markt Profil).
Damit finden Sie die Zonen mit den besten Preisen im Markt und erlangen so einen entscheidenen Vorteil gegenüber anderen Marktteilnehmern.
Features:
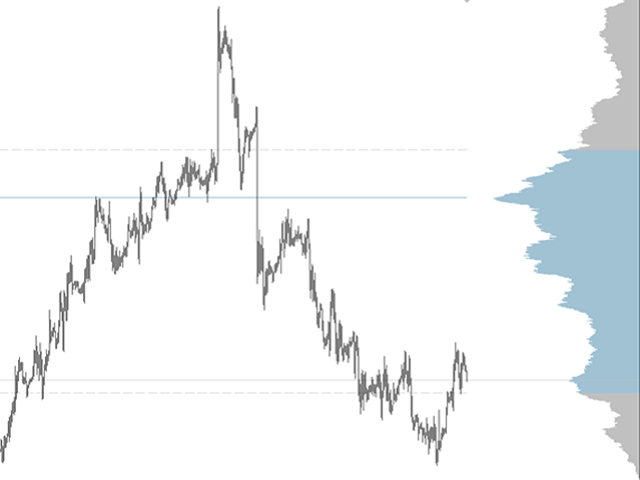
- Anpassbares Volume Profil / Markt Profil
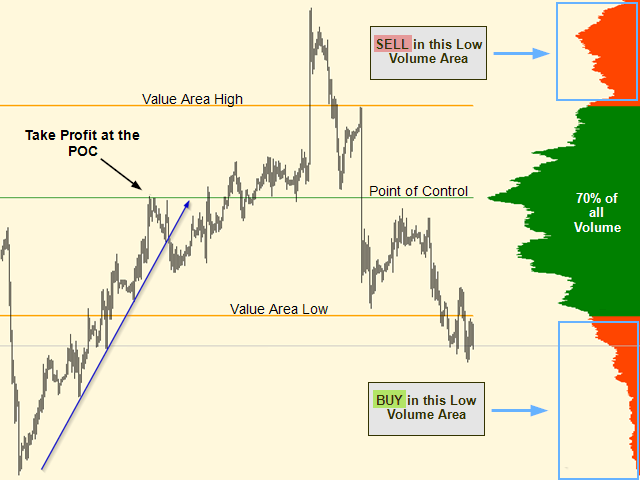
- Zeigt den "fairen" Preisbereich in dem 70% des gesamten Volumens umgesetzt werden
- Zeigt kritische Zonen mit niedrigem Volumen
- Zeigt Volume Point of Control (VPOC), Value Area High (VAH) und Value Area Low (VAL) Punkte
- Funktioniert auf allen Zeitebenen
- Auch für den Metatrader 5 verfügbar (https://www.mql5.com/en/market/product/37391)
Einstellungen:
| Variable | Standard Value | Description |
|---|---|---|
| Bar History | 1100 | Anzahl der Historischen Kerzen |
| Level of Detail | 1 | Setzen Sie die Auflösung des Profils. Aus Sicherheitsgründen, wird dieser Wert bei charts mit sehr hohen volumina (z.B. Gold oder BTCUSD) |
| Auto set X-Position | true | - Auf "true" wird der Indikator automatisch an Ihr Chartfenster angepasst - Auf "false" können sie den Indikator selbst mittels "X-Position" an Ihr Chartfenster anpassen |
| X-Position | 0 | Hier legen Sie die X-Position für den Indikator fest (empfehlenswert ist ein Wert zwischen 30 und 60) |
| Scale | 10 | Legt die größe des Indikators fest (Repräsentiert den Prozentsatz, den das Profil im Chart einnimmt) |
| Profile_Color | Green | Farbe der Zone mit 70% des Volumes (fairer Preisbereich) |
| Profile_Color_VLow | OrangeRed | Farbe der Zone mit niedrigem Volumen |
| Profile_Background | true | Setzt den Indikator in den Hintergrund |
| Value Area percentage | 70 | Legt den Prozentsatz für die Value Area fest (Zone des höchsten Volumenaufkommens) |
| Enable Point of Control | true | Ein/Aussschalten der POC Linie |
| POC_Style | 0 | Legt den Stil des POC fest |
| POC_Color | Green | Legt die Farbe des POC fest |
| POC_Width | 1 | Legt die Breite des POC fest |
| POC_Background | true | Setzt den POC in den Hintergrund |
| Enable Value Area Low Line | true | Ein/Ausschalten der VAL Linie |
| VAL_Style | 0 | Legt den Stil der VAL Linie fest |
| VAL_Color | Orange | Legt die Farbe der VAL Linie fest |
| VAL_Width | 2 | Legt die Breite der VAL Linie fest |
| VAL_Background | true | Setzt die VAL Linie in den Hintergrund |
| Enable Value Area High Line | true | Ein/Ausschalten der VAL Linie |
| VAH_Style | 0 | Legt den Stil der VAH Linie fest |
| VAH_Color | Orange | Legt die Farbe der VAH Linie fest |
| VAH_Width | 2 | Legt die Breite der VAH Linie fest |
| VAH_Background | true | Setzt die VAH Linie in den Hintergrund |


I was looking for something exactly like this when I stumbled across it a short while ago. I don't use many indicators on my charts, but this one is one of the few that I do use. It gives a very clear broader picture of price action, an I take consideration of its input before every trade I take. I can adjust the colors so it's quite subtle & doesnt take over the chart. Because it gives indications of every time frame, it's absolutely fundamental and underpins all my trading. Well done Robert...