Profit MACD
- Indikatoren
- Aleksey Ivanov
- Version: 2.30
- Aktualisiert: 31 März 2021
- Aktivierungen: 5
I present an indicator for professionals. ProfitMACD is very similar to classic MACD in appearance and its functions. However, ProfitMACD is based on completely new algorithms (for example, it has only one averaging period) and is more robust, especially on small timeframes, since it filters random price walks. The classic MACD indicator (Moving Average Convergence / Divergence) is a very good indicator following the trend, based on the ratio between two moving averages, namely the EMA with periods of 12 and 26, i.e.
MACD = EMA(CLOSE, 12) - EMA(CLOSE, 26),
and the signal line - 9-period moving average from the indicator itself
SIGNAL = SMA(MACD, 9).
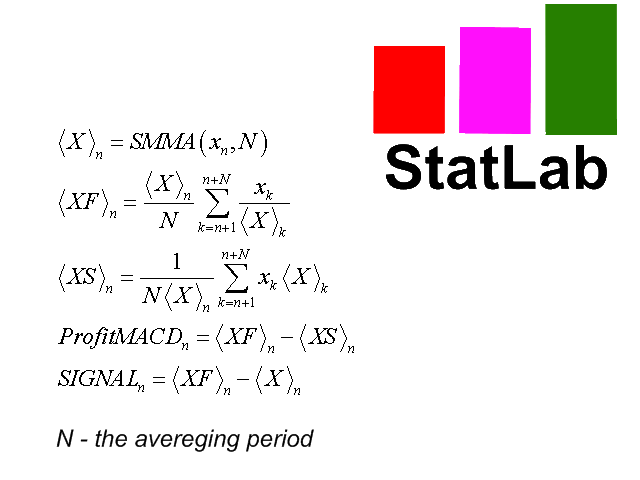
The algorithm of the indicator ProfitMACD is much more complicated and is shown in the last screenshot. ProfitMACD, like the classic MACD, is most effective when the market fluctuates with a large amplitude in the trading corridor.
The indicator has all kinds of alerts.
Benefits of ProfitMACD.
-
Classic MACD gives a lot of false signals on small timeframes, providing good results on weekly and daily charts. ProfitMACD works on hour timeframes and can be quite accurate even on M5, which allows it to be used for scalping.
-
In addition, the ProfitMACD indicator has less lag.
-
According to the value of the main line ProfitMACD, presented in points, you can, if there is a signal, set the position of Take Profit when playing on the oscillations inside the channel. And when playing by the trend at this value, you can set the value of Stop Loss.
ProfitMACD signals.
The signals for these indicators are: (1) intersections, (2) overbought / oversold conditions, and (3) divergences.
1. Intersections .
If the main line of the indicator falls below the signal line, then you should sell; if it rises above the signal line, buy. As signals to buy / sell, the intersection of the main line of the zero mark up / down is also used.
2. Overbought / Oversold conditions.
If the indicator is very high, the price is too high and will soon return to a more realistic level.
3. Divergences .
If a higher price high is not confirmed by a higher high on the indicator (bearish divergence) or vice versa, a lower minimum is not confirmed by a minimum on the indicator (bullish divergence), this means the end of the trend and the possible reversal of the trend. Discrepancies are most significant if they form in overbought / oversold areas.
Indicator settings.
- Price type - applied price. Values: Close price (default), Open price, High price, Low price, Median price ((high + low)/2), Typical price ((high + low + close)/3), Weighted price ((high + low + 2*close)/4).
- The averaging period - averaging period. Values: any integer (9 default).
- Main line thickness - Values: any integer (1 default).
- Signal line thickness - Values: any integer (1 default).
- Data in points of possible profit? - Show data in points of possible profit? Values: true (default), false.
- The Signal method - Type of trading signal alert. Values: No, Send alert, Print (in expert), Comment (in chart), Sound + Print, Sound + Comment, Sound, Push + Comment, Push, Mail + Comment, Mail.

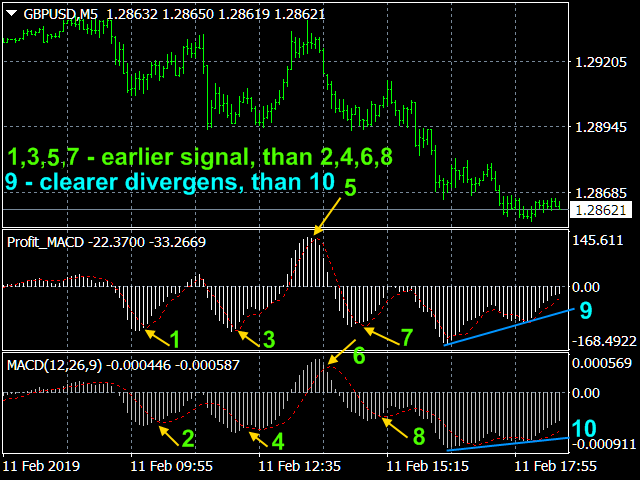

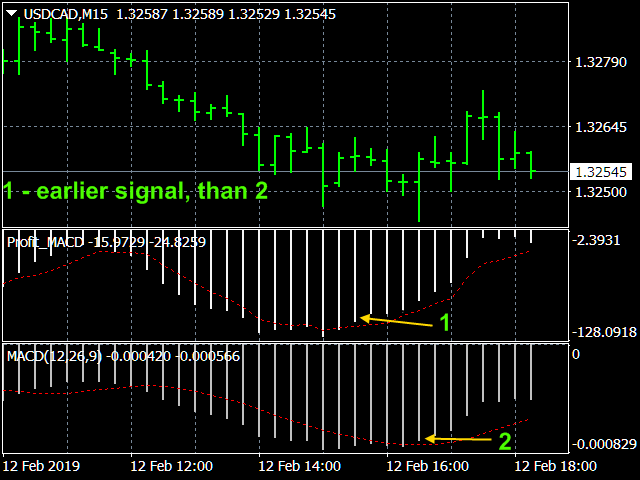
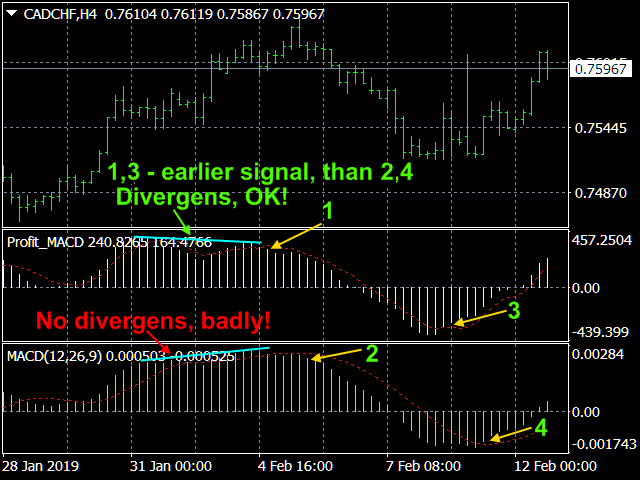
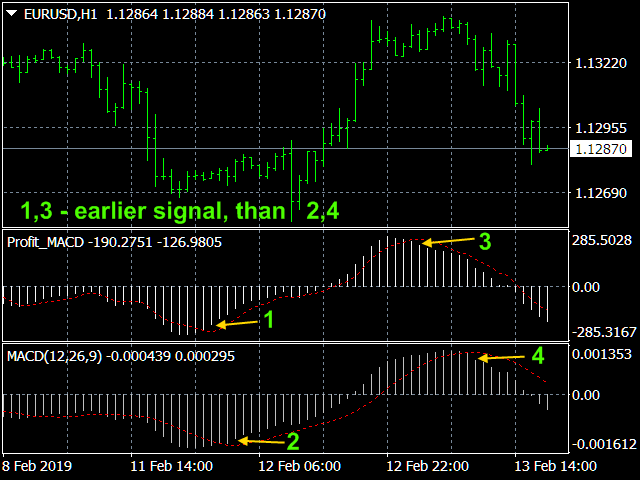



I find this indicator useful for manual trading.