Trend dashboard
- Indikatoren
- Jan Flodin
- Version: 1.8
- Aktualisiert: 5 September 2021
- Aktivierungen: 10
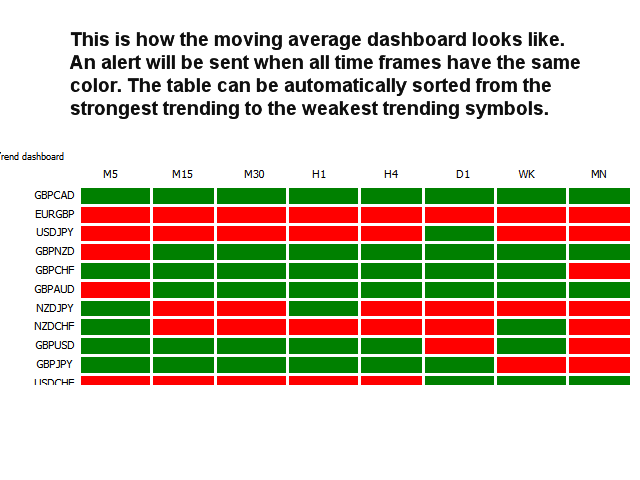
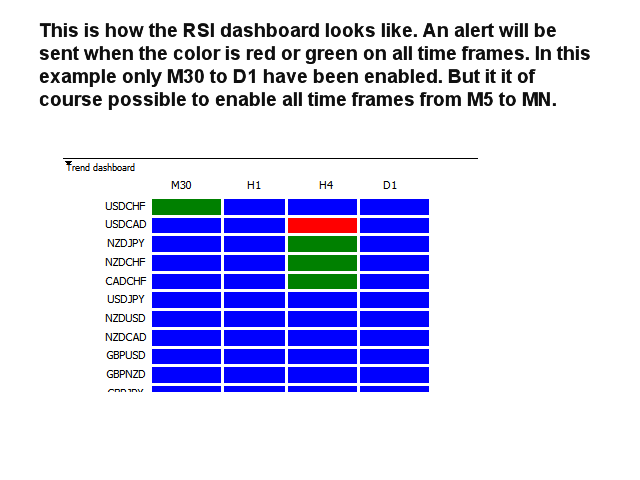
Dieser Multi-Time-Frame- und Multi-Symbol-Trendindikator sendet eine Warnung, wenn ein starker Trend oder eine Trendumkehr identifiziert wurde. Es kann dies tun, indem es den Aufbau des Dashboards mit dem gleitenden Durchschnitt (einfach oder doppelt (MA-Crossover)), RSI, Bollinger-Bändern, ADX, zusammengesetztem Index, Parabolic SAR, Awesome (AO), MACD (Signallinie), Stochastik-Crossover oder Hull Moving Average . Es kann mit allen Zeitrahmen von M5 bis MN verwendet werden. Die Farben im Dashboard sind grün für bullish, rot für bearish und blau für neutral (Indikatorwerte liegen nicht im Bereich).
In Kombination mit Ihren eigenen Regeln und Techniken ermöglicht Ihnen dieser Indikator, Ihr eigenes leistungsstarkes System zu erstellen (oder zu verbessern).
Merkmale
- Der Indikator kann die Signale in globale Variablen schreiben, die von einem Expert Advisor für den automatischen Handel verwendet werden können. Zum Beispiel dieses Produkt .
- Es ist möglich, die zu verwendenden Zeitrahmen auszuwählen.
- Führt kontinuierlich eine Sortierung nach Trendstärke innerhalb des Dashboards durch. Es ist jedoch möglich, diese Sortierung zu deaktivieren, um das Auffinden eines bestimmten Symbols zu erleichtern. Die Symbole werden dann in derselben Reihenfolge angezeigt, in der sie im Parameter Symbole eingegeben wurden, oder in der Reihenfolge, in der sie im Fenster Market Watch sichtbar sind.
- Durch Klicken in ein Rechteck wird ein neuer Chart mit dem entsprechenden Symbol und Zeitrahmen geöffnet.
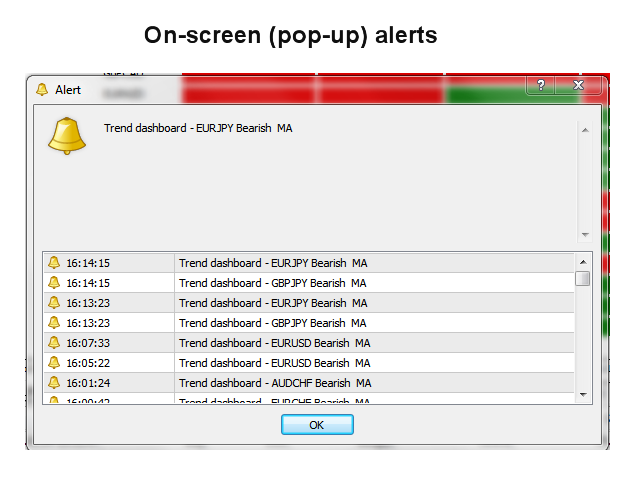
Es reicht aus, den Indikator auf einem Chart zu platzieren und Sie erhalten eine Benachrichtigung von einem beliebigen Symbol Ihrer Wahl. Alle Alert-Typen werden unterstützt.
Eingabeparameter
Die Beschreibung und Erläuterung der Eingabeparameter finden Sie hier .
Bitte beachten Sie, dass dieser Indikator im Strategietester nicht unterstützt wird. Es wird auch keine Linien und Pfeile zeichnen oder Verkaufs- und Kaufempfehlungen auf einem Chart darstellen.
Der Indikator muss auf einem M5-Chart platziert werden, einem sauberen (leeren) Chart ohne andere Indikatoren oder Expert Advisors darauf, die das Dashboard stören könnten. Das Dashboard wird in ein Indikatorfenster geladen, das Sie dann erweitern können, um den gesamten Chart abzudecken.

Der Benutzer hat keinen Kommentar hinterlassen