Breakout Pro Scalper Solution
- Indikatoren
- Remi Passanello
- Version: 1.11
- Aktualisiert: 8 März 2019
- Aktivierungen: 5
NIEMALS neu lackieren.
Indikationen werden von nah zu nah gegeben.
Für den alleinigen Gebrauch konzipiert, es sind keine weiteren Indikatoren erforderlich.
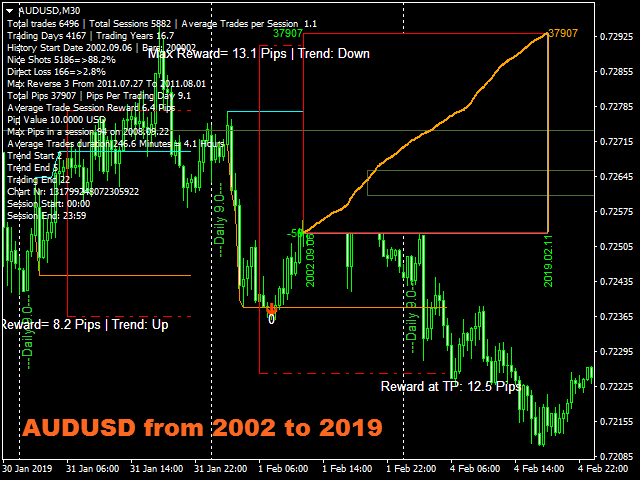
Gibt Ihnen zu Beginn des Tages den Trend und den potenziellen Take-Profit.
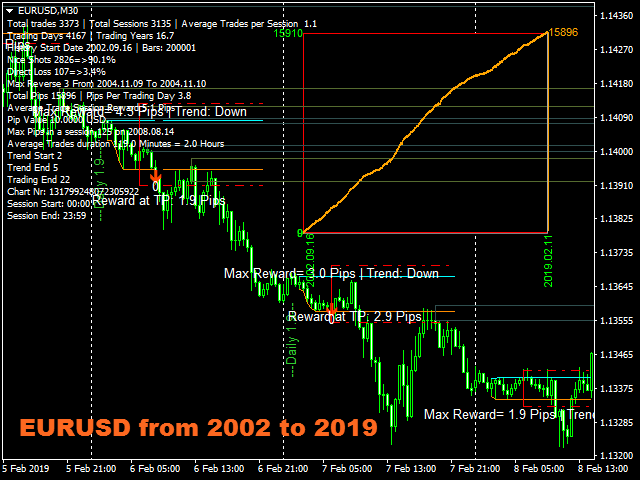
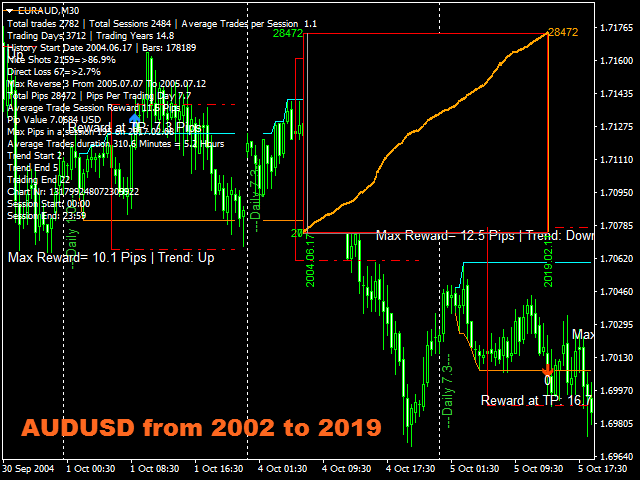
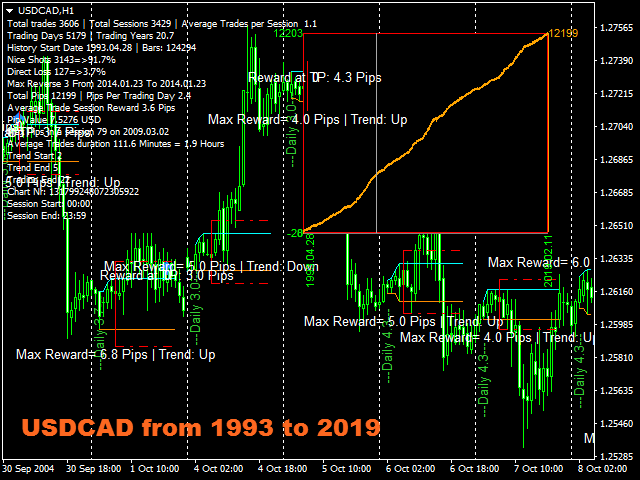
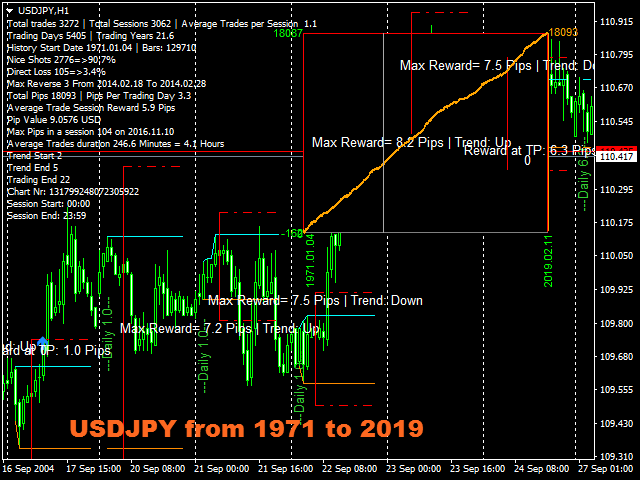
Eine spezifische Grafik zeigt Ihnen den potenziellen Gewinn gemäß den historischen Daten.
Wie funktioniert es
Breakout Pro Scalper Solution verwendet eine Breakout-Strategie in Kombination mit Kursbewegungen und dynamischer Unterstützung und Widerständen.
Der Nachttrend und die Volatilität werden analysiert, um am nächsten Tag verwendet zu werden.
Aus dieser Analyse werden die Breakout-Limits (blaue und dunkelorange Linien) und auch der Take Profit bestimmt
Der "Erfolg" der Strategie und Einstellungen kann dank der Grafik auf dem Diagramm sofort überprüft werden.
Das OnChart-Diagramm ermöglicht es, sofort zu sehen, ob es irgendwelche "Löcher" in der Strategie gibt, und schließlich einen anderen Zeitrahmen oder ein anderes Symbol auszuwählen, das besser passen würde.
In Echtzeit von Kerzenschluss bis Kerzenschluss wartet der Trendindikator auf die Gültigkeit der Signalbedingungen und zeigt dies dann durch einen Pfeil an (grün für Kauf und orange für Verkauf).
Die roten Strichpunktlinien zeigen, wo der Take Profit und der eventuelle Stop Loss zu platzieren sind.
Trades werden einzeln angezeigt, es gibt niemals zwei Trades gleichzeitig.
Die meisten Trades (80 %) werden tagsüber abgeschlossen.
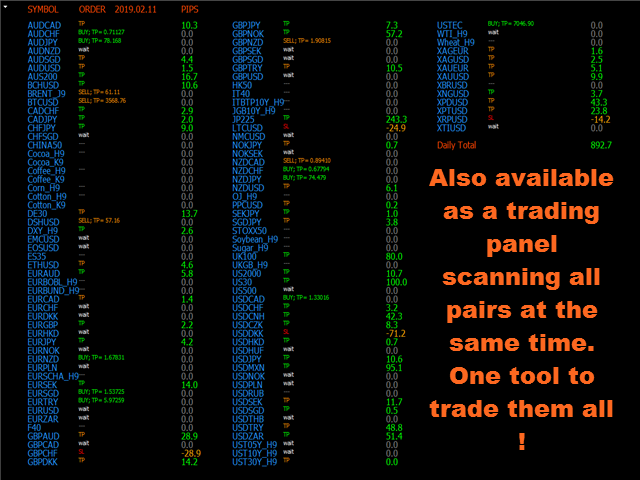
Breakout Pro Scalper Solution zeigt:
Wo Sie Ihre Trades eröffnen können.
Take-Profit und Stop-Loss.
Die potenzielle Menge an Pips, die gefangen werden können.
Breakout Pro Scalper Solution funktioniert
Mit jedem Instrument wie FX-Paaren, Indizes, Metallen, Futures oder anderen, wenn die Notierungen über Nacht geliefert werden.
Von M15 bis H1.
Bei jedem Makler.
Funktionen der Breakout Pro Scalper-Lösung
Zuverlässige Kauf-/Verkaufssignale.
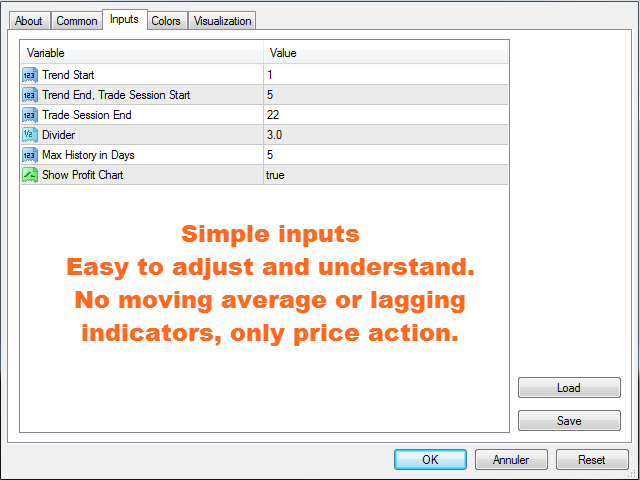
Sehr einfache Eingaben.
On Screen Alert + Push-Benachrichtigungen + E-Mail-Benachrichtigungen
Alle Benachrichtigungen sind sehr detailliert und geben auch Take Profit, es ermöglicht den Handel von einem mobilen Gerät aus.
Auf dem Diagramm Gewinn-Pips-Diagramm, das den Saldo für die gesamten Verlaufsdaten zeigt. Es ist leicht zu erkennen, ob die Strategie mit dem ausgewählten Instrument übereinstimmt.
Das On Chart-Diagramm kann mit der Maus verschoben werden, doppelklicken Sie darauf und verschieben Sie es an eine beliebige geeignete Position auf dem Bildschirm.
Die Unterstützungen und Widerstände werden auf dem Chart angezeigt.
Auf dem Diagramm werden ebene Linien mit dünnen und dicken Bereichen angezeigt.
So verwenden Sie die Breakout Pro Scalper-Lösung
Tragen Sie es einfach in Ihre Karte(n) ein.
Folgen Sie einfach den Pfeilen und den Take-Profit-/Stop-Loss-Anzeigen.
Eingänge
Trend Start: [Integer] Geben Sie hier die Zeit für den Beginn des Nachttrends ein. Der Standardwert ist 1 Uhr; es passt für die meisten FX-Paare, die von 0 bis 23:59 notiert werden.
Trendende, Start der Handelssitzung: [Integer] Geben Sie hier die Zeit für das Ende des Nachttrends und den Beginn der Handelssitzung ein. Der Standardwert passt zu den meisten Instrumenten.
Ende der Handelssitzung: [Integer] Zeigt nach dieser Zeit keine Trades an.
Teiler: [Double] Teilt den Abstand zwischen Trendstart und Trendende, um Take Profit und SL zu berechnen. Der Standardwert ist 3, was bedeutet, dass TP und SL 1/3 der Nachtvolatilitätsentfernung betragen.
Max History in Days: [Integer] Legt die Verlaufsdauer in Tagen für die grauen Preislinien fest.
Gewinndiagramm anzeigen: [Bool] true = Gewinndiagramm anzeigen, false = nicht anzeigen.
Testen
Seien Sie nicht in Eile, der Test ist ziemlich langsam, da er komplizierte Berechnungen durchführt. Auf jeden Fall müssen Sie nicht lange warten, um zu sehen, dass die Strategie wirklich profitabel ist.
Nächste Ausgabe
Eine Neuerscheinung soll bald kommen. Es wird direkt Unterstützung und Widerstände verwenden, um Take-Profit, Stop-Loss anzupassen und Handelsstartsignale zu filtern.
Ein dritter verwendet die Preislinien, um Preisbewegungen "vorherzusagen".
Die bisherigen Strategien können in den neuen Releases ausgewählt und verwendet werden.

incredible. Still have to find out some more details and how to avoid triggered trades, which run in the opposite direction right afterwards into a possible stopp/loss. But this simply never happens. So five stars for this masterpiece!