ColorCMI
- Indikatoren
- Ahmet Metin Yilmaz
- Version: 1.0
- Aktivierungen: 5
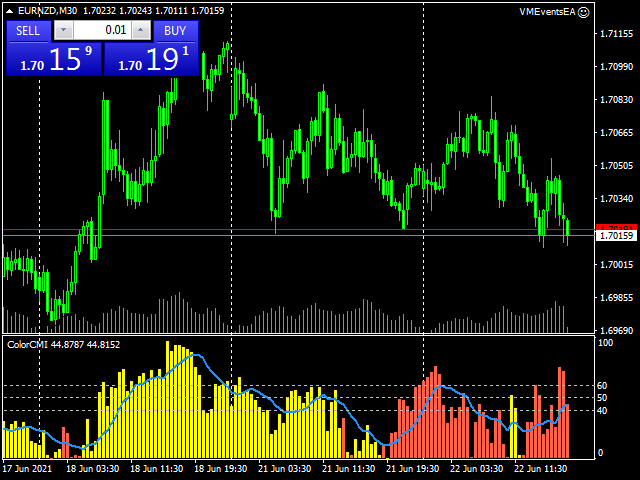
Indicator values are in the range 0-100.
The greater is the indicator value, the greater is the market stability,
so the more likely we have trend.
The smaller is the indicator value - the less probable the trend is.
Tips:
Trading on unstable market:
Buy, when moving average (blue line) of the CMI indicator is below 40 and the histogram is red.
Sell when moving average (blue line) of the CMI indicator is below 40 and the histogram is green.
Close positions when CMI histogram is above 50.
Trading on trend market:
Buy when moving average is above 60 and the histogram is green.
Sell when moving average is above 60 and the histogram is red.
Close positions, when CMI histogram is below 50.
This indicator can be used as a filter in trend trading strategies.
