• Übersicht
  • Bewertungen
  • Diskussion
  • Neue Funktionen

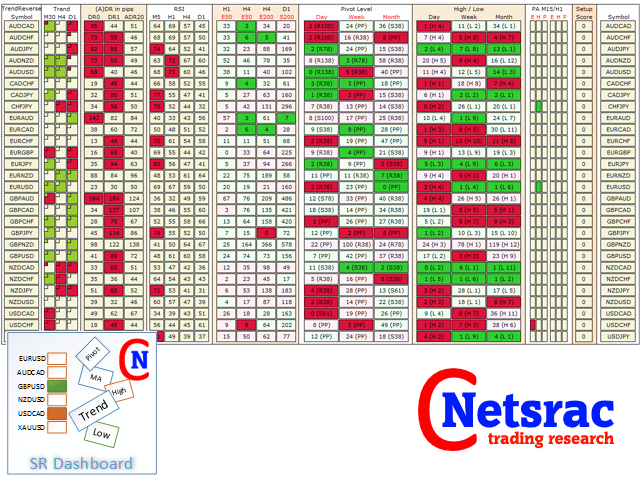
Netsrac SR Dashboard Free

Mit dem SR Dashboard erhalten Sie ein mächtiges Werkzeug zur Kontrolle von einigen der wichtigsten Informationen im Trading. Stellen Sie sich ein Setup ganz nach ihrer Strategie zusammen und lassen sich informieren, sobald dieses Setup gültig ist. Vergeben Sie verschiedene Punkte auf ausgewählte Bedingungen. Wählen Sie aus Trend, Average Daily Range, Moving Averages, Pivot (Daily, Weekly, Monthly), Highs und Lows sowie Candlestick-Pattern.


Hinweis: Dieser Indikator ist die freie Version des Netsrac SR Dashboard. Diese Version unterstützt nur zwei Symbole - es werden keine Alarme ausgelöst. Sie finden die Vollversion unter https://www.mql5.com/de/market/product/34855


Anwendung

Sie werden mit dem SR Dashboard in die Lage versetzt, einige interessante Setups zusammenzustellen. Nur drei Beispiele von vielen möglichen:

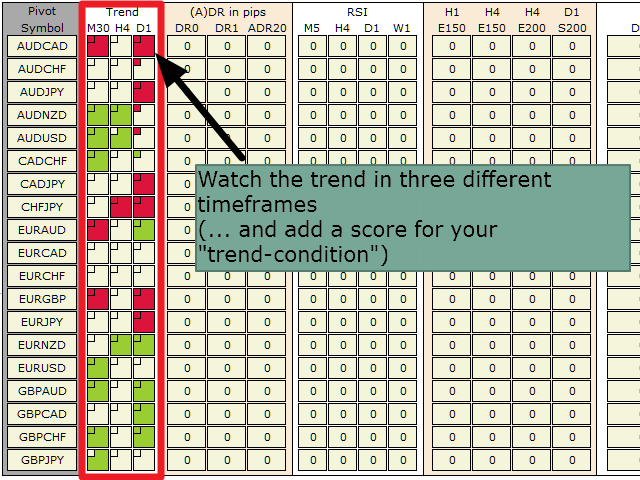
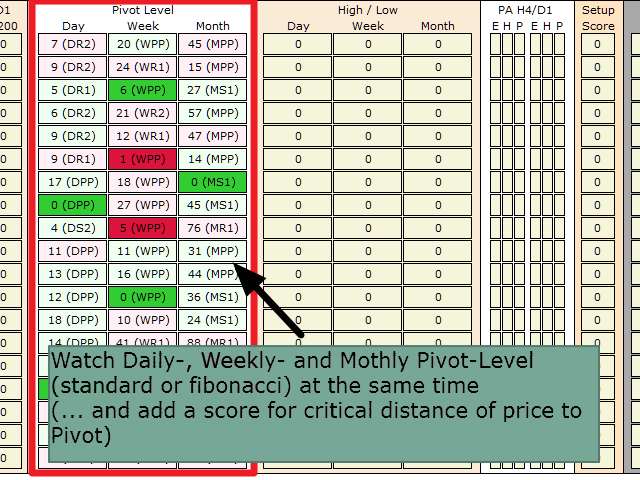
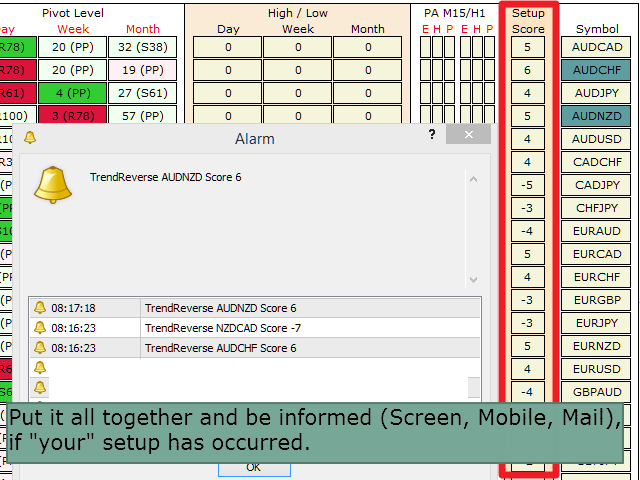
Korrektur eines Trends mittels Weekly Pivot Levels handeln: Verwenden Sie hierfür die Sektionen Trend, Pivot und Price Action/Candlestickpattern. Zur Bestätigung könnten Sie auch die Sektion Moving Averages hinzufügen. Vergeben Sie Bewertungspunkte (Scores) für die einzelnen Bedingungen und lassen Sie sich informieren, wenn ein Symbol die minimale Punktzahl für den Alarm überschreitet.

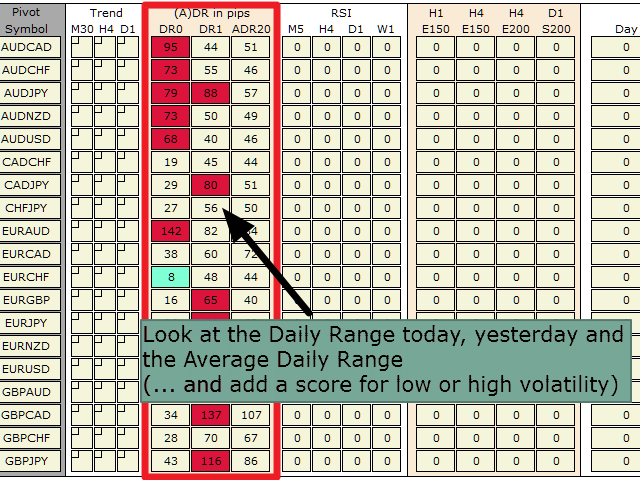
Ausbruch aus niedriger Volatilität handeln: Nutzen Sie die Sektion ADR und lassen Sie sich benachrichtigen, wenn ein oder mehrere Symbole sowohl gestern als auch heute unter einer minimalen Daily Range geblieben sind. Verwenden Sie dafür die Bewertungspunkte (Scores). Sie könnten dann mittels Stop-Orders auf den Ausbruch aus dieser niedrigen Volatilität spekulieren.

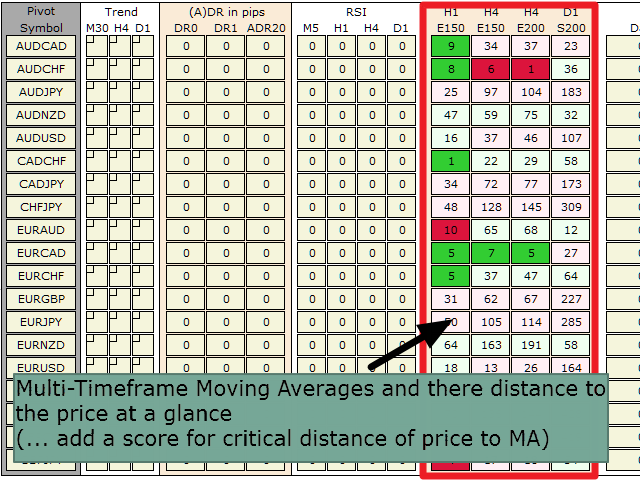
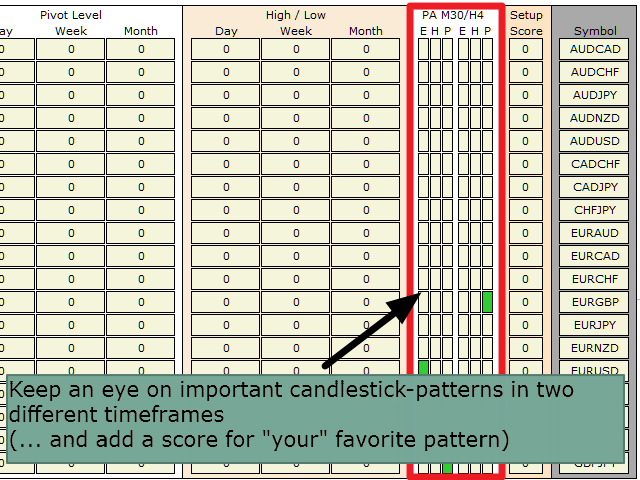
Pinbar-Trading: Aktivieren Sie die Sektionen Trend, Moving Average, Pivot und Price Action/Candlestick-Pattern und vergeben Sie die Bewertungspunkte (Scores). Lassen Sie sich benachrichtigen, wenn sich eine Pinbar gebildet hat und ein kritischer Abstand zu einem wichtigen Moving Average oder einem Pivot-Level unterschritten wurde. Aktivieren Sie die Trend-Sektion, um einen Wechsel im Trend als weitere Bestätigung zu bekommen.

Dies sind nur drei der vielen, vielen Möglichkeiten, welche das Dashboard ihnen bietet. Nutzen Sie das Dashboard als Unterstützung für ihren diskretionären Handel. Sie werden viel Zeit am Bildschirm sparen können.


Handbuch


Empfohlene Produkte
Contact me for any queries or custom orders, if you want to use this in an EA. Key Features: Pattern Recognition : Identifies Fair Value Gaps (FVGs) Spots Break of Structure (BOS) points Detects Change of Character (CHoCH) patterns Versatile Application : Optimized for candlestick charts Compatible with any chart type and financial instrument Real-Time and Historical Analysis : Works seamlessly with both real-time and historical data Allows for backtesting strategies and live market analysis V
FREE
Willkommen zu unserem   Preiswellenmuster   MT4 – (ABCD-Muster) –     Das ABCD-Muster ist ein leistungsstarkes und weit verbreitetes Handelsmuster in der Welt der technischen Analyse. Es handelt sich um ein harmonisches Preismuster, das Händler nutzen, um potenzielle Kauf- und Verkaufschancen auf dem Markt zu identifizieren. Mit dem ABCD-Muster können Händler potenzielle Preisbewegungen vorhersehen und fundierte Entscheidungen darüber treffen, wann sie Geschäfte eingehen und beenden. EA-Vers
FREE
Wicks UpDown Target GJ Wicks UpDown Target GJ is specialized in GJ forex pairs. Choppy movement up and down on the opening range every day.  Trading breakouts on London session and New York session is recommended. Guideline Entry Strategy Idea: Step 1 - Breakout Forming (Warning! Trade on London Session and New York Session) Step 2 - Breakout Starting (Take Action on your trading plan) Step 3 - Partial Close your order & set breakeven (no-risk) Step 4 - Target complete Step 5 - Don't tr
FREE
QuantumAlert Stoch Navigator is a free indicator available for MT4/MT5 platforms, its work is to provide "alerts" when the market is inside "overbought and oversold" regions in the form of "buy or sell" signals. This indicator comes with many customization options mentioned in the parameter section below, user can customise these parameters as needful. Join our   MQL5 group , where we share important news and updates. You are also welcome to join our private channel as well, contact me for the p
FREE
The Indicator show Daily Pivot Points. It is possible to specify the number of days to display. For forex it doesn't consider the sunday session data. It is possibile to modify the color, style and  width for every level.It is better to use this indicator with timeframe not higher than Н1. 4 Levels of support and resistance with also Intermediate Levels that is possible to hide.
FREE
TrendPlus
Sivakumar Subbaiya
4.08 (12)
Trend Plus   Trendplus  Indicator   Time Frame: Suitable for any time frame.  Purpose: Trend Prediction. Blue and red candle indicate the buy and sell call respectively. Buy: When the blue candle is formed buy call is initiated. close the buy trades when the next red candle will formed.   Sell: When the Red candle is formed Sell call is initiated. close the Sell trades when the next blue candle will formed.   Happy trade!!
FREE
Email Drawdown Alert
Roman Starostin
5 (12)
Free informative Indicator-helper. It'll be usefull for traders who trade many symbols or using grid systems (Averaging or Martingale). Indicator counts drawdown as percent and currency separate. It has a number of settings: Count deposite drawdown according equity value and send e-mail or notifications to user if DD more than set; Sending e-mail when max open orders reached; Shows price and remaining pips amount before MarginCall on current chart and Account generally; Display summary trade lot
FREE
Follow The Line
Oliver Gideon Amofa Appiah
4.07 (14)
FOLLOW THE LINE GET THE FULL VERSION HERE: https://www.mql5.com/en/market/product/36024 This indicator obeys the popular maxim that: "THE TREND IS YOUR FRIEND" It paints a GREEN line for BUY and also paints a RED line for SELL.  It gives alarms and alerts of all kinds. IT DOES NOT REPAINT and can be used for all currency pairs and timeframes. Yes, as easy and simple as that. Even a newbie can use it to make great and reliable trades. NB: For best results, get my other premium indicators for more
FREE
Discover the power of precision and efficiency in your trading with the " Super Auto Fibonacci " MT4 indicator. This cutting-edge tool is meticulously designed to enhance your technical analysis, providing you with invaluable insights to make informed trading decisions. Key Features: Automated Fibonacci Analysis: Say goodbye to the hassle of manual Fibonacci retracement and extension drawing. "Super Auto Fibonacci" instantly identifies and plots Fibonacci levels on your MT4 chart, saving you tim
FREE
Pivot Point Fibo RSJ ist ein Indikator, der die Unterstützungs- und Widerstandslinien des Tages mithilfe von Fibonacci-Kursen verfolgt. Dieser spektakuläre Indikator erzeugt bis zu 7 Unterstützungs- und Widerstandsebenen durch Pivot Point unter Verwendung von Fibonacci-Kursen. Es ist fantastisch, wie die Preise jedes Niveau dieser Unterstützung und dieses Widerstands respektieren, wo es möglich ist, mögliche Einstiegs- / Ausstiegspunkte einer Operation zu erkennen. Merkmale Bis zu 7 Unter
FREE
Trend arrow Indicator
NGUYEN NGHIEM DUY
3.33 (9)
Trend arrow Indicator is an arrow Indicator used as an assistant tool for your trading strategy. The indicator analyzes the standard deviation of bar close for a given period and generates a buy or sell signals if the deviation increases. It good to combo with Martingale EA to follow Trend and Sellect Buy Only/Sell Only for EA work Semi-Automatic. You can use this  Indicator with any EAs in my Products.
FREE
Bar Size MT4
Mikhail Tcvetkov
5 (3)
Der technische Indikator sucht in Echtzeit nach Kerzen, die die in den Einstellungen festgelegte Größe überschreiten und gibt Signale an. In der Regel erscheinen solche ungewöhnlich großen Kerzen entweder am Anfang starker Impulse oder am Ende einer gerichteten Kursbewegung. Am Anfang des Impulses kann das Signal als Grundlage für die Suche nach einem Einstiegspunkt dienen, am Ende der Bewegung ist es ein Zeichen für einen Höhepunkt und kann von einem nahen Ende des Trends sprechen. Die Referenz
FREE
Market Profile 3
Hussien Abdeltwab Hussien Ryad
3 (2)
Market Profile 3 MetaTrader 4 indicator  — is a classic Market Profile implementation that can show the price density over time, outlining the most important price levels, value area, and control value of a given trading session. This indicator can be attached to timeframes between M1 and D1 and will show the Market Profile for daily, weekly, monthly, or even intraday sessions. Lower timeframes offer higher precision. Higher timeframes are recommended for better visibility. It is also possible t
FREE
MQLTA Support Resistance Lines is an indicator that calculates the historical levels of Support and Resistance and display them as Lines on chart. It will also Alert you if the price is in a Safe or Dangerous zone to trade and show you the distance to the next level. The indicator is ideal to be used in other Expert Advisor through the iCustom function. This DEMO only works with AUDNZD, the full product can be found at https://www.mql5.com/en/market/product/26328 How does it work? The indicato
FREE
Rainbow MT4
Jamal El Alama
Rainbow MT4 is a technical indicator based on Moving average with period 34 and very easy to use. When price crosses above MA and MA changes color to green, it’s a signal to buy. When price crosses below MA and MA changes color to red, it’s a signal to sell. The Expert advisor ( Rainbow EA MT4) based on Rainbow MT4 indicator, as you can see in the short video below is now available here .
FREE
Triple RSI
Pablo Leonardo Spata
1 (1)
LOOK AT THE FOLLOWING STRATEGY   WITH THIS INDICATOR.   Triple RSI   is a tool that uses the classic Relative Strength Indicator, but in several timeframes to find market reversals.    1.  ️ Idea behind the indicator and its strategy: In Trading, be it Forex or any other asset, the ideal is   to keep it simple, the simpler the better . The   triple RSI   strategy is one of the simple strategies that seek market returns. In our experience, where there is more money to always be won, i
FREE
This indicator is one of the useful tools for traders who trade on currency pairs and based on the strength of each currency they can make a correct decision or confirmation in the positions.  It has been calculated for all the minor currency pairs supported by the broker and displays the values of the major currencies. These currencies are displayed horizontally or vertically according to the trader's config when executing the indicator. One of the trading strategies that can be used is to cho
FREE
Extremum Reverse Bar
Yurij Izyumov
2.8 (5)
This indicator has been created for finding the probable reversal points of the symbol price. A small candlestick reversal pattern is used it its operation in conjunction with a filter of extremums. The indicator is not redrawn! If the extremum filter is disabled, the indicator shows all points that have a pattern. If the extremum filter is enabled, the condition works – if the history Previous bars 1 candles back contains higher candles and they are farther than the Previous bars 2 candle, such
FREE
Virtual Targets
Hoang Van Dien
3.83 (6)
This indicator is very useful for day traders or short term traders. No need to calculate the number of pips manually, just look at the chart and you will see the Virtual Take Profit / Virtual Stop Loss target line and evaluate whether the entry point is feasible to reach the intended target or not. Enter the intended Take Profit / Stop Loss pips for your trade. The indicator will display Virtual Take Profit / Virtual Stop Loss lines for you to easily see if the target is feasible or not.
FREE
Free automatic Fibonacci is an indicator that automatically plots a Fibonacci retracement based on the number of bars you select on the BarsToScan setting in the indicator. The Fibonacci is automatically updated in real time as new highest and lowest values appears amongst the selected bars. You can select which level values to be displayed in the indicator settings. You can also select the color of the levels thus enabling the trader to be able to attach the indicator several times with differe
FREE
This indicator shows the latest untouched support and resistance as horizontal lines. The indicator can show support/resistance from higher timeframes. With this indicator you can e.g. easily see the support/resistance of the timeframes H4, D1 and W1 on a H1 chart, which can be a big advantage while time your entry on H1. This is the FREE version of the indicator: Support Resistance Multi Time Frame The free version works only on EURUSD and GBPUSD! Parameters referenceTF: the timeframe from wh
FREE
Highlights trading sessions on the chart The demo version only works on the AUDNZD chart!!! The full version of the product is available at: (*** to be added ***) Trading Session Indicator displays the starts and ends of four trading sessions: Pacific, Asian, European and American. the ability to customize the start/end of sessions; the ability to display only selected sessions; works on M1-H2 timeframes; The following parameters can be configured in the indicator: TIME_CORRECTION = Cor
FREE
QuantumAlert RSI Navigator is a free indicator available for MT4/MT5 platforms, its work is to provide "alerts" when the market is inside "overbought and oversold" regions in the form of "buy or sell" signals. This indicator comes with many customization options mentioned in the parameter section below, user can customise these parameters as needful. Join our   MQL5 group , where we share important news and updates. You are also welcome to join our private channel as well, contact me for the pri
FREE
MegaTrends
Sivakumar Subbaiya
1 (1)
Megatrends  Indicator   Time Frame: Suitable for any time frame.  Purpose: Trend Prediction. Blue and red color indicate the buy and sell call respectively. Buy: When the blue line is originating it is opened buy call. Sell: When the Red line is origination it is opened sell call Happy trade!! this indicator is suitable for all time frame, but our recommended time frame to use 1hour and 4 hours, suitable for any chart.
FREE
EUR INDEX The Currency Index Project is ONE part of a thorough Forex study. Many people do not know the theoretical basis that drives currency exchange rates to move on the market. With this set of tools you will be able to have a more complete view of the entire market by analyzing not only the single currency of an exchange, but all the exchange rates that make up that currency by looking at a single window! The indicator faithfully represents the real index of a single currency present in
FREE
Are you tired of drawing trendlines every time you're analyzing charts? Or perhaps you would like more consistency in your technical analysis. Then this is for you. This indicator will draw trend lines automatically when dropped on a chart. How it works Works similar to standard deviation channel found on mt4 and mt5. It has 2 parameters: 1. Starting Bar 2. Number of bars for calculation The   starting bar   is the bar which drawing of the trend lines will begin, while the   number of bars for c
FREE
FRM Half Trend
Noiros Tech
5 (1)
YOU CAN NOW DOWNLOAD FREE VERSIONS OF OUR PAID INDICATORS . IT'S OUR WAY OF GIVING BACK TO THE COMMUNITY ! >>>    GO HERE TO DOWNLOAD   The system is a free open source pine script originally published on TradingView by everget   . It was converted to Mt4 by Forex Robot Makers. This system is a  popular trend indicator based on ATR ( Average True Range ) , Moving Averages and the Donchian channel . System BackGround ATR The average true range is an indicator of the price volatility of an as
FREE
--->  Check all the other products  <--- The Candle Bias is a coloring indicator that doesn't take account of the close price of the bars.  It will color the candle in the bearish color (of your choice) if the downard range is greater than the upward range.  Conversely, it will color the candle in the bullish color of your choice if the upward range is greater than the downward range.  This is a major helper for Multi Time Frame analysis, it works on every security and every Time Frame. You
FREE
Wise Men Indicator demo
Bohdan Kasyanenko
3 (2)
The indicator displays signals according to the strategy of Bill Williams on the chart. Demo version of the indicator has the same features as the paid, except that it can work only on a demo account . Signal "First Wise Man" is formed when there is a divergent bar with angulation.  Bullish divergent bar - with lower minimum and closing price in the upper half. Bearish divergent bar - higher maximum and the closing price at the bottom half. Angulation is formed when all three lines of Alligat
FREE
Magic Supply Demand Indicator works on all products and timeframes. It is a new formula, and   the very new features are two zone strength functions adjustable by user input!   This is a great advantage in trading. When you learn how to use the proprietary features such as the zone strength with   min X-factor of price travel away, you will be able to tell whether the zone is strong or not. The supply and demand zones are used as an alert trigger.   You can use popup alert with sound on MetaTr
FREE
Käufer dieses Produkts erwarben auch
Gann Made Easy
Oleg Rodin
4.85 (82)
Gann Made Easy ist ein professionelles und einfach zu bedienendes Forex-Handelssystem, das auf den besten Handelsprinzipien unter Verwendung der Theorie von Mr. basiert. W.D. Gann. Der Indikator liefert genaue KAUF- und VERKAUFSsignale, einschließlich Stop-Loss- und Take-Profit-Levels. Mit PUSH-Benachrichtigungen können Sie auch unterwegs handeln. Bitte kontaktieren Sie mich nach dem Kauf! Ich werde meine Handelstipps und tolle Bonusindikatoren kostenlos mit Ihnen teilen! Wahrscheinlich haben Si
Enigmera
Ivan Stefanov
5 (3)
ENIGMERA: Der Kern des Marktes https://www.enigmera.com Einführung Dieser Indikator und dieses Handelssystem sind ein bemerkenswerter Ansatz für die Finanzmärkte. ENIGMERA nutzt die fraktalen Zyklen zur genauen Berechnung von Unterstützungs- und Widerstandsniveaus. Er zeigt die echte Akkumulationsphase an und gibt Richtung und Ziele vor.  Ein System, das funktioniert, egal ob wir uns in einem Trend oder in einer Korrektur befinden.  Wie funktioniert es? ENIGMERA besteht aus drei Linien: der
Trend Punch
Mohamed Hassan
4.95 (19)
This indicator is unstoppable when combined with our other indicator called  Support & Resistance . After purchase, send us a message and you will get it   for  FREE as a BONUS! Introducing Trend Punch , the revolutionary forex trend indicator that will transform the way you trade! Trend Punch is uniquely designed to provide precise buy and sell arrows during strong market trends, making your trading decisions clearer and more confident. Whether you're trading major currency pairs or exotic sym
Gold Stuff
Vasiliy Strukov
4.89 (239)
Gold Stuff-Ein Trendindikator, der speziell für Gold entwickelt wurde, kann auch auf allen Finanzinstrumenten verwendet werden. Der Indikator wird nicht neu gezeichnet und verzögert sich nicht. Empfohlener Zeitrahmen H1. Nach diesem Indikator geschrieben EA Gold Stuff Berater, können Sie es in meinem Profil finden. WICHTIG! Kontaktieren Sie mich sofort nach dem Kauf, um Anweisungen und Bonus zu erhalten!   Sie können eine kostenlose Kopie unseres Strong Support- und Trendscanner-Indikators
TPSproTREND PrO
Roman Podpora
4.79 (19)
TPSpro TREND PRO   ist ein Trendindikator, der den Markt automatisch analysiert und Informationen über den Trend und jede seiner Änderungen liefert sowie Signale für den Einstieg in Geschäfte ohne Neuzeichnung gibt! Der Indikator verwendet jede Kerze und analysiert sie separat. bezieht sich auf verschiedene Impulse – Aufwärts- oder Abwärtsimpuls. Exakte Einstiegspunkte in Transaktionen für Währungen, Krypto, Metalle, Aktien, Indizes! Version MT5                   VOLLSTÄNDIGE BESCHREIBUNG DES
TPSpro RFI Levels
Roman Podpora
4.82 (22)
ANWEISUNGEN    Russland -    ENG    Die Empfehlung basiert auf dem Indikator -   TPSpro   TREND PRO -   Version MT5 Die wichtigsten Elemente in der Branche sind entweder in Zonen oder in der Fabrik enthalten, oder sie führen zu einer Lösung bei einem Kauf oder dem Verkauf eines anderen Instruments. Wenn viele Menschen ihre Rechte nicht auf dem Händlerkonto verschlüsseln, werden die Folgen nicht schnell genug sein. Ich habe es damit abgeschlossen, dass ich diese Folgen nun noch interpretieren un
Scalper Inside PRO
Alexey Minkov
4.73 (56)
An exclusive indicator that utilizes an innovative algorithm to swiftly and accurately determine the market trend. The indicator automatically calculates opening, closing, and profit levels, providing detailed trading statistics. With these features, you can choose the most appropriate trading instrument for the current market conditions. Additionally, you can easily integrate your own arrow indicators into Scalper Inside Pro to quickly evaluate their statistics and profitability. Scalper Inside
- Real price is 80$ - 40% Discount ( It is 49$ now ) Contact me for instruction, add group and any questions! Related Product:  Bitcoin Expert Introduction The breakout and retest strategy is traded support and resistance levels. it involves price breaking through a previous level.  The break and retest strategy is designed to help traders do two main things, the first is to avoid false breakouts. Many false breakouts start with a candlestick that breaks out of a level but ends with an immediat
Trend Screener
STE S.S.COMPANY
4.8 (87)
Trendindikator, bahnbrechende, einzigartige Lösung für Trendhandel und -filterung mit allen wichtigen Trendfunktionen in einem Tool! Es handelt sich um einen 100 % nicht neu zu malenden Multi-Timeframe- und Multi-Währungs-Indikator, der für alle Symbole/Instrumente verwendet werden kann: Forex, Rohstoffe, Kryptowährungen, Indizes und Aktien. ZEITLICH BEGRENZTES ANGEBOT: Der Support- und Resistance-Screener-Indikator ist für nur 50 $ und lebenslang verfügbar. (Ursprünglicher Preis 250 $) (Angebot
Dynamic Forex28 Navigator – Das Forex-Handelstool der nächsten Generation AKTUELL 49 % RABATT. Dynamic Forex28 Navigator ist die Weiterentwicklung unserer seit langem beliebten Indikatoren und vereint die Leistung von drei in einem: Advanced Currency Strength28 Indicator (695 Bewertungen) + Advanced Currency IMPULSE mit ALERT (520 Bewertungen) + CS28 Combo Signals (Bonus) Details zum Indikator https://www.mql5.com/en/blogs/post/758844 Was bietet der Strength Indicator der nächsten Generation?
Derzeit 20% Rabatt! Die beste Lösung für jeden Neueinsteiger oder Expert Händler! Dieses Dashboard arbeitet mit 28 Währungspaaren. Es basiert auf 2 unserer Hauptindikatoren (Advanced Currency Strength 28 und Advanced Currency Impulse). Es bietet einen hervorragenden Überblick über den gesamten Forex-Markt. Es zeigt die Werte der Advanced Currency Strength, die Veränderungsrate der Währungen und die Signale für 28 Devisenpaare in allen (9) Zeitrahmen. Stellen Sie sich vor, wie sich Ihr Hande
FX Power MT4 NG
Daniel Stein
5 (12)
Erhalten Sie Ihr tägliches Marktupdate mit Details und Screenshots über unser Morning Briefing hier auf mql5 und auf Telegram ! FX Power MT4 NG ist die nächste Generation unseres langjährig sehr beliebten Währungsstärkemessers FX Power. Und was bietet dieser Stärkezähler der nächsten Generation? Alles, was Sie am ursprünglichen FX Power geliebt haben PLUS GOLD/XAU-Stärkeanalyse Noch präzisere Berechnungsergebnisse Individuell konfigurierbare Analysezeiträume Anpassbares Berechnungslimit für noc
MetaBands M4
Vahidreza Heidar Gholami
5 (2)
MetaBands verwendet leistungsstarke und einzigartige Algorithmen, um Kanäle zu zeichnen und Trends zu erkennen, sodass es Tradern potenzielle Punkte für den Einstieg und Ausstieg aus Trades bieten kann. Es ist ein Kanalindikator sowie ein leistungsstarker Trendindikator. Es umfasst verschiedene Arten von Kanälen, die einfach durch Verwendung der Eingabeparameter zusammengeführt werden können. MetaBands verwendet alle Arten von Warnmeldungen, um Benutzer über Marktereignisse zu informieren. Funkt
Atomic Analyst
Issam Kassas
5 (2)
Zunächst einmal ist es erwähnenswert, dass dieser Handelsindikator nicht neu malt, nicht neu zeichnet und keine Verzögerung aufweist, was ihn sowohl für manuellen als auch für Roboterhandel ideal macht. Benutzerhandbuch: Einstellungen, Eingaben und Strategie. Der Atom-Analyst ist ein PA-Preisaktionsindikator, der die Stärke und das Momentum des Preises nutzt, um einen besseren Vorteil auf dem Markt zu finden. Ausgestattet mit fortschrittlichen Filtern, die helfen, Rauschen und falsche Signale z
TrendMaestro
Stefano Frisetti
5 (3)
note: this indicator is for METATRADER4, if you want the version for METATRADER5 this is the link:  https://www.mql5.com/it/market/product/108106 TRENDMAESTRO ver 2.4 TRENDMAESTRO recognizes a new TREND in the bud, he never makes mistakes. The certainty of identifying a new TREND is priceless. DESCRIPTION TRENDMAESTRO identifies a new TREND in the bud, this indicator examines the volatility, volumes and momentum to identify the moment in which there is an explosion of one or more of these data a
DERZEIT 31% RABATT! Die beste Lösung für jeden Newbie oder Expert Trader! Dieser Indikator ist ein einzigartiges, qualitativ hochwertiges und erschwingliches Handelsinstrument, da wir eine Reihe von proprietären Funktionen und eine geheime Formel eingebaut haben. Mit nur EINEM Chart liefert er Alerts für alle 28 Währungspaare. Stellen Sie sich vor, wie sich Ihr Handel verbessern wird, weil Sie in der Lage sind, den genauen Auslösepunkt eines neuen Trends oder einer Scalping-Gelegenheit zu e
Supply and Demand Dashboard PRO
Bernhard Schweigert
4.8 (20)
Derzeit 20% reduziert! Dieses Dashboard ist eine sehr leistungsfähige Software, die mit mehreren Symbolen und bis zu 9 Zeitrahmen arbeitet. Es basiert auf unserem Hauptindikator (Beste Bewertungen: Advanced Supply Demand ).   Das Dashboard gibt einen guten Überblick. Es zeigt: Gefilterte Angebots- und Nachfragewerte einschließlich der Zonenstärkebewertung, Pips-Abstände zu/und innerhalb von Zonen, Es hebt verschachtelte Zonen hervor, Es gibt 4 Arten von Alarmen für die gewählten Symbole in
Stratos Pali
Michela Russo
5 (1)
Stratos Pali Indicator   is a revolutionary tool designed to enhance your trading strategy by accurately identifying market trends. This sophisticated indicator uses a unique algorithm to generate a complete histogram, which records when the trend is Long or Short. When a trend reversal occurs, an arrow appears, indicating the new direction of the trend. Important Information Revealed Leave a review and contact me via mql5 message to receive My Top 5 set files for Stratos Pali at no cost! D
Ultimate Gold Advisor für MetaTrader 4 – Ihr hochmodernes Trading-Tool für garantierten Erfolg! Der Ultimate Gold Advisor ist weit mehr als nur ein einfacher Indikator: Er ist das technologische Juwel, das Ihren Ansatz zum Trading auf MetaTrader 4 revolutionieren wird. Entwickelt, um die Bedürfnisse der anspruchsvollsten Trader zu erfüllen, kombiniert dieser hochmoderne Indikator chirurgische Präzision, ausgeklügelte Analysen und leistungsstarke Funktionen, um Ihnen einen unschlagbaren Wettbewer
Zunächst einmal ist es wichtig zu betonen, dass dieses Handelstool ein Nicht-Repaint-, Nicht-Redraw- und Nicht-Verzögerungsindikator ist, was es ideal für professionelles Trading macht. Online-Kurs, Benutzerhandbuch und Demo. Der Smart Price Action Concepts Indikator ist ein sehr leistungsstarkes Werkzeug sowohl für neue als auch erfahrene Händler. Er vereint mehr als 20 nützliche Indikatoren in einem und kombiniert fortgeschrittene Handelsideen wie die Analyse des Inner Circle Traders und Stra
DERZEIT 26% RABATT Die beste Lösung für jeden Newbie oder Expert Trader! Dieser Indikator ist ein einzigartiges, qualitativ hochwertiges und erschwingliches Trading-Tool, da wir eine Reihe von proprietären Funktionen und eine neue Formel integriert haben. Mit nur EINEM Chart können Sie die Währungsstärke für 28 Forex-Paare ablesen! Stellen Sie sich vor, wie sich Ihr Handel verbessern wird, weil Sie in der Lage sind, den genauen Auslösungspunkt eines neuen Trends oder einer Scalping-Gelegenh
FX Volume
Daniel Stein
4.58 (33)
Erhalten Sie Ihr tägliches Marktupdate mit Details und Screenshots über unser Morning Briefing hier auf mql5 und auf Telegram ! FX Volume ist der ERSTE und EINZIGE Volumenindikator, der einen ECHTEN Einblick in die Marktstimmung aus Sicht eines Brokers bietet. Es bietet fantastische Einblicke in die Positionierung von institutionellen Marktteilnehmern, wie z.B. Brokern, auf dem Forex-Markt, viel schneller als COT-Berichte. Diese Informationen direkt auf Ihrem Chart zu sehen, ist der wahre Game
Scalper Vault
Oleg Rodin
5 (27)
Scalper Vault ist ein professionelles Scalping-System, das Ihnen alles bietet, was Sie für erfolgreiches Scalping benötigen. Dieser Indikator ist ein komplettes Handelssystem, das von Forex- und Binäroptionshändlern verwendet werden kann. Der empfohlene Zeitrahmen ist M5. Das System liefert Ihnen genaue Pfeilsignale in Richtung des Trends. Es liefert Ihnen auch Top- und Bottom-Signale und Gann-Marktniveaus. Die Indikatoren bieten alle Arten von Warnungen, einschließlich PUSH-Benachrichtigungen.
Currency Strength Wizard ist ein sehr leistungsstarker Indikator, der Ihnen eine Komplettlösung für erfolgreichen Handel bietet. Der Indikator berechnet die Stärke dieses oder jenes Forex-Paares anhand der Daten aller Währungen in mehreren Zeitrahmen. Diese Daten werden in Form von benutzerfreundlichen Währungsindizes und Währungsstärkelinien dargestellt, anhand derer Sie die Stärke dieser oder jener Währung erkennen können. Sie müssen lediglich den Indikator an das Diagramm anhängen, mit dem Si
Black dragon indicator
Ramil Minniakhmetov
4.85 (110)
Der Trenderkennungsindikator ergänzt jede Strategie und kann auch als unabhängiges Werkzeug verwendet werden. Empfehlungen für die Arbeit mit dem Indikator können Sie in Kommentar #8 herunterladen Vorteile Einfach zu bedienen, überfrachtet das Diagramm nicht mit unnötigen Informationen; Kann als Filter für jede Strategie verwendet werden; Verfügt über eingebaute dynamische Unterstützungs- und Widerstandsebenen, die sowohl zur Gewinnmitnahme als auch zum Setzen von Stop-Loss verwendet werd
Entry Points Pro
Yury Orlov
4.62 (175)
Dies ist ein Indikator für MT4, der genaue Signale für den Einstieg in einen Handel ohne Repainting (Neuzeichnen) liefert. Er kann auf alle Finanzwerte angewendet werden: Forex, Kryptowährungen, Metalle, Aktien, Indizes. Er liefert ziemlich genaue Schätzungen und sagt Ihnen, wann es am besten ist, eine Position zu eröffnen und zu schließen. Sehen Sie sich das Video (6:22) mit einem Beispiel für die Verarbeitung nur eines Signals an, das sich für den Indikator gelohnt hat! Die meisten Händler ver
Quantum Breakout Indicator PRO
Bogdan Ion Puscasu
4.96 (25)
Wir stellen vor       Quantum Breakout PRO   , der bahnbrechende MQL5-Indikator, der die Art und Weise, wie Sie mit Breakout-Zonen handeln, verändert!   Quantum Breakout PRO   wurde von einem Team erfahrener Händler mit über 13 Jahren Handelserfahrung entwickelt und soll Ihre Handelsreise mit seiner innovativen und dynamischen Breakout-Zonen-Strategie auf ein neues Niveau bringen. Der Quantum Breakout Indicator zeigt Ihnen Signalpfeile auf Breakout-Zonen mit 5 Gewinnzielzonen und Stop-Loss
Hinterlassen Sie nach dem Kauf einen Kommentar, um 4 hochwertige Indikatoren als Bonus zu erhalten. Der Chart Patterns All-in-One Indikator hilft Tradern, verschiedene Chartmuster, die häufig in der technischen Analyse verwendet werden, zu visualisieren. Dieser Indikator unterstützt die Identifizierung möglicher Marktbewegungen, garantiert jedoch keine Rentabilität. Es wird empfohlen, den Indikator vor dem Kauf im Demomodus zu testen. Aktuelles Angebot : 50 % Rabatt auf den "Chart Patterns All i
Order Block Hunter
Noha Mohamed Fathy Younes Badr
5 (6)
Order block hunter indicator is the best indicator for  hunt the order blocks that area where there has been a large concentration of limit orders waiting to be executed Order blocks are identified on a chart by observing previous price action and looking for areas where the price experienced significant movement or sudden changes in direction .This indicator does that for you by using very complicated codes and helps you to take the best areas To buy and sell because it make marks at the best a
IX Power MT4
Daniel Stein
5 (5)
IX Power bringt die unschlagbare Präzision von FX Power endlich auch zu Nicht-Forex-Symbolen. Es bestimmt präzise die Intensität von kurz-, mittel- und langfristigen Trends in Ihren Lieblingsindizes, Aktien, Rohstoffen, ETFs und sogar Kryptowährungen. Sie können alles analysieren, was Ihr Terminal zu bieten hat. Probieren Sie es aus und erleben Sie, wie sich Ihr Timing beim Handel deutlich verbessert . IX Power Hauptmerkmale 100% präzise, nicht nachpinselnde Berechnungsergebnisse - für
Weitere Produkte dieses Autors
Netsrac PAAIOS
Carsten Pflug
5 (5)
PAAIOS steht für Price Action All In One Solution. Und genau das ist der Zweck des Indikators. Er soll Ihnen ein Werkzeug an die Hand geben, mit dem Sie Ihr Trading maßgeblich verbessern können, weil Sie die maßgeblichen Informationen auf einen Blick erhalten. Der Indikator vereinfacht die Suche nach starken Signalen. Er zeigt Trendlinien, Nachfrage- und Angebotszonen aus frei wählbaren Zeitrahmen an. Merkmale * erkennt Angebots- und Nachfragezonen für mehrere Zeitrahmen * erkennt und zeigt T
Netsrac Correlation Trader
Carsten Pflug
4.67 (12)
Der Netsrac Correlation Trader (NCT) ist ein sehr leistungsfähiges Tool für den Handel mit positiv und negativ korrelierten Währungspaaren mit abgesicherten Aufträgen.  1) Er sucht nach positiv und negativ korrelierten Paaren 2) Es zeigt Ihnen ein Signal an, wenn die korrelierten Paare nicht im Gleichgewicht sind 3) Es kann einige oder alle korrelierten Paare mit den von Ihnen eingestellten Zeitrahmen und Signalwerten "autotraden" (mit Vorsicht behandeln) 4) Es kann die korrekte Lot-Größe ein
This is the free version of the Supply&Demand + Trendline + Trend tool. This version works only with EURCHF! You find the full version here:  https://www.mql5.com/en/market/product/67274 PAAIOS stands for   Price   Action   All   In   One   Solution. And that is the purpose of the Indicator. It should give you a tool to improve your trading decisively because you get the crucial information at a glance. The indicator simplifies the search for strong signals. It shows trend lines, demand and s
FREE
The intention of the dashboard is to provide a quick overview of the daily, weekly and monthly range of configured assets. In "single asset mode" the dashboard shows you possible reversal points directly in the chart, thus making statistics directly tradable. If a configured threshold is exceeded, the dashboard can send a screen alert, a notification (to the mobile MT5) or an email.  There are various ways of using this information. One approach is that an asset that has completed nearly 100%
The Netsrac Correlation Trade Indicator (NCTI) was created to trade correlations between different assets. NCTI offers five different strategies to do this. Five different correlation trading strategies with two or three assets Fast access your assets with one click via asset buttons Your profit/loss at a glance Configurable alerts via screen or mobile You can use the indicator with every timeframe. Higher timeframes give fewer but better signals. If you have some questions or suggestions - plea
FREE
Netsrac ADR Dashboard
Carsten Pflug
4.91 (11)
Das Ziel des Dashboards ist es, einen schnellen Überblick über die tägliche, wöchentliche und monatliche Bandbreite der konfigurierten Assets zu geben. Im "Single-Asset-Modus" zeigt Ihnen das Dashboard mögliche Umkehrpunkte direkt im Chart an und macht so Statistiken direkt handelbar. Wird ein konfigurierter Schwellenwert überschritten, kann das Dashboard einen Bildschirm-Alarm, eine Benachrichtigung (an den mobilen MT4) oder eine E-Mail versenden.  Es gibt verschiedene Möglichkeiten, diese I
Das Dashboard soll dabei helfen, eine schnelle Übersicht über die Korrelationen verschiedener Underlyings zueinander zu bekommen. Dafür werden die Werte-Reihen nach der Pearson-Methode miteinander verglichen. Das Ergebnis ist der Wert der Korrelation (in Prozent).   Verwendung Für die Korrelation gibt es unterschiedliche Methoden. Beim so genannten Carry-Trade wird ein Underlying gekauft. Ein möglichst hoch negativ korreliertes Paar wird verkauft. Eine wesentliche Rolle spielen bei dieser Meth
FREE
The Netsrac Correlation Trade Indicator (NCTI) was created to trade correlations between different assets. NCTI offers five different strategies to do this. Five different correlation trading strategies with two or three assets Fast access your assets with one click via asset buttons Your profit/loss at a glance Configurable alerts via screen or mobile You can use the indicator with every timeframe. Higher timeframes give fewer but better signals. If you have some questions or suggestions - plea
FREE
The intention of the dashboard is to provide a quick overview of the daily, weekly and monthly range of configured assets. In "single asset mode" the dashboard shows you possible reversal points directly in the chart, thus making statistics directly tradable. If a configured threshold is exceeded, the dashboard can send a screen alert, a notification (to the mobile MT4) or an email.  There are various ways of using this information. One approach is that an asset that has completed nearly 100% o
FREE
Netsrac Correlation Trader (NCT)   is a very powerful tool to trade positive and negative correlated currency pairs with hedged orders.  NCT is doing many things for you: 1) It looks for positive and negative correlated pairs 2) It shows you a signal, if the correlated pairs are not in balance 3) It can "autotrade" some or all correlated pairs with your setting of time frames and signal-values (handle with care) 4) It can set the correct lot size to have pip value and daily range based opti
FREE
Netsrac SuPrEs
Carsten Pflug
5 (1)
Sinn Der SuPrEs-Indikator zeigt den Abstand zur nächsten horizontalen Linie an, deren Namen mit dem konfigurierten Präfix (siehe Optionen) beginnt. Verwendung Zeichne Widerstände und Unterstützungen in den Chart und lasse Dich vom Indikator warnen, sobald ein konfigurierter Abstand unterschritten wird. Nutze den Präfix, um neben Standard-Linien auch Linien anderer Indikatoren mit einer Alarmfunktion zu versehen (siehe Screenshot mit Pivot-Indikator). Anzeige des Indikators Der Indikator z
FREE
Das Dashboard hilft dabei, eine schnelle Übersicht über die Korrelationen verschiedener Underlyings zueinander zu bekommen. Dafür werden die Werte-Reihen nach der Pearson-Methode miteinander verglichen. Das Ergebnis ist der Wert der Korrelation (in Prozent).   Verwendung Für die Korrelation gibt es unterschiedliche Methoden. Beim so genannten Carry-Trade wird ein Underlying gekauft. Ein möglichst hoch negativ korreliertes Paar wird verkauft. Eine wesentliche Rolle spielen bei dieser Methode di
Mit dem SR Dashboard erhalten Sie ein mächtiges Werkzeug zur Kontrolle von einigen der wichtigsten Informationen im Trading. Stellen Sie sich ein Setup ganz nach ihrer Strategie zusammen und lassen sich informieren, sobald dieses Setup gültig ist. Vergeben Sie verschiedene Punkte auf ausgewählte Bedingungen. Wählen Sie aus Trend, Average Daily Range, Moving Averages, Pivot (Daily, Weekly, Monthly), Highs und Lows sowie Candlestick-Pattern. Hinweis: Dieser Indikator kann nicht im Strategietester
The Netsrac Correlation Trade Indicator (NCTI) was created to trade correlations between different assets. NCTI offers five different strategies to do this. Five different correlation trading strategies with two or three assets Fast access your assets with one click via asset buttons Your profit/loss at a glance Configurable alerts via screen or mobile You can use the indicator with every timeframe. Higher timeframes give fewer but better signals. If you have some questions or suggestions - ple
Netsrac "Supply and Demand Easy" is a small but highly specialized tool for quickly finding supply & demand zones without frills. It shows the next supply and demand zone in the current timeframe. Highly efficient and fast. Works perfectly with the Netsrac "Supply and Demand Dashboard" (https://www.mql5.com/en/market/product/96511 ) Controls Variable Description (SD01) Supply color Set your color for supply zones (default is LightCoral) (SD02) Demand color Set your color for demand zones (defa
The Netsrac Supply&Demand Dashboard shows you at a glance where relevant zones are located on your favorite assets. Open your chart directly from the dashboard and trade zones that really matter. Features Finds the next relevant supply and demand zone and displays the distance to this zone (in pips) Finds and displays the zones in three different timeframes Calculates a trend indicator for the current and past candle for each configured time frame Opens a chart with your chart template direct
The Netsrac Correlation Trade Indicator (NCTI) was created to trade correlations between different assets. NCTI offers five different strategies to do this. Five different correlation trading strategies with two or three assets Fast access your assets with one click via asset buttons Your profit/loss at a glance Configurable alerts via screen or mobile You can use the indicator with every timeframe. Higher timeframes give fewer but better signals. If you have some questions or suggestions - pl
With the SR Dashboard, you get a powerful tool to control some of the most important information in trading. Assemble a setup according to your strategy and get informed as soon as this setup is valid. Assign scores to defined conditions and let the Dashboard find them. Choose from Trend, Average Daily Range, RSI, Moving Averages, Pivot (Daily, Weekly, Monthly), Highs and Lows, Candlestick Patterns. What can you do with this tool? Use the dashboard as a powerful tool for your discretionary trad
THE flexible Expert Advisor for Custom Trading Strategies in MetaTrader 5 The Netsrac TradeAid expert is a powerful tool for traders looking to develop their own trading strategies in MetaTrader 5. With this expert advisor, you can combine a variety of technical indicators and trading rules with a simple "If This (AND This...) Then That" logic to create tailored trading strategies that match your individual preferences. You don´t need any knowledge in MQL5 coding language to build your own exper
Auswahl:
Keine Bewertungen
Antwort auf eine Rezension
Version 2.10 2020.10.21
New: UHD mode for high screen resolutions
Version 2.0 2019.05.27
- An error in calculating the score has been fixed
Version 1.90 2019.05.06
- New section: RSI (it is the last feature update for SR-Dashboard to stay consistently for my existing customers)
- Optical and performance enhancements
Version 1.80 2019.05.02
- pivot point calculation method can now be changed between Standard and Fibo
Version 1.70 2019.03.18
- bugfix in score-calculation
- improvements in pattern-scanner
Version 1.50 2019.02.22
- fixed description of variables and added "score multiplier"
Version 1.40 2019.02.21
- bugfix in the calculation of the scores in the pivot section
Version 1.30 2019.02.01
- das Dashboard zeigt den momentanen Gewinn/Verlust pro Symbol an
- fix bei der Funktion zum Anzeigen der Charts
- ein individueller Kommentar kann für die Alarme definiert werden
Version 1.20 2019.01.25
- Fehler bei der Pivot-Berechnung behoben
- Es wird nun angezeigt, für welches Kriterium Scores vergeben sind
- Ein Alarm kann nun auch bei negativen Scores vergeben werden
- der Score für die Daily Range kann nun auch für "gestern" vergeben werden