• Übersicht
  • Bewertungen (5)
  • Diskussion (4)
  • Neue Funktionen

Netsrac SuPrEs

5

Sinn

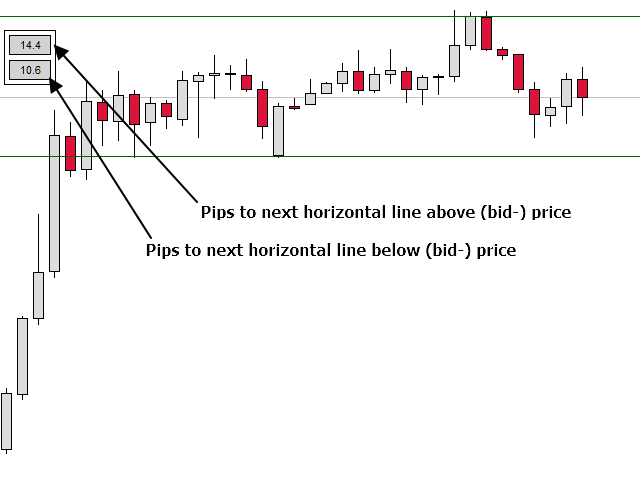
Der SuPrEs-Indikator zeigt den Abstand zur nächsten horizontalen Linie an, deren Namen mit dem konfigurierten Präfix (siehe Optionen) beginnt.

Verwendung

Zeichne Widerstände und Unterstützungen in den Chart und lasse Dich vom Indikator warnen, sobald ein konfigurierter Abstand unterschritten wird. Nutze den Präfix, um neben Standard-Linien auch Linien anderer Indikatoren mit einer Alarmfunktion zu versehen (siehe Screenshot mit Pivot-Indikator).

Anzeige des Indikators

Der Indikator zeigt den Abstand zur nächsten Linie über sowie unter dem aktuellen (Bid-) Preis an. Nicht mehr aber auch nicht weniger.
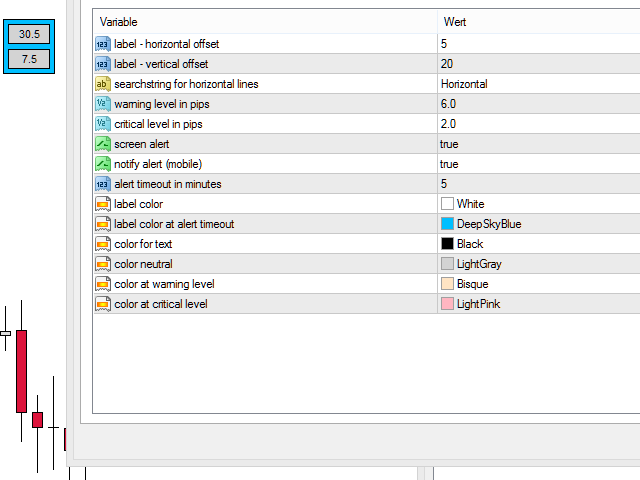
Optionen

label - horizontal offset
Verschiebe den Indikator horizontal, so wie es am besten passt.

label - vertical offset
Verschiebe den Indikator vertikal, so wie es am besten passt.

prefix for horizontal lines
Trage hier die ersten Buchstaben ein, mit denen auch die Namen der Linien beginnen. Wenn Du die Standard-Linien des MT4 suchen möchtest, gib hier zum Beispiel „Horizontal“ ein.

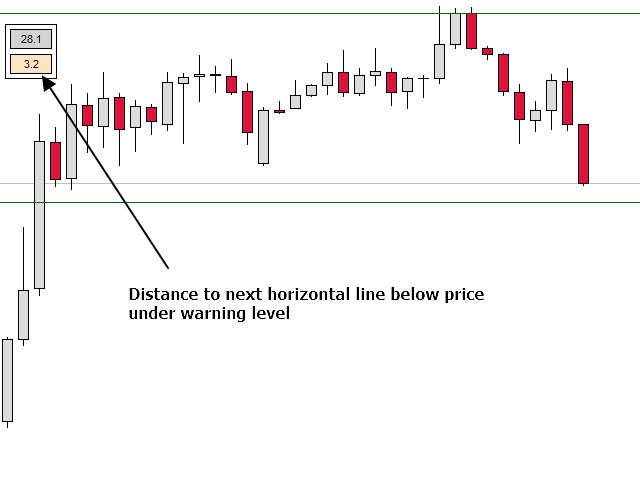
warning level in pips
Wenn dieser Wert unterschritten wird, wird er farblich hervergehoben.

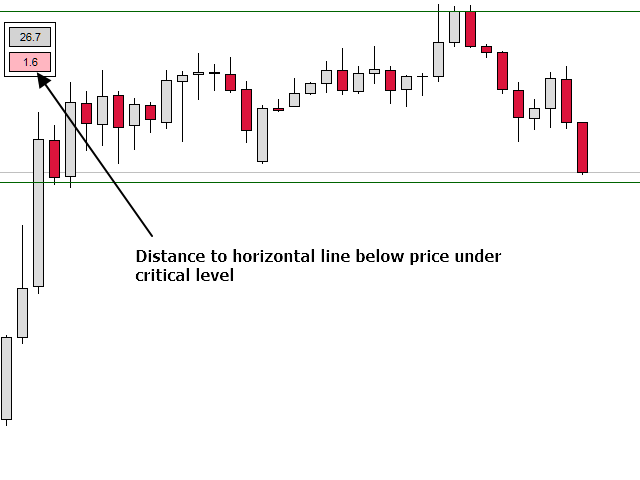
critical level in pips
Wenn dieser Wert unterschritten wird, wird er farblich hervorgehoben.
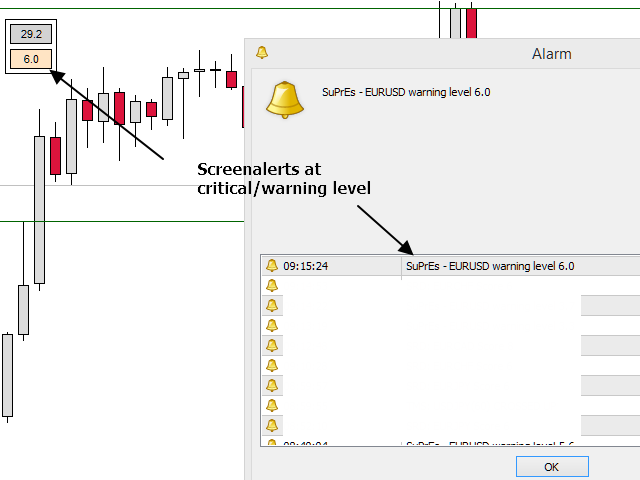
screen alert
Ist hier True eingestellt, wird bei Unterschreiten der kritischen Schwelle zusätzlich ein Bildschirm-Alarm ausgegeben.

notify alert (mobile)
Ist hier True eingestellt, wird bei Unterschreiten der kritischen Schwelle zusätzlich eine Mitteilung an das mobile MT4 gesendet (neu in Version 1.20)
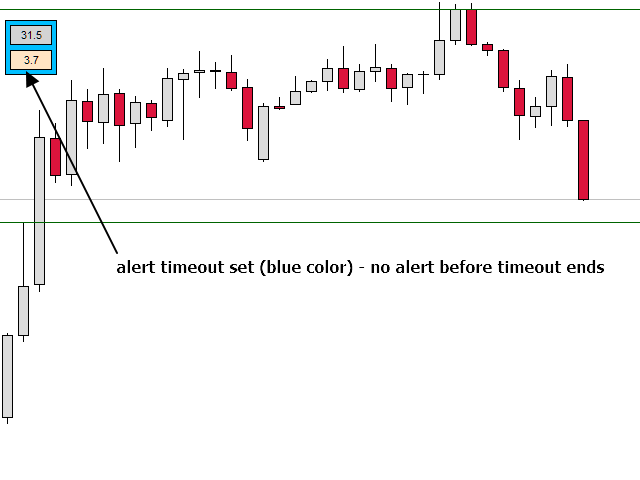
alert timeout
Für diese Zeit in Minuten wird der Alarm ausgesetzt, damit Du nicht ständig von ihm genervt wirst. Wenn der Timeout läuft, verfärbt sich das Label (siehe Farben weiter unten).

Farben
Stelle Dir den Indikator so ein, wie es Dir am besten gefällt.

Hinweis: Es gibt eine wesentlich umfangreichere Version des Indikators hier: https://www.mql5.com/de/market/product/37167


Bewertungen 5
pandiras
149
pandiras 2019.09.22 16:05 
 

very nice tool if you work with horizontal lines like S/R

Empfohlene Produkte
Extremum Reverse Bar
Yurij Izyumov
2.8 (5)
This indicator has been created for finding the probable reversal points of the symbol price. A small candlestick reversal pattern is used it its operation in conjunction with a filter of extremums. The indicator is not redrawn! If the extremum filter is disabled, the indicator shows all points that have a pattern. If the extremum filter is enabled, the condition works – if the history Previous bars 1 candles back contains higher candles and they are farther than the Previous bars 2 candle, such
FREE
The indicator allows you to trade binary options. The recommended time frame is М1 and the expiration time is 1,2,3 minutes. The indicator suitable for auto and manual trading. A possible signal is specified as a arrows above/under a candle. You should wait until the candle closes! Arrows are not re-painted Trade sessions: TOKYO section (Half-end) Currency pairs: USD/JPY Working time frame: M1 Expiration time: 1,2,3 minutes. The indicator also shows good results when using the martingale strateg
FREE
TrendPlus
Sivakumar Subbaiya
4.08 (12)
Trend Plus   Trendplus  Indicator   Time Frame: Suitable for any time frame.  Purpose: Trend Prediction. Blue and red candle indicate the buy and sell call respectively. Buy: When the blue candle is formed buy call is initiated. close the buy trades when the next red candle will formed.   Sell: When the Red candle is formed Sell call is initiated. close the Sell trades when the next blue candle will formed.   Happy trade!!
FREE
StrikePin
Mike Pascal Plavonil
1 (1)
The StrikePin indicator is a technical, analytical tool designed to identify trend reversals and find optimal market entries.  The StrikePin indicator is based on the pin bar pattern, which is the Price Action reversal pattern. An entry signal, in a trending market, can offer a very high-probability entry and a good risk to reward scenario. Be careful: the indicator is repainting since it is looking for highest high and lowest lows.  You should avoid to use it in experts but you can use it
FREE
Reversal Monster Mini
Abdulfattah Yahya Mohammed Alhazmi
The Most advanced and comprehensive EA to trade Trend Reversals/Pullbacks It is a very profitable EA, to trade trends breakout, and manage trades, takeprofit, stoploss, move to breakeven, and trailing stop. The   “Reversal Monster EA”   trades Reversal/Pullbacks when the current price of the pair pullback to a predefined horizontal level or trendline on the currency chart. The opening of the position can be immediate after pullback to the drawn trendline or after closing the candle below/abov
FREE
Free automatic Fibonacci is an indicator that automatically plots a Fibonacci retracement based on the number of bars you select on the BarsToScan setting in the indicator. The Fibonacci is automatically updated in real time as new highest and lowest values appears amongst the selected bars. You can select which level values to be displayed in the indicator settings. You can also select the color of the levels thus enabling the trader to be able to attach the indicator several times with differe
FREE
Triple RSI
Pablo Leonardo Spata
1 (1)
LOOK AT THE FOLLOWING STRATEGY   WITH THIS INDICATOR.   Triple RSI   is a tool that uses the classic Relative Strength Indicator, but in several timeframes to find market reversals.    1.  ️ Idea behind the indicator and its strategy: In Trading, be it Forex or any other asset, the ideal is   to keep it simple, the simpler the better . The   triple RSI   strategy is one of the simple strategies that seek market returns. In our experience, where there is more money to always be won, i
FREE
VR Money Flow Free
Kenneth Parling
4.5 (2)
Introduction Virtual Money Flow free - Lightweight free trading robot based on Money Flow index. Orders set with ISL and take profit is virtual. Equipped with trailing stop and limited money management. How to? Any account type,leverage and time frame Works only on currency pair   EURUSD, optimizations needed in regualar intervals You can start with as low as   $20-50   based on leverage   500 This is  not  a   scalper and trades can therefore be less frequent, be patient! Limited contract size
FREE
Head and Shoulders Pattern Indicator - Your Key to Recognizing Trend Reversals Unlock the power of pattern recognition with the "Head and Shoulders Pattern Indicator." This cutting-edge tool, designed for MetaTrader, is your trusted ally in identifying one of the most powerful chart patterns in technical analysis. Whether you're a novice or an experienced trader, this indicator simplifies the process of spotting the Head and Shoulders pattern, allowing you to make informed trading decisions. Key
FREE
Market Structure Zig Zag
Lesedi Oliver Seilane
4.65 (26)
Free Market structure zig zag to assist in price action trading the screenshots describe how to use and how to spot patterns new version comes with alerts, email alert and  push notification alert can be used on all pairs  can be used on all timeframes  you can add additional confirmation indicators the indicator shows you your higher high and low highs as well as your lower lows and lower highs  the indication makes price action analysis easier to spot.
FREE
Der Trendfänger: Die Strategie des Trendfängers mit Alarmindikator ist ein vielseitiges technisches Analysewerkzeug, das Händlern hilft, Markttrends und potenzielle Ein- und Ausstiegspunkte zu identifizieren. Sie verfügt über eine dynamische Trendfängerstrategie, die sich den Marktbedingungen anpasst, um eine klare visuelle Darstellung der Trendrichtung zu ermöglichen. Händler können die Parameter an ihre Vorlieben und Risikotoleranz anpassen. Der Indikator hilft bei der Trendidentifikation,
FREE
Scalping indicator. It takes into account volatility, price movement in the local interval and the direction of the current trend. Recommended timeframe - M5. Advantages: Low volatility when a signal appears ensures minimal movement against an open position. The indicator does not redraw its signals. There are alert signals. It is a great tool for day trading. Settings: Name Description Period Indicator period Range of each bar in the period (pp.) The maximum size of each candle in the indicat
FREE
Pin Bars
Yury Emeliyanov
5 (3)
Hauptzweck: "Pin Bars" wurde entwickelt, um Pin Bars auf Finanzmarktdiagrammen automatisch zu erkennen. Eine Stiftleiste ist eine Kerze mit einem charakteristischen Körper und einem langen Schwanz, die eine Trendumkehr oder -korrektur signalisieren kann. Funktionsweise: Der Indikator analysiert jede Kerze auf dem Diagramm und bestimmt die Größe von Körper, Schwanz und Nase der Kerze. Wenn eine Stiftleiste erkannt wird, die vordefinierten Parametern entspricht, markiert der Indikator sie auf d
FREE
Cumulative Delta MT4
Evgeny Shevtsov
4.93 (27)
The indicator analyzes the volume scale and splits it into two components - seller volumes and buyer volumes, and also calculates the delta and cumulative delta. The indicator does not flicker or redraw, its calculation and plotting are performed fairly quickly, while using the data from the smaller (relative to the current) periods. The indicator operation modes can be switched using the Mode input variable: Buy - display only the buyer volumes. Sell - display only the seller volumes. BuySell -
FREE
Power Trend Free
Yurij Kozhevnikov
5 (2)
Power Trend Free - the indicator shows the trend strength in the selected period. Input Parameters The indicator has three input parameters: Period - a positive number greater than one, it shows the number of candlesticks used for calculations. If you enter one or zero, there will be no error, but the indicator will not be drawn. Applied Price - the standard "Apply to:" set meaning data used for the indicator calculation: Close - Close prices; Open - Open prices; High - High prices; Low - Low
FREE
Wise Men Indicator demo
Bohdan Kasyanenko
3 (2)
The indicator displays signals according to the strategy of Bill Williams on the chart. Demo version of the indicator has the same features as the paid, except that it can work only on a demo account . Signal "First Wise Man" is formed when there is a divergent bar with angulation.  Bullish divergent bar - with lower minimum and closing price in the upper half. Bearish divergent bar - higher maximum and the closing price at the bottom half. Angulation is formed when all three lines of Alligat
FREE
The indicator displays price distribution on a horizontal histogram. Horizontal histogram help find out key levels of price so that you can make good decision on setting point of take profit, stop loss... You can improve exist trading strategy or get new trading idea with the histogram of price. Outstanding features Support multiple time frame : you can choose to work with history data in any time frame you want. It does not depend on current display time frame. Support weighting by volume a
FREE
Zigzag Extremum points
Oleg Popov
4.81 (32)
New version 8.00 is available. In this version, I tried to take into account the wishes of the user. Each of you can also take part in the improvement of this advisor. In the default settings, the adviser opens trades when the extremum point is broken       standard indicator       Zigzag. When the upper point of the zigzag extremum is broken, it opens a buy deal, and when the lower point of the zigzag extremum is broken, it opens a sell deal. In addition to the standard ZigZag indicator, whi
FREE
PLEASE HELP REVIEW/ SUPPORT/ SHARE THIS OTHER INDICATOR  HERE  https://www.mql5.com/en/market/product/51637  AS YOU DOWNLOAD THIS ONE FOR FREE. THANKS. This Indicator is based on four moving averages and the PIVOT points. The indicator provides clarity to trading, especially in ranging markets when price is very slow and tight. You can trade intensively daily, every day with this indicator. You may decide to trade with this indicator alone and get the maximum out of the market. The indicator w
FREE
BoxInside MT4
Evgeny Shevtsov
4.86 (7)
This indicator calculates the volume profile and places labels that correspond to the VAH, VAL and POC levels, for each candle individually. Indicator operation features The indicator works on the timeframes from M5 to MN, but it uses the history data of smaller periods: M1 - for periods from M5 to H1, M5 - for the H4 period, M30 - for the D1 period, H4 - for the W1 period, D1 - for the MN period. The color and location of the VAL, VAH and POC labels on the current candle are considered to be
FREE
Chandelier Exit
BLAKE STEVEN RODGER
4 (4)
Developed by Chuck LeBeau, the Chandelier Exit indicator uses the highest high / lowest low -/+ a multiple of the ATR value to draw trailing stop lines (orange under buys, magenta over sells) that advance with the trend until the trend changes direction.The value of this trailing stop is that it rapidly moves upward in response to the market action. LeBeau chose the chandelier name because "just as a chandelier hangs down from the ceiling of a room, the chandelier exit hangs down from the high
FREE
MASi Three Screens
Aleksey Terentev
5 (2)
MASi Three Screens is based on the trading strategy by Dr. Alexander Elder. This indicator is a collection of algorithms. Algorithms are based on the analysis of charts of several timeframes. You can apply any of the provided algorithms. List of versions of algorithms:     ThreeScreens v1.0 - A simple implementation, with analysis of the MACD line;     ThreeScreens v1.1 - A simple implementation, with analysis of the MACD histogram;     ThreeScreens v1.2 - Combines the first two algorithms
FREE
MegaTrends
Sivakumar Subbaiya
1 (1)
Megatrends  Indicator   Time Frame: Suitable for any time frame.  Purpose: Trend Prediction. Blue and red color indicate the buy and sell call respectively. Buy: When the blue line is originating it is opened buy call. Sell: When the Red line is origination it is opened sell call Happy trade!! this indicator is suitable for all time frame, but our recommended time frame to use 1hour and 4 hours, suitable for any chart.
FREE
Trend Ray
Andriy Sydoruk
The indicator shows the potential trend direction by cyclical-wave dependence. Thus, all the rays of the intersection will be optimal rays, in the direction of which the price is expected to move, taking into account the indicator period. Rays can be used as a direction for potential market movement. But we must not forget that the approach must be comprehensive, the indicator signals require additional information to enter the market.
Strength
Khurram Mustafa
5 (4)
As per name  Strength,  This Indicator is a  affordable trading tool  because with the help of  Popular Developers & Support of M Q L Platform  I have programmed this strategy. I tried to input different types and different periods of Calculation regarding Support Resistance, Trends, Trend lines, Currency Strength, Oversold and Overbought Indications for good results. Furthermore, I have also care about  Adjustable Settings  So Trader can easily get in touch with market in another way also. What
FREE
This indicator is a perfect tool able to compare which brokers have the lower latency. It shows us immediately which brokers are slower or faster. When you see the dot icon on the line, it means this broker is the faster one and the red line (Broker_A) is the slower one. See the example on the screenshot. How It Works? This indicator shares the prices information to and from the "shared" common data folder. It compares all the prices. The price is based on average by (Ask + Bid) / 2. There are
FREE
The indicator allows you to trade binary options. The recommended time frame is М1 and the expiration time is 1 minutes. The indicator suitable for auto and manual trading. A possible signal is specified as a arrows above/under a candle. You should wait until the candle closes! Arrows are not re-painted Trade sessions: London and New York section Currency pairs: AUD/CAD Working time frame: M1 Expiration time: 1 minute The indicator also shows good results when using the martingale strategy - "Ma
FREE
Show Pips
Roman Podpora
4.3 (54)
Dieser Informationsindikator ist nützlich für diejenigen, die immer über die aktuelle Situation auf dem Konto informiert sein möchten. Der Indikator zeigt Daten wie Gewinn in Punkten, Prozentsatz und Währung sowie den Spread für das aktuelle Paar und die Zeit bis zum Schließen des Balkens im aktuellen Zeitrahmen an. VERSION MT5 -   Weitere nützliche Indikatoren Für die Platzierung der Informationslinie im Diagramm gibt es mehrere Möglichkeiten: Rechts vom Preis (läuft hinter dem Preis); Als Ko
FREE
The Crossing
Anton Iudakov
5 (2)
+ 2 bonus strategies! Alerts! I recommend watching my advisor -   Night Zen EA The indicator combines the most popular moving average strategies: Simple moving average crossover. Moving average crossover relative to the position of the slower moving average. 2 bonus strategies : The crossing of the fast moving average with the calculation of the opening prices of the slow moving average with the calculation of the closing prices taking into account the slower moving average. (The settings for th
FREE
Macd Predictor   Macd's main chart indicator If you like this indicator , Dinapoli Levels Expansion and Retracement Demo is a helpful tool: https://www.mql5.com/en/market/product/35884 1. You can determine the price at which the MACD will change from buy to sell, and vice versa. It is the cousin of the oscillator predictor. If you know a position at the time, then the exact price, current and next (future) columns will need to reach the MACD crossover. You can also see how far the market has t
FREE
Käufer dieses Produkts erwarben auch
Gann Made Easy
Oleg Rodin
4.85 (82)
Gann Made Easy ist ein professionelles und einfach zu bedienendes Forex-Handelssystem, das auf den besten Handelsprinzipien unter Verwendung der Theorie von Mr. basiert. W.D. Gann. Der Indikator liefert genaue KAUF- und VERKAUFSsignale, einschließlich Stop-Loss- und Take-Profit-Levels. Mit PUSH-Benachrichtigungen können Sie auch unterwegs handeln. Bitte kontaktieren Sie mich nach dem Kauf! Ich werde meine Handelstipps und tolle Bonusindikatoren kostenlos mit Ihnen teilen! Wahrscheinlich haben Si
- Real price is 80$ - 40% Discount ( It is 49$ now ) Contact me for instruction, add group and any questions! Related Product:  Bitcoin Expert , Gold Expert Introduction The breakout and retest strategy is traded support and resistance levels. it involves price breaking through a previous level.  The break and retest strategy is designed to help traders do two main things, the first is to avoid false breakouts. Many false breakouts start with a candlestick that breaks out of a level but ends wi
Atomic Analyst
Issam Kassas
5 (2)
Zunächst einmal ist es erwähnenswert, dass dieser Handelsindikator nicht neu malt, nicht neu zeichnet und keine Verzögerung aufweist, was ihn sowohl für manuellen als auch für Roboterhandel ideal macht. Benutzerhandbuch: Einstellungen, Eingaben und Strategie. Der Atom-Analyst ist ein PA-Preisaktionsindikator, der die Stärke und das Momentum des Preises nutzt, um einen besseren Vorteil auf dem Markt zu finden. Ausgestattet mit fortschrittlichen Filtern, die helfen, Rauschen und falsche Signale z
Scalper Inside PRO
Alexey Minkov
4.73 (56)
An exclusive indicator that utilizes an innovative algorithm to swiftly and accurately determine the market trend. The indicator automatically calculates opening, closing, and profit levels, providing detailed trading statistics. With these features, you can choose the most appropriate trading instrument for the current market conditions. Additionally, you can easily integrate your own arrow indicators into Scalper Inside Pro to quickly evaluate their statistics and profitability. Scalper Inside
TPSproTREND PrO
Roman Podpora
4.79 (19)
TPSpro TREND PRO   ist ein Trendindikator, der den Markt automatisch analysiert und Informationen über den Trend und jede seiner Änderungen liefert sowie Signale für den Einstieg in Geschäfte ohne Neuzeichnung gibt! Der Indikator verwendet jede Kerze und analysiert sie separat. bezieht sich auf verschiedene Impulse – Aufwärts- oder Abwärtsimpuls. Exakte Einstiegspunkte in Transaktionen für Währungen, Krypto, Metalle, Aktien, Indizes! Version MT5                   VOLLSTÄNDIGE BESCHREIBUNG DES
Gold Stuff
Vasiliy Strukov
4.89 (239)
Gold Stuff-Ein Trendindikator, der speziell für Gold entwickelt wurde, kann auch auf allen Finanzinstrumenten verwendet werden. Der Indikator wird nicht neu gezeichnet und verzögert sich nicht. Empfohlener Zeitrahmen H1. Nach diesem Indikator geschrieben EA Gold Stuff Berater, können Sie es in meinem Profil finden. WICHTIG! Kontaktieren Sie mich sofort nach dem Kauf, um Anweisungen und Bonus zu erhalten!   Sie können eine kostenlose Kopie unseres Strong Support- und Trendscanner-Indikators
FX Volume
Daniel Stein
4.58 (33)
Erhalten Sie Ihr tägliches Marktupdate mit Details und Screenshots über unser Morning Briefing hier auf mql5 und auf Telegram ! FX Volume ist der ERSTE und EINZIGE Volumenindikator, der einen ECHTEN Einblick in die Marktstimmung aus Sicht eines Brokers bietet. Es bietet fantastische Einblicke in die Positionierung von institutionellen Marktteilnehmern, wie z.B. Brokern, auf dem Forex-Markt, viel schneller als COT-Berichte. Diese Informationen direkt auf Ihrem Chart zu sehen, ist der wahre Game
Derzeit 20% Rabatt! Die beste Lösung für jeden Neueinsteiger oder Expert Händler! Dieses Dashboard arbeitet mit 28 Währungspaaren. Es basiert auf 2 unserer Hauptindikatoren (Advanced Currency Strength 28 und Advanced Currency Impulse). Es bietet einen hervorragenden Überblick über den gesamten Forex-Markt. Es zeigt die Werte der Advanced Currency Strength, die Veränderungsrate der Währungen und die Signale für 28 Devisenpaare in allen (9) Zeitrahmen. Stellen Sie sich vor, wie sich Ihr Hande
Trend Punch
Mohamed Hassan
4.95 (19)
This indicator is unstoppable when combined with our other indicator called  Support & Resistance . After purchase, send us a message and you will get it   for  FREE as a BONUS! Introducing Trend Punch , the revolutionary forex trend indicator that will transform the way you trade! Trend Punch is uniquely designed to provide precise buy and sell arrows during strong market trends, making your trading decisions clearer and more confident. Whether you're trading major currency pairs or exotic sym
Trend Screener
STE S.S.COMPANY
4.8 (87)
Trendindikator, bahnbrechende, einzigartige Lösung für Trendhandel und -filterung mit allen wichtigen Trendfunktionen in einem Tool! Es handelt sich um einen 100 % nicht neu zu malenden Multi-Timeframe- und Multi-Währungs-Indikator, der für alle Symbole/Instrumente verwendet werden kann: Forex, Rohstoffe, Kryptowährungen, Indizes und Aktien. ZEITLICH BEGRENZTES ANGEBOT: Der Support- und Resistance-Screener-Indikator ist für nur 50 $ und lebenslang verfügbar. (Ursprünglicher Preis 250 $) (Angebot
FX Power MT4 NG
Daniel Stein
5 (13)
Erhalten Sie Ihr tägliches Marktupdate mit Details und Screenshots über unser Morning Briefing hier auf mql5 und auf Telegram ! FX Power MT4 NG ist die nächste Generation unseres langjährig sehr beliebten Währungsstärkemessers FX Power. Und was bietet dieser Stärkezähler der nächsten Generation? Alles, was Sie am ursprünglichen FX Power geliebt haben PLUS GOLD/XAU-Stärkeanalyse Noch präzisere Berechnungsergebnisse Individuell konfigurierbare Analysezeiträume Anpassbares Berechnungslimit für noc
Dynamic Forex28 Navigator – Das Forex-Handelstool der nächsten Generation AKTUELL 49 % RABATT. Dynamic Forex28 Navigator ist die Weiterentwicklung unserer seit langem beliebten Indikatoren und vereint die Leistung von drei in einem: Advanced Currency Strength28 Indicator (695 Bewertungen) + Advanced Currency IMPULSE mit ALERT (520 Bewertungen) + CS28 Combo Signals (Bonus) Details zum Indikator https://www.mql5.com/en/blogs/post/758844 Was bietet der Strength Indicator der nächsten Generation?
TPSpro RFI Levels
Roman Podpora
4.82 (22)
ANWEISUNGEN    Russland -    ENG    Die Empfehlung basiert auf dem Indikator -   TPSpro   TREND PRO -   Version MT5 Die wichtigsten Elemente in der Branche sind entweder in Zonen oder in der Fabrik enthalten, oder sie führen zu einer Lösung bei einem Kauf oder dem Verkauf eines anderen Instruments. Wenn viele Menschen ihre Rechte nicht auf dem Händlerkonto verschlüsseln, werden die Folgen nicht schnell genug sein. Ich habe es damit abgeschlossen, dass ich diese Folgen nun noch interpretieren un
Zunächst einmal ist es wichtig zu betonen, dass dieses Handelstool ein Nicht-Repaint-, Nicht-Redraw- und Nicht-Verzögerungsindikator ist, was es ideal für professionelles Trading macht. Online-Kurs, Benutzerhandbuch und Demo. Der Smart Price Action Concepts Indikator ist ein sehr leistungsstarkes Werkzeug sowohl für neue als auch erfahrene Händler. Er vereint mehr als 20 nützliche Indikatoren in einem und kombiniert fortgeschrittene Handelsideen wie die Analyse des Inner Circle Traders und Stra
Enigmera
Ivan Stefanov
5 (3)
ENIGMERA: Der Kern des Marktes https://www.enigmera.com Einführung Dieser Indikator und dieses Handelssystem sind ein bemerkenswerter Ansatz für die Finanzmärkte. ENIGMERA nutzt die fraktalen Zyklen zur genauen Berechnung von Unterstützungs- und Widerstandsniveaus. Er zeigt die echte Akkumulationsphase an und gibt Richtung und Ziele vor.  Ein System, das funktioniert, egal ob wir uns in einem Trend oder in einer Korrektur befinden.  Wie funktioniert es? ENIGMERA besteht aus drei Linien: der
Stratos Pali
Michela Russo
5 (1)
Stratos Pali Indicator   is a revolutionary tool designed to enhance your trading strategy by accurately identifying market trends. This sophisticated indicator uses a unique algorithm to generate a complete histogram, which records when the trend is Long or Short. When a trend reversal occurs, an arrow appears, indicating the new direction of the trend. Important Information Revealed Leave a review and contact me via mql5 message to receive My Top 5 set files for Stratos Pali at no cost! D
Black dragon indicator
Ramil Minniakhmetov
4.85 (110)
Der Trenderkennungsindikator ergänzt jede Strategie und kann auch als unabhängiges Werkzeug verwendet werden. Empfehlungen für die Arbeit mit dem Indikator können Sie in Kommentar #8 herunterladen Vorteile Einfach zu bedienen, überfrachtet das Diagramm nicht mit unnötigen Informationen; Kann als Filter für jede Strategie verwendet werden; Verfügt über eingebaute dynamische Unterstützungs- und Widerstandsebenen, die sowohl zur Gewinnmitnahme als auch zum Setzen von Stop-Loss verwendet werd
Werden Sie Breaker Trader und profitieren Sie von Änderungen der Marktstruktur, wenn sich der Preis umkehrt. Der Order Block Breaker Indikator zeigt an, wann sich eine Trend- oder Preisbewegung der Erschöpfung nähert und bereit ist, sich umzukehren. Es weist Sie auf Änderungen in der Marktstruktur hin, die normalerweise auftreten, wenn eine Umkehrung oder ein größerer Rückzug bevorsteht. Der Indikator verwendet eine proprietäre Berechnung, die Ausbrüche und Preisdynamik identifiziert. Jedes
MetaBands M4
Vahidreza Heidar Gholami
5 (2)
MetaBands verwendet leistungsstarke und einzigartige Algorithmen, um Kanäle zu zeichnen und Trends zu erkennen, sodass es Tradern potenzielle Punkte für den Einstieg und Ausstieg aus Trades bieten kann. Es ist ein Kanalindikator sowie ein leistungsstarker Trendindikator. Es umfasst verschiedene Arten von Kanälen, die einfach durch Verwendung der Eingabeparameter zusammengeführt werden können. MetaBands verwendet alle Arten von Warnmeldungen, um Benutzer über Marktereignisse zu informieren. Funkt
PRO Renko System ist ein hochpräzises Handelssystem, das speziell für den Handel mit RENKO-Charts entwickelt wurde. Dies ist ein universelles System, das auf verschiedene Handelsinstrumente angewendet werden kann. Das System neutralisiert effektiv so genannte Marktgeräusche, die Ihnen Zugang zu genauen Umkehrsignalen geben. Der Indikator ist sehr einfach zu bedienen und hat nur einen Parameter, der für die Signalerzeugung verantwortlich ist. Sie können das Tool einfach an jedes Handelsinstr
Legacy of Gann
Pavel Zamoshnikov
4.83 (12)
The indicator very accurately determines the levels of the possible end of the trend and profit fixing. The method of determining levels is based on the ideas of W.D.Gann, using an algorithm developed by his follower Kirill Borovsky. Extremely high reliability of reaching levels (according to K. Borovsky  - 80-90%) Indispensable for any trading strategy – every trader needs to determine the exit point from the market! Precisely determines targets on any timeframes and any instruments (forex, met
Currency Strength Exotics
Bernhard Schweigert
4.87 (30)
Stärke von 8 Währungen plus EIN EXOTISCHES Paar oder Rohstoffe oder Indexe! Jedes Produkt kann als 9. Linie hinzugefügt werden. Fügen Sie Rohstoffe, Indexes oder exotische Währungen hinzu (Gold, Silber, Öl, DAX, US30, MXN, TRY, CNH ...). Eine neue noch nie dagewesene TRADING STRATEGIE  !!! Dieser Indikator ist einzigartig, weil wir eine Reihe von proprietäre Funktionen und neue Formeln eingebaut haben. Es funktioniert für alle Zeitrahmen. Basierend auf neuen zugrunde liegenden Algorithmen ist
Shepherd Harmonic Pattern
Abdullah Alrai
4.65 (49)
Dieser Indikator erkennt harmonische Muster, die manuell oder automatisch auf dem Chart gezeichnet wurden. Sie können das Benutzerhandbuch unter diesem Link einsehen: Fügen Sie Ihre Bewertung hinzu und kontaktieren Sie uns, um es zu erhalten. Es gibt eine kostenlose Version, um dieses Produkt auf MT4 auszuprobieren. Sie können es verwenden, um Gartley- und Nenstar-Muster zu erkennen: https://www.mql5.com/en/market/product/30181 Sie können die vollständige MT4-Version von kaufen: https://www.mql5
Entdecken Sie das Geheimnis des erfolgreichen Forex -Handels mit unserem benutzerdefinierten MT4 -Indikator! Haben Sie sich jemals gefragt, wie Sie Erfolg auf dem Forex -Markt erzielen können und gleichzeitig Gewinne erzielen und gleichzeitig das Risiko minimieren können? Hier ist die Antwort, nach der Sie gesucht haben! Erlauben Sie uns, unseren proprietären MT4 -Indikator vorzustellen, der Ihren Handelsansatz revolutionieren wird. Einzigartige Vielseitigkeit Unser Indikator ist speziell
Gold Channel is a volatility-based indicator, developed with a specific timing algorithm for the XAUUSD pair, which consists of finding possible corrections in the market. This indicator shows two outer lines, an inner line (retracement line) and an arrow sign, where the theory of the channel is to help identify overbought and oversold conditions in the market. The market price will generally fall between the boundaries of the channel. If prices touch or move outside the channel it is a tra
Apollo BuySell Predictor ist ein professionelles Handelssystem, das mehrere Handelsmodule umfasst. Es bietet einem Trader einzigartige Breakout-Zonen, Fibonacci-basierte Unterstützungs- und Widerstandsniveaus, Pivot-Trendlinie, Pullback-Volumensignale und andere hilfreiche Funktionen, die jeder Trader täglich benötigt. Das System funktioniert mit jedem Paar. Empfohlene Zeitrahmen sind M30, H1, H4. Der Indikator kann jedoch auch mit anderen Zeitrahmen arbeiten, mit Ausnahme der Zeitrahmen höher a
Dieses Dashboard ist ein Warntool zur Verwendung mit dem Indikator für die Umkehrung der Marktstruktur. Sein Hauptzweck besteht darin, Sie auf Umkehrmöglichkeiten in bestimmten Zeitrahmen und auch auf die erneuten Tests der Warnungen (Bestätigung) aufmerksam zu machen, wie es der Indikator tut. Das Dashboard ist so konzipiert, dass es auf einem eigenen Chart sitzt und im Hintergrund arbeitet, um Ihnen Benachrichtigungen zu Ihren ausgewählten Paaren und Zeitrahmen zu senden. Es wurde entwickelt,
Currency Strength Wizard ist ein sehr leistungsstarker Indikator, der Ihnen eine Komplettlösung für erfolgreichen Handel bietet. Der Indikator berechnet die Stärke dieses oder jenes Forex-Paares anhand der Daten aller Währungen in mehreren Zeitrahmen. Diese Daten werden in Form von benutzerfreundlichen Währungsindizes und Währungsstärkelinien dargestellt, anhand derer Sie die Stärke dieser oder jener Währung erkennen können. Sie müssen lediglich den Indikator an das Diagramm anhängen, mit dem Si
GOLD Impulse with Alert
Bernhard Schweigert
4.56 (9)
Dieser Indikator ist eine hervorragende Kombination aus unseren 2 Produkten Advanced Currency IMPULSE with ALERT  +   Currency Strength Exotics . Es funktioniert für alle Zeitrahmen und zeigt grafisch Impulse der Stärke oder Schwäche für die 8 wichtigsten Währungen plus ein Symbol! Dieser Indikator ist darauf spezialisiert, die Beschleunigung der Währungsstärke für beliebige Symbole wie Gold, Exotische Paare, Rohstoffe, Indizes oder Futures anzuzeigen. Als erster seiner Art kann jedes Sym
Weitere Produkte dieses Autors
Netsrac ADR Dashboard
Carsten Pflug
4.91 (11)
Das Ziel des Dashboards ist es, einen schnellen Überblick über die tägliche, wöchentliche und monatliche Bandbreite der konfigurierten Assets zu geben. Im "Single-Asset-Modus" zeigt Ihnen das Dashboard mögliche Umkehrpunkte direkt im Chart an und macht so Statistiken direkt handelbar. Wird ein konfigurierter Schwellenwert überschritten, kann das Dashboard einen Bildschirm-Alarm, eine Benachrichtigung (an den mobilen MT4) oder eine E-Mail versenden.  Es gibt verschiedene Möglichkeiten, diese I
Netsrac PAAIOS
Carsten Pflug
5 (5)
PAAIOS steht für Price Action All In One Solution. Und genau das ist der Zweck des Indikators. Er soll Ihnen ein Werkzeug an die Hand geben, mit dem Sie Ihr Trading maßgeblich verbessern können, weil Sie die maßgeblichen Informationen auf einen Blick erhalten. Der Indikator vereinfacht die Suche nach starken Signalen. Er zeigt Trendlinien, Nachfrage- und Angebotszonen aus frei wählbaren Zeitrahmen an. Merkmale * erkennt Angebots- und Nachfragezonen für mehrere Zeitrahmen * erkennt und zeigt T
Netsrac Correlation Trader
Carsten Pflug
4.67 (12)
Der Netsrac Correlation Trader (NCT) ist ein sehr leistungsfähiges Tool für den Handel mit positiv und negativ korrelierten Währungspaaren mit abgesicherten Aufträgen.  1) Er sucht nach positiv und negativ korrelierten Paaren 2) Es zeigt Ihnen ein Signal an, wenn die korrelierten Paare nicht im Gleichgewicht sind 3) Es kann einige oder alle korrelierten Paare mit den von Ihnen eingestellten Zeitrahmen und Signalwerten "autotraden" (mit Vorsicht behandeln) 4) Es kann die korrekte Lot-Größe ein
This is the free version of the Supply&Demand + Trendline + Trend tool. This version works only with EURCHF! You find the full version here:  https://www.mql5.com/en/market/product/67274 PAAIOS stands for   Price   Action   All   In   One   Solution. And that is the purpose of the Indicator. It should give you a tool to improve your trading decisively because you get the crucial information at a glance. The indicator simplifies the search for strong signals. It shows trend lines, demand and s
FREE
The intention of the dashboard is to provide a quick overview of the daily, weekly and monthly range of configured assets. In "single asset mode" the dashboard shows you possible reversal points directly in the chart, thus making statistics directly tradable. If a configured threshold is exceeded, the dashboard can send a screen alert, a notification (to the mobile MT5) or an email.  There are various ways of using this information. One approach is that an asset that has completed nearly 100%
The Netsrac Correlation Trade Indicator (NCTI) was created to trade correlations between different assets. NCTI offers five different strategies to do this. Five different correlation trading strategies with two or three assets Fast access your assets with one click via asset buttons Your profit/loss at a glance Configurable alerts via screen or mobile You can use the indicator with every timeframe. Higher timeframes give fewer but better signals. If you have some questions or suggestions - plea
FREE
Das Dashboard soll dabei helfen, eine schnelle Übersicht über die Korrelationen verschiedener Underlyings zueinander zu bekommen. Dafür werden die Werte-Reihen nach der Pearson-Methode miteinander verglichen. Das Ergebnis ist der Wert der Korrelation (in Prozent).   Verwendung Für die Korrelation gibt es unterschiedliche Methoden. Beim so genannten Carry-Trade wird ein Underlying gekauft. Ein möglichst hoch negativ korreliertes Paar wird verkauft. Eine wesentliche Rolle spielen bei dieser Meth
FREE
Netsrac Correlation Trader (NCT)   is a very powerful tool to trade positive and negative correlated currency pairs with hedged orders.  NCT is doing many things for you: 1) It looks for positive and negative correlated pairs 2) It shows you a signal, if the correlated pairs are not in balance 3) It can "autotrade" some or all correlated pairs with your setting of time frames and signal-values (handle with care) 4) It can set the correct lot size to have pip value and daily range based opti
FREE
The intention of the dashboard is to provide a quick overview of the daily, weekly and monthly range of configured assets. In "single asset mode" the dashboard shows you possible reversal points directly in the chart, thus making statistics directly tradable. If a configured threshold is exceeded, the dashboard can send a screen alert, a notification (to the mobile MT4) or an email.  There are various ways of using this information. One approach is that an asset that has completed nearly 100% o
FREE
The Netsrac Correlation Trade Indicator (NCTI) was created to trade correlations between different assets. NCTI offers five different strategies to do this. Five different correlation trading strategies with two or three assets Fast access your assets with one click via asset buttons Your profit/loss at a glance Configurable alerts via screen or mobile You can use the indicator with every timeframe. Higher timeframes give fewer but better signals. If you have some questions or suggestions - plea
FREE
Mit dem SR Dashboard erhalten Sie ein mächtiges Werkzeug zur Kontrolle von einigen der wichtigsten Informationen im Trading. Stellen Sie sich ein Setup ganz nach ihrer Strategie zusammen und lassen sich informieren, sobald dieses Setup gültig ist. Vergeben Sie verschiedene Punkte auf ausgewählte Bedingungen. Wählen Sie aus Trend, Average Daily Range, Moving Averages, Pivot (Daily, Weekly, Monthly), Highs und Lows sowie Candlestick-Pattern. Hinweis: Dieser Indikator ist die freie Version des Ne
FREE
Das Dashboard hilft dabei, eine schnelle Übersicht über die Korrelationen verschiedener Underlyings zueinander zu bekommen. Dafür werden die Werte-Reihen nach der Pearson-Methode miteinander verglichen. Das Ergebnis ist der Wert der Korrelation (in Prozent).   Verwendung Für die Korrelation gibt es unterschiedliche Methoden. Beim so genannten Carry-Trade wird ein Underlying gekauft. Ein möglichst hoch negativ korreliertes Paar wird verkauft. Eine wesentliche Rolle spielen bei dieser Methode di
Mit dem SR Dashboard erhalten Sie ein mächtiges Werkzeug zur Kontrolle von einigen der wichtigsten Informationen im Trading. Stellen Sie sich ein Setup ganz nach ihrer Strategie zusammen und lassen sich informieren, sobald dieses Setup gültig ist. Vergeben Sie verschiedene Punkte auf ausgewählte Bedingungen. Wählen Sie aus Trend, Average Daily Range, Moving Averages, Pivot (Daily, Weekly, Monthly), Highs und Lows sowie Candlestick-Pattern. Hinweis: Dieser Indikator kann nicht im Strategietester
The Netsrac Correlation Trade Indicator (NCTI) was created to trade correlations between different assets. NCTI offers five different strategies to do this. Five different correlation trading strategies with two or three assets Fast access your assets with one click via asset buttons Your profit/loss at a glance Configurable alerts via screen or mobile You can use the indicator with every timeframe. Higher timeframes give fewer but better signals. If you have some questions or suggestions - ple
Netsrac "Supply and Demand Easy" is a small but highly specialized tool for quickly finding supply & demand zones without frills. It shows the next supply and demand zone in the current timeframe. Highly efficient and fast. Works perfectly with the Netsrac "Supply and Demand Dashboard" (https://www.mql5.com/en/market/product/96511 ) Controls Variable Description (SD01) Supply color Set your color for supply zones (default is LightCoral) (SD02) Demand color Set your color for demand zones (defa
The Netsrac Supply&Demand Dashboard shows you at a glance where relevant zones are located on your favorite assets. Open your chart directly from the dashboard and trade zones that really matter. Features Finds the next relevant supply and demand zone and displays the distance to this zone (in pips) Finds and displays the zones in three different timeframes Calculates a trend indicator for the current and past candle for each configured time frame Opens a chart with your chart template direct
The Netsrac Correlation Trade Indicator (NCTI) was created to trade correlations between different assets. NCTI offers five different strategies to do this. Five different correlation trading strategies with two or three assets Fast access your assets with one click via asset buttons Your profit/loss at a glance Configurable alerts via screen or mobile You can use the indicator with every timeframe. Higher timeframes give fewer but better signals. If you have some questions or suggestions - pl
With the SR Dashboard, you get a powerful tool to control some of the most important information in trading. Assemble a setup according to your strategy and get informed as soon as this setup is valid. Assign scores to defined conditions and let the Dashboard find them. Choose from Trend, Average Daily Range, RSI, Moving Averages, Pivot (Daily, Weekly, Monthly), Highs and Lows, Candlestick Patterns. What can you do with this tool? Use the dashboard as a powerful tool for your discretionary trad
THE flexible Expert Advisor for Custom Trading Strategies in MetaTrader 5 The Netsrac TradeAid expert is a powerful tool for traders looking to develop their own trading strategies in MetaTrader 5. With this expert advisor, you can combine a variety of technical indicators and trading rules with a simple "If This (AND This...) Then That" logic to create tailored trading strategies that match your individual preferences. You don´t need any knowledge in MQL5 coding language to build your own exper
Auswahl:
Brett001
39
Brett001 2020.10.09 20:39 
 

Der Benutzer hat keinen Kommentar hinterlassen

Sevgi Simsek
589
Sevgi Simsek 2019.10.14 09:29 
 

Der Benutzer hat keinen Kommentar hinterlassen

pandiras
149
pandiras 2019.09.22 16:05 
 

very nice tool if you work with horizontal lines like S/R

sunnychow
8902
sunnychow 2018.12.15 17:24 
 

Der Benutzer hat keinen Kommentar hinterlassen

Yufeng Zheng
32
Yufeng Zheng 2018.12.14 07:40 
 

Der Benutzer hat keinen Kommentar hinterlassen

Antwort auf eine Rezension
Version 1.40 2021.02.13
- recompiled for newer MT4-Builds
Version 1.30 2019.10.22
- Fix: distances are not displayed for some assets if they are further away
Version 1.20 2019.01.28
- Alarme können nun auch an das Handy gesendet werden
Version 1.1 2018.12.11
Alarme sind nun in Englisch.