Elliots Triangle
- Indikatoren
- Stephen Reynolds
- Version: 1.0
- Aktivierungen: 20
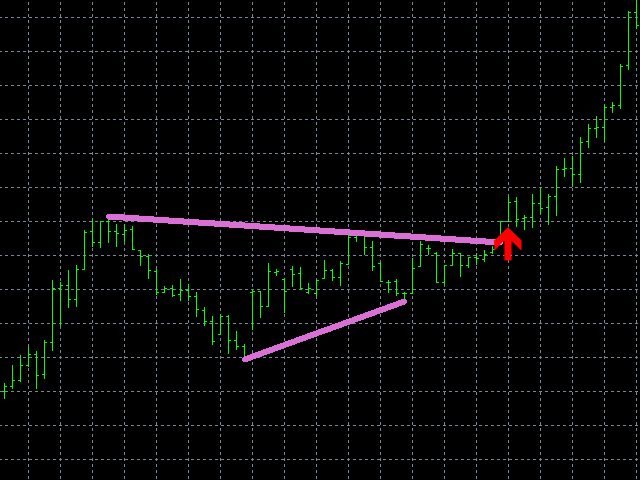
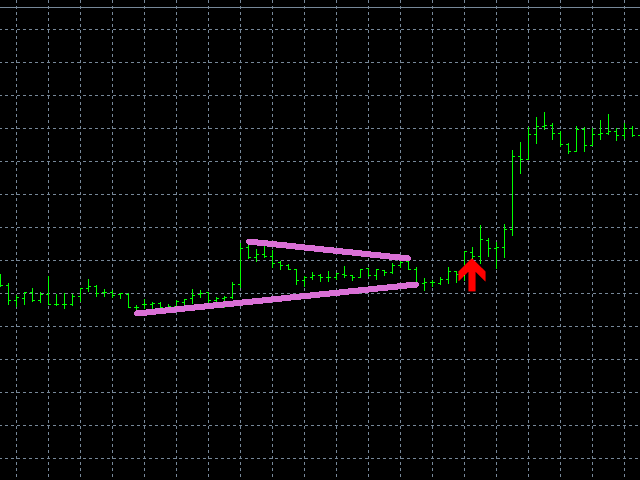
Elliot's Triangle is taken from 1 of the 13 patterns within the Elliot Wave Theory that says social or crowd behaviour tends to reverse in recognisable patterns and of which they reveal a structural pattern that appears in nature, as well as the mass psychology of trading participants. From this, he has devised various identifiable patterns that appear in market prices. One of these is what I have named Elliot's Triangle.
This triangular pattern appears to reflect a balance of forces, causing a sideways movement that is usually associated with decreasing volume and volatility. These patterns interestingly enough are also reflected in DOW theory and are called moments of equilibrium.
This pattern is identified by using the zigzag indicator. When the zigzag forms a 5 pointed pattern of converging fractals an Elliot Triangle is realised and a signal is made.
I have made an optional extra alert whereby if price breaks out of previous highs or lows that make up the triangle then a buy or sell signal occur's.
Features :
- A way of recognising when there is high probability of a good move about to happen
- Send alerts to either your PC, eMail or mobile device
- Works on any timeframe
Settings :
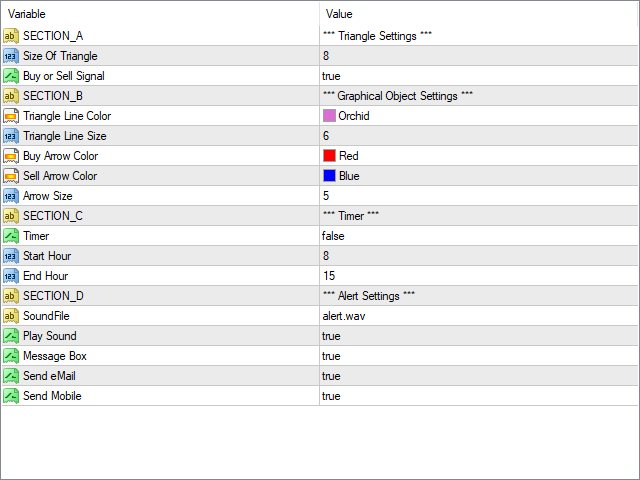
Triangle Settings
- Size Of Triangle - Sets how large we want our triangle to be using depth of from zigzag indicator.
- Buy or Sell Signal - If true we draw an arrow and send an alert when price breaks from previous high or low fractal.
Graphical Object Settings
- 3 Bar Break Color - Line color of the 3 bar break pattern
- Triangle Line Color - Line color of the triangle pattern
- Triangle Line Size - Line size of the triangle pattern
- Buy Arrow Color - Buy arrow color
- Sell Arrow Color - Sell arrow color
- Arrow Size - Size of arrow
Timer
- Timer - If true it only looks for pattern between the start and end hours, if false it looks for pattern 24 hours of day.
- Start Hour - We allow signal after this start hour
- End Hour - We allow signal before this ending hour