Visual correlation
- Indikatoren
- Andrey Tatarinov
- Version: 1.3
- Aktualisiert: 29 Juni 2021
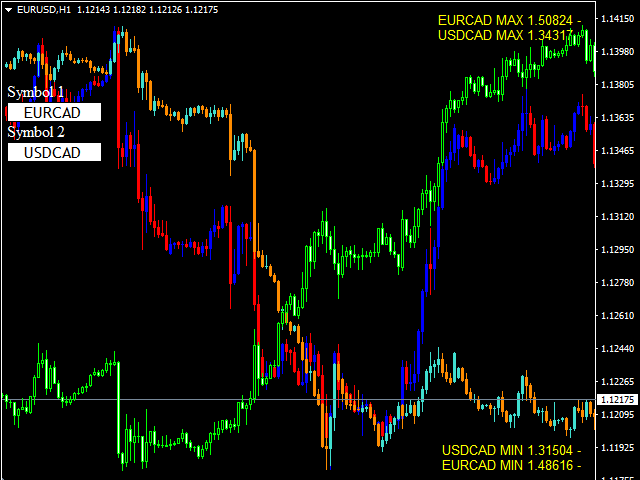
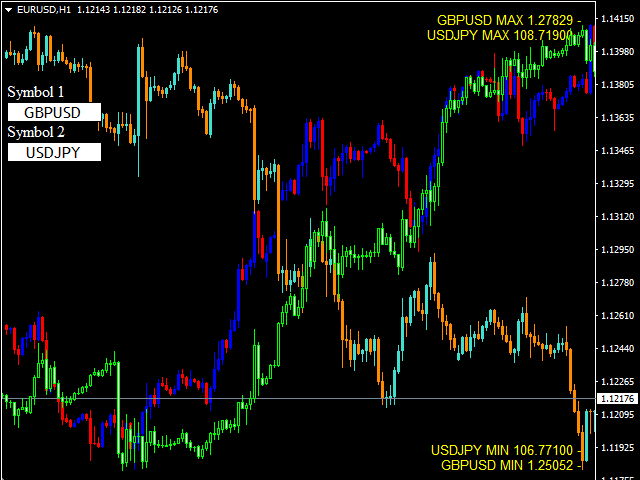
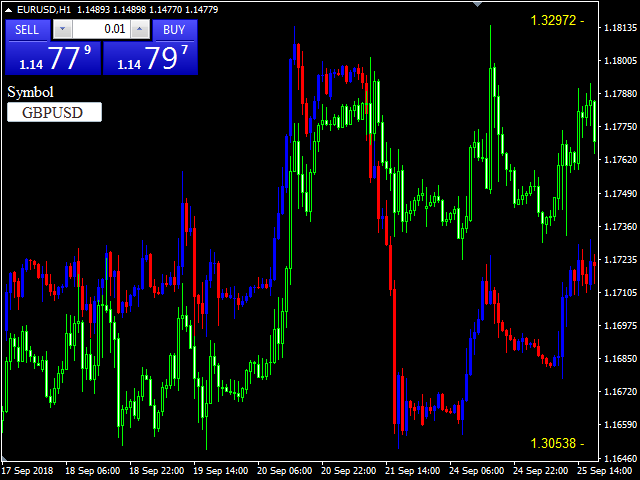
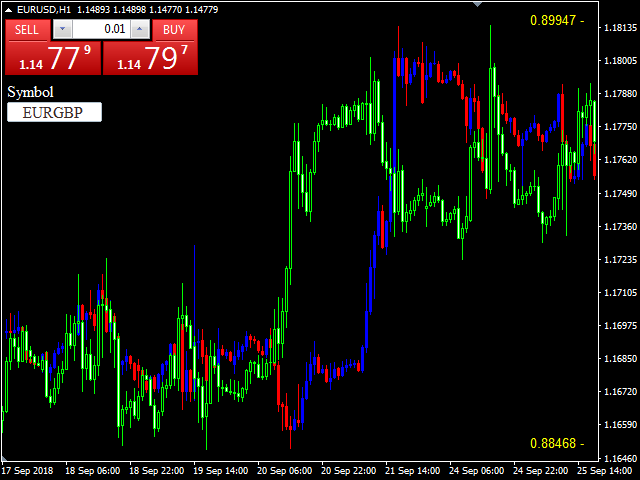
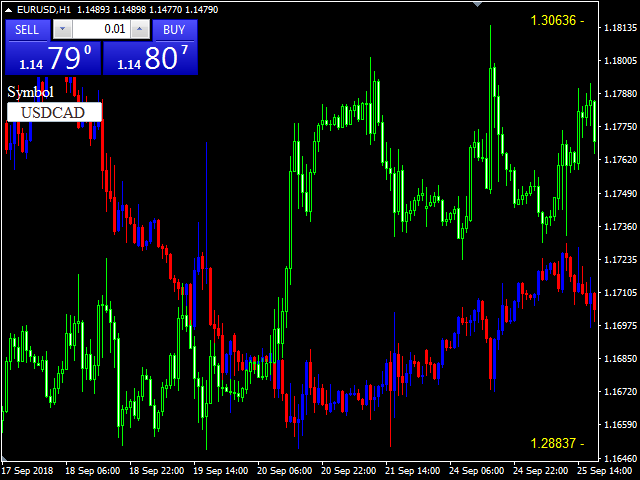
Das Verhalten verschiedener Währungspaare ist miteinander verbunden. Mit dem Visual Correlation -Indikator können Sie verschiedene Instrumente auf einem Diagramm anzeigen und dabei den Maßstab beibehalten.
Sie können eine positive, negative oder keine Korrelation definieren.
Manche Instrumente beginnen sich früher zu bewegen als andere. Solche Momente können durch Überlagerung von Diagrammen bestimmt werden.
Um ein Instrument in einem Diagramm anzuzeigen, müssen Sie seinen Namen in das Feld Symbol eingeben.
Version for MT5 https://www.mql5.com/de/market/product/109155


Good