Bollinger Bands Alert
- Indikatoren
- Hafis Mohamed Yacine
- Version: 1.0
- Aktivierungen: 5
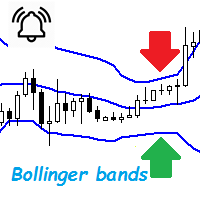
Bollinger Bands are a very common indicator in the world of online trading, this indicator gives very useful information for many forex trading strategies, but also for all other styles of strategies such as scalping and even trading medium and long term.
It is calculated from a moving average calculated over n periods (20 by default). From this moving average, a standard deviation calculation is defined. By adding this standard deviation in real time to the basic moving average, we obtain the upper Bollinger band and if we subtract this standard deviation from the moving average we obtain the lower Bollinger band.
According to theories, between 80% and 90% of prices must evolve between these two bands of Bollinger, outputs indicate strong trend pressures.
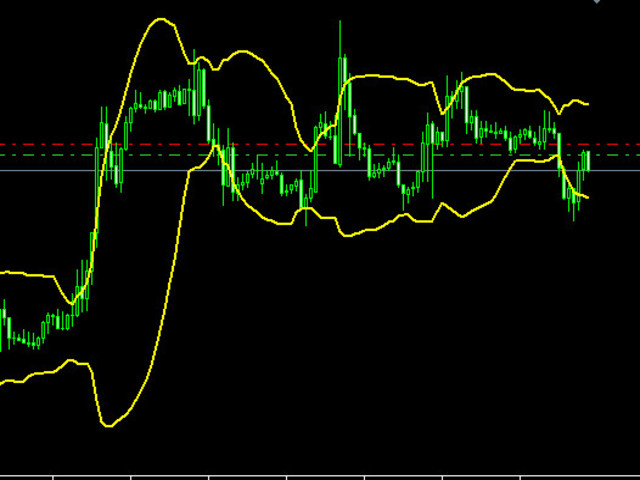
The evolution of the Bollinger Bands also provides information, as the Bollinger Bands diverge, volatility rises, and as the Bollinger Bands tighten, volatility declines.
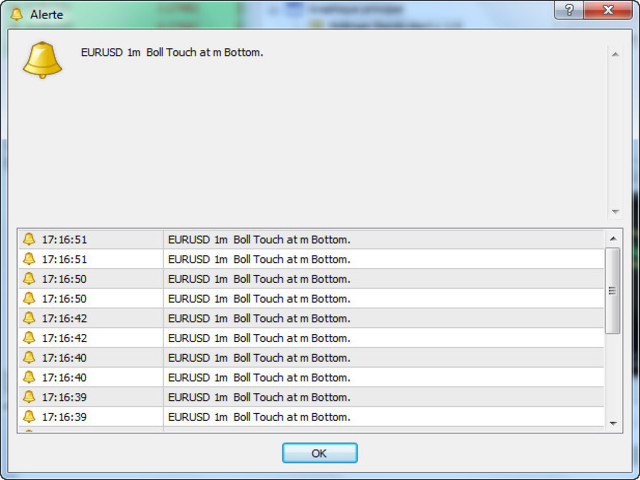
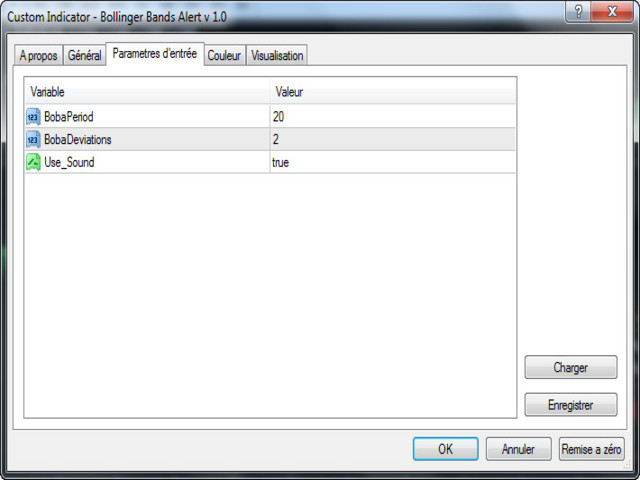
This indicator is very useful for many trading strategies, and the parameterizable alerts are undoubtedly a strong added value for this indicator.
Bollinger Band Alerts
Bollinger Bands are volatility bands plotted two standard deviations away from a simple moving average. Volatility is based on the standard deviation, which changes as volatility increases and decreases. The bands expand when volatility increases and narrow when volatility capturing 85%-90% of price action between the upper and lower bands.
How it Works
Knowing that the majority of price action is contained within the two bands we wait for price to break out of either the upper or lower band and then look to trade in the opposite direction expecting price to make a return towards the moving average.
Buy signals - The indicator waits for a candlestick low to break outside of the lower band. The indicator notifies you on the candlestick close.
Sell signals - Sell signals occur when a candlestick makes a high above the upper band.
