Topical levels
- Indikatoren
- Artem Kuzmin
- Version: 1.1
- Aktualisiert: 11 Mai 2022
- Aktivierungen: 5
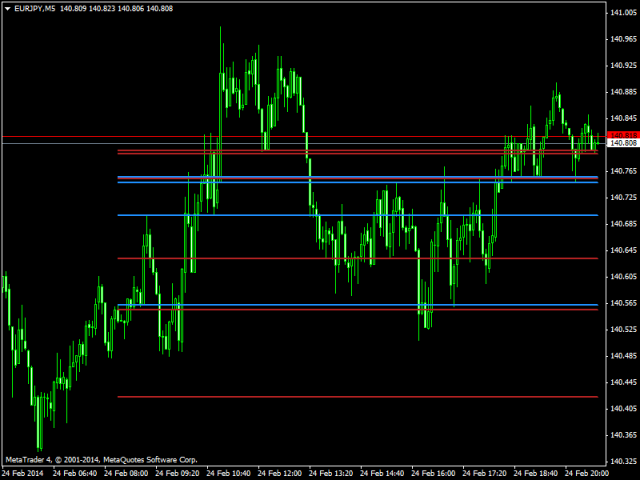
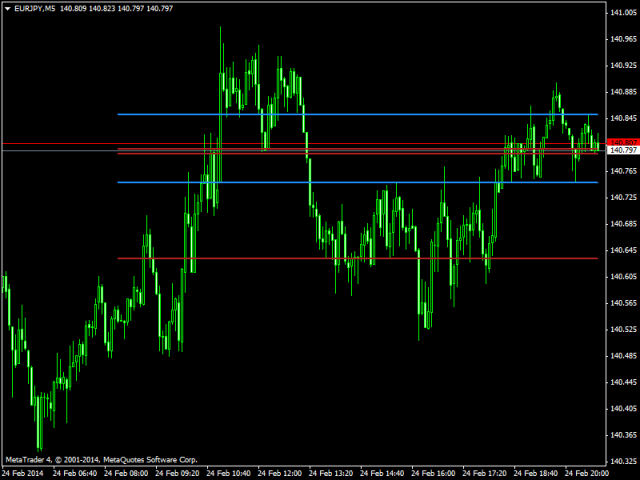
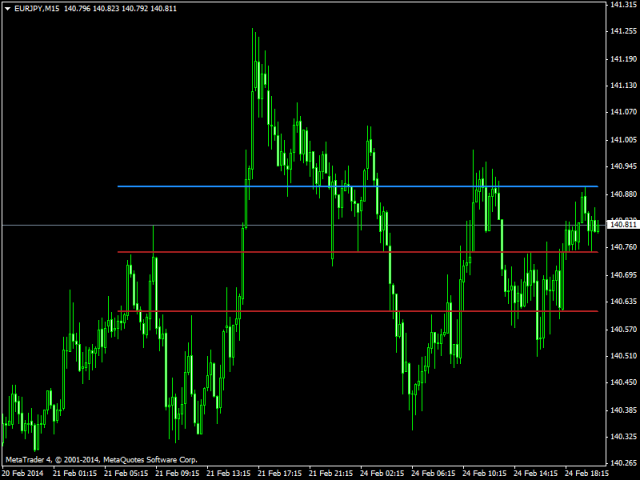
The indicator calculates critical price levels. If the level is red, the price has passed it downwards; if the level is blue, the price has passed it upwards. If the price is approaching the blue level from below, that level will most probably be broken through. If the price is approaching it from above, there will most probably be a rollback. Similarly, if the price is approaching the red level from above, the level will most probably be broken through. If the price is approaching it from below, the probability of a rollback is high.
The levels that are no longer relevant are removed from the chart after the number of bars equal to CalculationBars has been drawn.
The product is well suited both for following the market and using pending orders: stop ones following the trend and limit ones based on corrections. SL and TP levels are placed on the nearest price Lows/Highs. In that case, I recommend following SL/TP ratio not less than 1/2.
Settings and Description:
- CalculationBars - number of bars for calculating levels;
- LineLength - length of lines in bars;
- Filtr - filter for smoothing the price noise: the higher the values, the less the number of levels (from 1 to 100);
- UpColor - color of the levels the price broke through upwards;
- DnColor - color of the levels the price broke through downwards;
- LineWidth - line width.


