RenkoChartsDemo
- Utilitys
- Stanislav Korotky
- Version: 1.3
- Aktualisiert: 11 Juli 2018
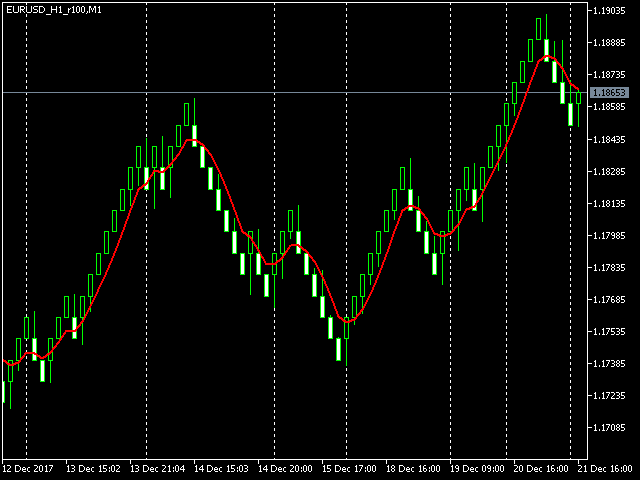
This is a demo version of a non-trading expert, which utilizes so called the custom symbols feature (available in MQL as well) to build renko charts based on historical quotes of selected standard symbol and to refresh renko in real-time according to new ticks. Also it translates real ticks to the renko charts, which allows other EAs and indicators to trade and analyze renko.
Place the EA on a chart of a working instrument. The lesser timeframe of the source chart is, the more precise resulting renko chart is, but the lesser number of boxes will be generated. This is so because available history is limited by the constant Max bars in chart in the terminal settings. The larger the source timeframe is, the deeper history is used for renko generation, but the lesser quality it has. This reduced accuracy of renko affects only regions generated from history, but all live changes of quotes (provided RenkoChartsDemo is running) generate absolutely accurate boxes - even more accurate than generated from M1 history.
The generated renko chart uses M1 timeframe. The start time of a "minute" bar corresponds to the start time of renko box. The end time of a such "minute" bar is dummy (MetaTrader does not allow for bars with different timespan), instead you should look at start time of the next "minute" bar. It makes no sense to switch the renko chart to a timeframe other than M1.
After its placement on a source chart, RenkoChartsDemo starts to generate missing renko bars for a custom symbol and shows a comment like this:
Processing bar: i / N
where i - number of a current bar being processed on the source timeframe (the numbering goes from maximum to 0), and N - total number of bars.
When the process is finished, the comment reads like this:
RenkoChart (100pt): open EURUSD_M1_renko / 10000 bars
where 100pt is the renkobox size in points, EURUSD_M1_renko is the custom symbol name (for both see description below), and 10 000 is total number of generated boxes (if the EA is running the very first time, this is actual number of renko bars, but if it continues from some previous results, for example, after the terminal restart, the number of new boxes can be a few, because only most recent, missing boxes are generated).
RenkoChartsDemo opens one renko chart for you, but you can open more.
RenkoChartsDemo generates custom symbol quotes, thus you may open many charts with it and apply different trading EAs and indicators. It makes no sense to run multiple RenkoChartsDemo with the same work symbol/timeframe/renkobox size. It is not allowed to run multiple RenkoChartsDemo with the same custom symbol name.
Due to technical limitations in MetaTrader 5, renko charts can demonstrate strange behavior under some circumstances. You may find details in the Comments section of the full version.
RenkoChartsDemo works with EURUSD M1 only. The utility does not work in the tester.
Parameters
- RenkoBoxSize - renkobox size in points, by default - 100;
- ShowWicks - enable/disable wicks on renko, by default - true;
- EmulateOnLineChart - enable/disable ticks emulation on the renko chart, by default - true; it allows other EAs to trade online from the renko chart;
- OutputSymbolName - name of the custom symbol for renko, by default - empty string - then the name is formed as "Symbol_Period_Type_Size", where Symbol - current work symbol, Period - current timeframe, Type - "r" (renko) if wicks are enabled or "b" (brick) if disabled, Size - RenkoBoxSize; example: "EURUSD_M15_r100";
- Reset - option to enforce complete recalculation of entire renko chart, by default - false; after it is set to true and calculations are completed, it is recommended to reset it back to false in order to eliminate excessive recalculations on every terminal restart; this mode is helpful in rare cases, when generated renko chart contains an error for some reason; normally the option is disabled, because the EA continues calculation smartly from most recent existing box;
- Throttle - minimal period in seconds between ticks (by default - 0, throttling is disabled);
- CloseTimeMode - when true, boxes are shown and formed at M1 close time; in this mode, only one tick is generated per box, when box is added completely formed to a chart; by default - false, i.e. boxes are created at M1 open time.


