Giant Nicely
- Indikatoren
- Artem Konkov
- Version: 1.0
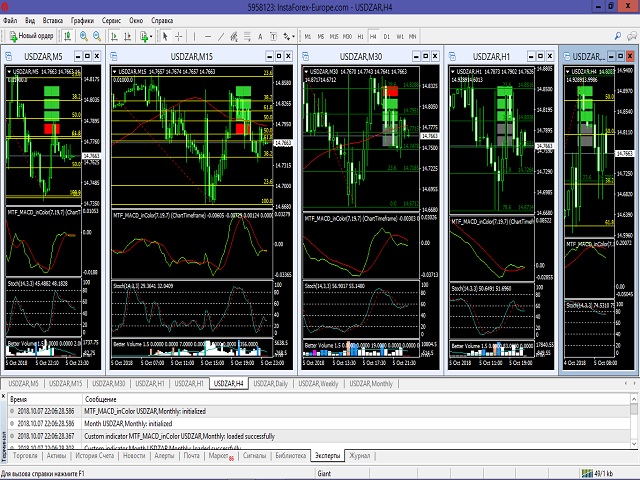
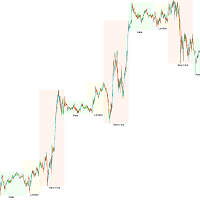
"Giant" is a flexible system in relation to trading strategies. It consists of two high-quality indicators that are installed on five different timeframes of the same currency pair (see screenshot). It monitors the trend and gives signals to open. The system passed a large number of checks and showed high accuracy.
Indicators are sold separately. The second word in the main name is the indicator itself. This issue sells the indicator "Nicely".
The principle of the system
The purpose of the system is to simultaneously display indicator signals on different timeframes. The "Attention" indicator is set on the M5 and M15 charts. The "Nicely" indicator is installed on the M30, H1 and H4 charts.
After the indicator "Attention" will give the opening signal on the chart M5, wait for the signal indicator "Nicely", set on the M30 chart. At the same time, the price should touch or be close to the automatic Fibonacci levels on the M30 and H1 charts (simultaneously on both charts). The last condition: on the M5 chart, you need to additionally set the stochastic, which must be below the level 20 (with a buy signal) or above the level 80 (with a sell signal). It is desirable that there was a divergence on the charts M5 and H1. If there is no divergence, it is better to wait for it.
The "Nicely" indicator on the H1 chart confirms the signal, and on the H4 chart it monitors the trend.
Once again about the conditions of opening a deal in the required sequence:
- The signal of the "Attention" indicator on the M5 chart.
- The signal on the "Nicely" indicator installed on the M30 chart.
- The price is near the Fibonacci levels simultaneously on the charts M30 and H1.
- On the M5 chart, the stochastic is below level 20 or above level 80.
All conditions must be met.
5. Divergence on the M5 and H1 charts is not a prerequisite.
The principle of operation of the display "Nicely"
The indicator is based on the strategy of "Three screen elder". This modification also includes automatic Fibonacci levels, "Parabolic", " WPR " and several other simple but proven indicators. The algorithm used added flexibility to the classic system. Despite the trouble, the signal bar indicator is almost the same from the classic. The predominance of the number of green rectangles indicates the desire to increase the price, and more red - the desire of the price to fall.
The signal will be reliable, when the price overcame the extreme Fibonacci level on the M30 chart. To open a trade, it is better to wait until the price is inside the levels again.
Parameters of the "Nicely" indicator"
For M30 chart:
- Fibo_Timeframe 15
- EMA_Timeframe 5
- MACD_Timeframe 5
- Stochastic_Timeframe 1
For H1 chart:
- Fibo_Timeframe 30
- EMA_Timeframe 15
- MACD_Timeframe 15
- Stochastic_Timeframe 5
For H4 chart:
- Fibo_Timeframe 60
- EMA_Timeframe 60
- MACD_Timeframe 60
- Stochastic_Timeframe 15
There are alerts in the settings.

