• Übersicht
  • Bewertungen (2)
  • Diskussion (50)
  • Neue Funktionen

Levels of Timeframes

5
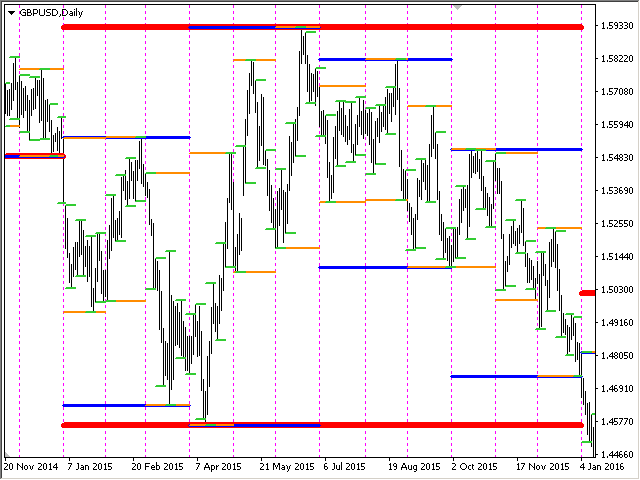
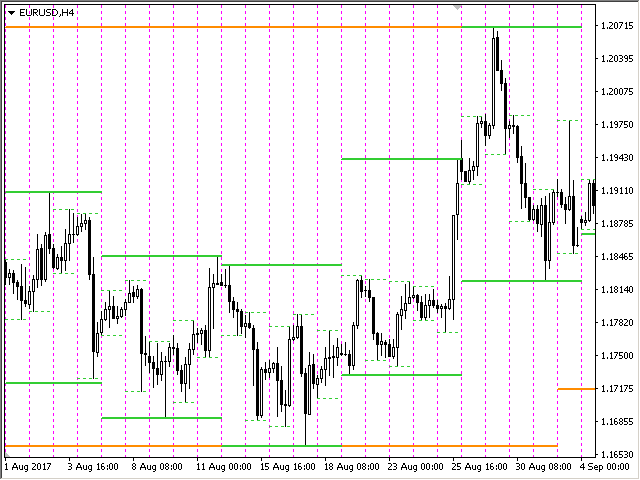
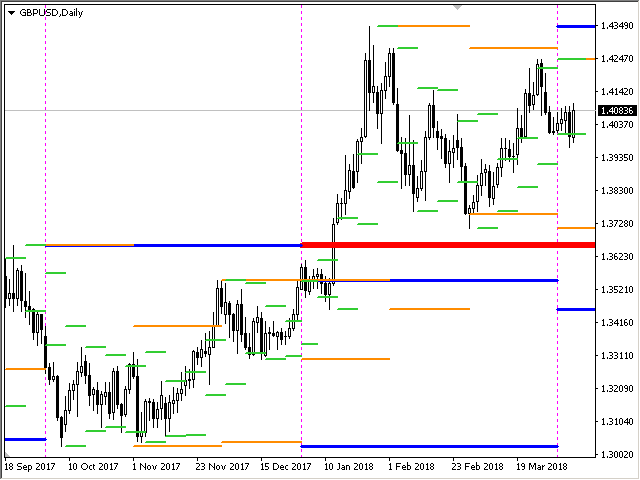
Der Indikator zeigt die Höchst-/Tiefst-/Eröffnungs-/Schlussniveaus aus anderen (und nicht standardmäßigen) Zeitrahmen an – Jahr, 6 Monate, 4 Monate, 3 Monate, 2 Monate, Monat, Woche, Tag, H3-H6-H8-H12 Stunden . Sie können auch die Verschiebung für das Öffnen von Kerzen festlegen und virtuelle Kerzen erstellen.
„Periodentrennzeichen“ für einen dieser Zeitrahmen sind in Form vertikaler Linien verfügbar. Alarme können für Ausbrüche des aktuellen oder vorherigen Niveaus konfiguriert werden (Ausbruch der Hoch-/Tieflinie von gestern/letzter Woche usw.).
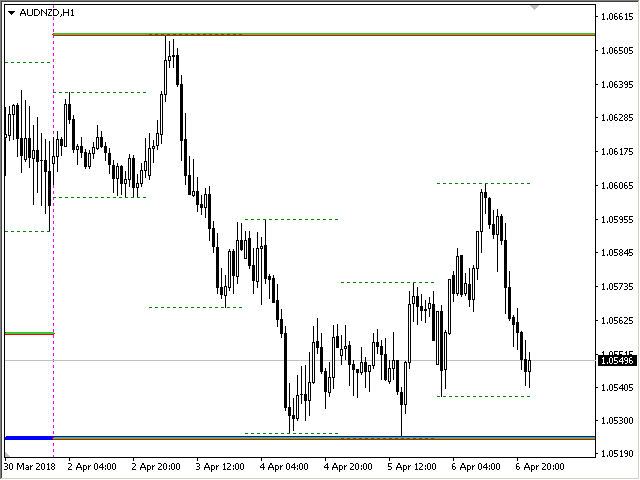
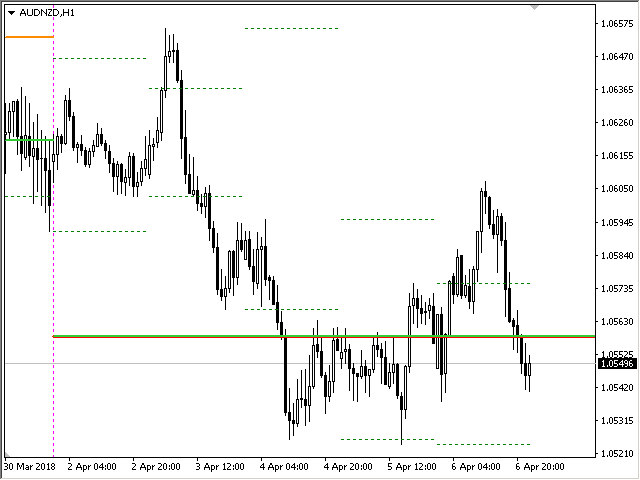
Sie können auch alle Ebenen um einen Punkt nach rechts verschieben. Das heißt, das Hoch/Tief der vorherigen Periode wird in der aktuellen Periode angezeigt.


Parameter

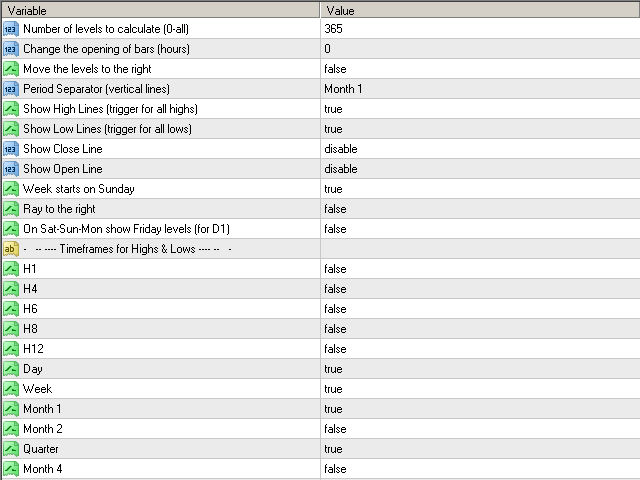
Number of levels to calculate (0-all) — wie viele Balken auf dem Bildschirm angezeigt werden.
Change the opening of bars (hours) — verschieben Sie die Öffnung von Kerzen um n Stunden. Der Indikator zeichnet virtuelle Balken unter Berücksichtigung der neuen Öffnungszeit. Perioden über MN1 ändern sich nicht.
Move the levels to the right — Verschiebt alle Ebenen um einen Balken nach rechts. Sie sehen die vorherigen Niveaus der aktuellen Kerze.
Period Separator (vertical lines) — zeigt eine vertikale Linie und ein Periodentrennzeichen an.
Show High Lines (trigger for all highs) — Deaktiviert oder aktiviert das Zeichnen hoher Pegel.
Show Low Lines (trigger for all lows) — deaktiviert oder aktiviert das Zeichnen niedriger Niveaus.
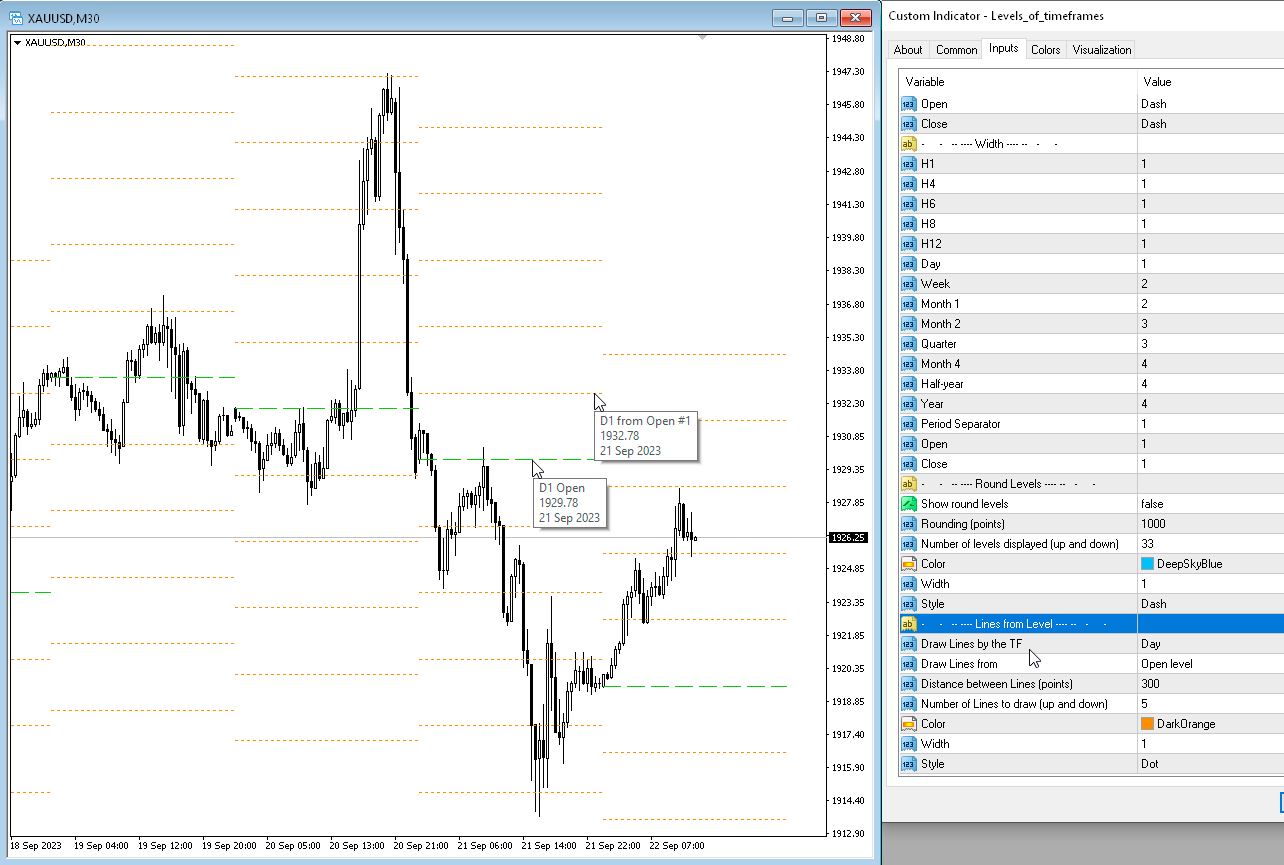
Show Open Line — Zeitrahmen, für den die offene Preislinie gezeichnet wird. Sie können „Alle TF für Hochs und Tiefs“ auswählen und die Level werden entsprechend den für die Hoch-Tiefs festgelegten Zeiträumen gezeichnet.
Show Close Line — Zeitrahmen, für den die Schlusskurslinie gezeichnet wird. Sie können „Alle TF für Hochs und Tiefs“ auswählen und die Niveaus werden entsprechend den für die Hochs und Tiefs angegebenen Zeiträumen gezeichnet.
Week starts on Sunday — im Terminal beginnen W1-Kerzen standardmäßig am Sonntag. Bei „false“ beginnt die Woche am Montag.

Show levels (Ebenen anzeigen)
from H1 to Year — zeigt Hoch-Tief aus ausgewählten Zeiträumen. Jahr, 6 Monate, 4 Monate, 3 Monate, 2 Monate, Monat, Woche, Tag, 4-6-8-12 Stunden
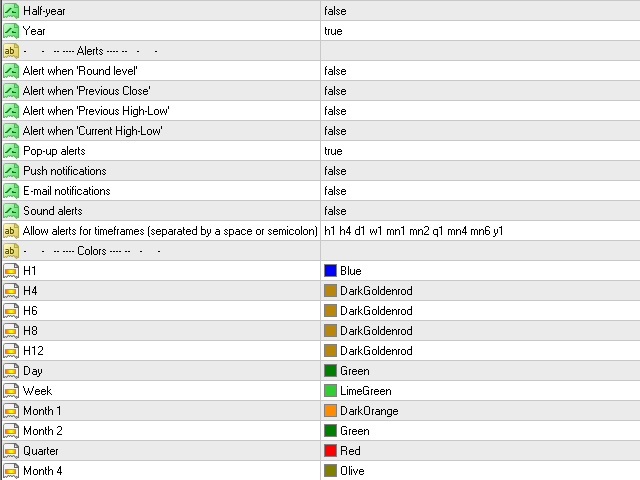
Alerts (Warnungen)
Alert when 'Round level' Senden Sie eine Benachrichtigung, wenn der Preis ein rundes Niveau erreicht.
Alert when 'Current Highs-Lows' — Senden Sie eine Benachrichtigung, wenn der Preis die aktuellen Niveaus erreicht.
Alert when 'Previous High-Low' — Senden Sie eine Benachrichtigung, wenn der Preis die vorherigen Niveaus erreicht.
Pop-up alerts — Popup-Benachrichtigungen.
Push notifications — Mitteilungen.
E-mail notifications — E-Mail Benachrichtigungen.
Sound alerts — Akustische Warnungen.
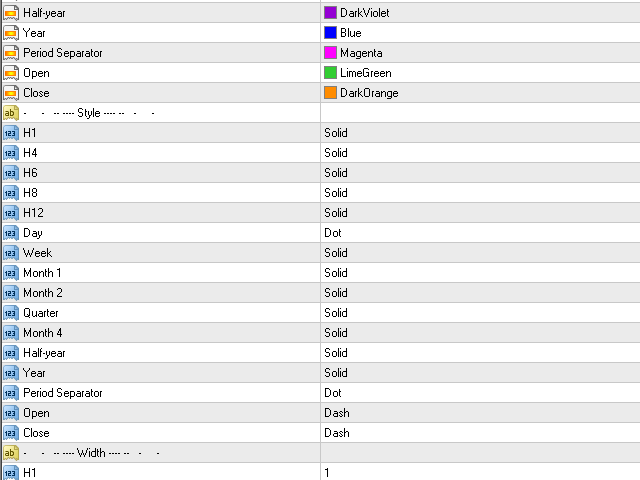
Colors (Farben)
from H1 to Year — Farbanpassung für Periodenlinien.
Period Separator — Farbe der Periodentrennlinien.

Line style (Linienstil)
from H1 to Year — Periodenlinienstil.
Period Separator — Stil der Periodentrennlinien.

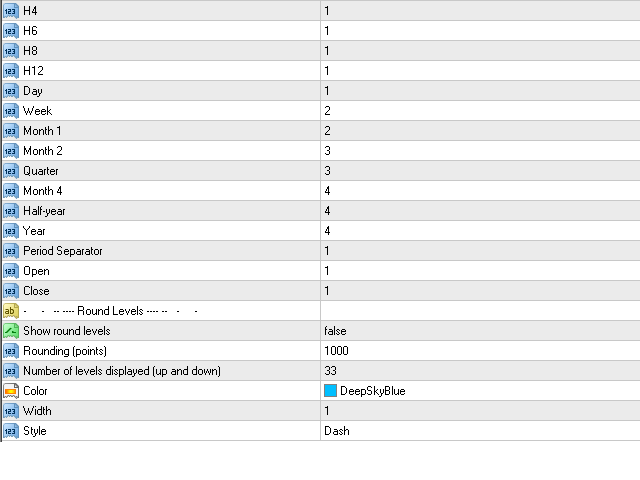
Line width (Linienbreite)
from H1 to Year — Periodenlinienbreite.
Period Separator — Breite der Periodentrennlinien.

Round Levels (Runde Level)
Show round levels — Runde Level anzeigen.
Rounding (points) — Rundung (Punkte).
Number of levels displayed (up and down) — die Anzahl der anzuzeigenden Ebenen nach oben und unten von der aktuellen Ebene.
Color — Farbe.
Width — Breite.
Style — Stil.
Bewertungen 2
Steve davies
26
Steve davies 2023.04.06 15:37 
 

great indicator, worth every penny.

Empfohlene Produkte
This product is a part of  ON Trade Waves Patterns Harmonic Elliot Wolfe you can test free version on EURJPY from this link  Wolf Waves Indicator E ntdecken Sie Wolf Waves - Ihr ultimatives Handelswerkzeug! Sind Sie auf der Suche nach einem leistungsstarken Tool, um Wolf Waves auf jedem Zeitrahmen leicht zu erkennen? Suchen Sie nicht weiter! Unser Wolf Waves-Indikator erledigt diese Aufgabe mühelos. Hier erfahren Sie, warum er perfekt für Sie ist: Hauptmerkmale: Automatische Erkennung: Unser
Monster Harmonic Indicator
Paul Geirnaerdt
4.61 (31)
Monster Harmonics Indicator is a harmonic pattern indicator. It recognizes Gartley, Bat, Crab, Butterfly, Cypher, White Swan, Black Swan, Shark and several other patterns. Projected patterns that are not yet completed are recognized, too. Monster even shows the PRZ (Potential Reversal Zone). Users can add their own user defined patterns to Monster. Besides the current pattern, Monster also shows all patterns in the symbols history. Monster will provide alerts for developing patterns. Introduced
All Symbols   AND  All Time frames Scan                                                                                                                 Document Introduction   The ABCD is a basic harmonic pattern. The ABCD pattern is a visual, geometric chart pattern comprised of three consecutive price swings. It looks like a diagonal lightning bolt and can indicate an upcoming trading opp
Awesome Oscillator by Bill Williams with the ability to fine-tune and replace the averaging algorithms of the indicator, which significantly expands the possibilities of using this oscillator in algorithmic trading and brings it closer in its properties to such an indicator as the MACD. To reduce price noise, the final indicator is processed with an additional Smooth averaging. The indicator has the ability to give alerts, send mail messages and push signals when the direction of movement of th
Royal Dutch Skunk
Sayan Vandenhout
ROYAL DUTCH SKUNK USES THE TREND WAVE INDICATOR AND IT CAN IDENTIFY THE BEGINNING AND THE END OF A NEW WAVE TREND MOVEMENT. AS AN OSCILLATOR, THE INDICATOR IDENTIFIES THE OVERBOUGHT AND OVERSOLD ZONES. IT WORKS GREAT TO CATCH THE SHORT TERM PRICE REVERSALS AND USES A MARTINGALE STRATEGY TO CLOSE ALL TRADES IN PROFIT. USE DEFAULT SETTINGS ON H1 OR HIGHER TIME FRAME ON ANY PAIR FOR MORE ACCURATE TRADES WHY THIS EA : Smart entries calculated by 6 great strategies The EA can be run on even a $20000
TWO PAIRS SQUARE HEDGE METER INDICATOR Try this brilliant 2 pairs square indicator It draws a square wave of the relation between your two inputs symbols when square wave indicates -1 then it is very great opportunity to SELL pair1 and BUY Pair2 when square wave indicates +1 then it is very great opportunity to BUY pair1 and SELL Pair2 the inputs are : 2 pairs of symbols         then index value : i use 20 for M30 charts ( you can try other values : 40/50 for M15 , : 30 for M30 , : 10 for H1 ,
KT Renko Patterns MT4
KEENBASE SOFTWARE SOLUTIONS
2.33 (3)
KT Renko Patterns scans the Renko chart brick by brick to find some famous chart patterns that are frequently used by traders across the various financial markets. Compared to the time-based charts, patterns based trading is easier and more evident on Renko charts due to their uncluttered appearance. KT Renko Patterns features multiple Renko patterns, and many of these patterns are extensively explained in the book titled Profitable Trading with Renko Charts by Prashant Shah. A 100% automate
Noize Absorption Index MT4
Ekaterina Saltykova
5 (1)
Noize Absorption Index - is the manual trading system that measures the difference of pressure between bears forces and bulls forces. Green line - is a noize free index that showing curent situation. Zero value of index shows totally choppy/flat market.Values above zero level shows how powerfull bullish wave is and values below zero measures bearish forces.Up arrow appears on bearish market when it's ready to reverse, dn arrow appears on weak bullish market, as a result of reverse expectation. S
Quantum Heiken Ashi PRO MT4
Bogdan Ion Puscasu
4.43 (7)
Wir stellen vor       Quantum Heiken Ashi PRO-   Charts Die Heiken-Ashi-Kerzen wurden entwickelt, um klare Einblicke in Markttrends zu geben und sind bekannt für ihre Fähigkeit, Rauschen herauszufiltern und falsche Signale zu eliminieren. Verabschieden Sie sich von verwirrenden Preisschwankungen und begrüßen Sie eine glattere, zuverlässigere Diagrammdarstellung. Was den Quantum Heiken Ashi PRO wirklich einzigartig macht, ist seine innovative Formel, die traditionelle Candlestick-Daten in leicht
Infinity Trend Pro
Yaroslav Varankin
1 (1)
This is a trend indicator without redrawing Developed instead of the binary options strategy (by the color of the Martingale candlestick) Also works well in forex trading When to open trades (binary options) A signal will appear in the place with a candle signaling the current candle It is recommended to open a deal for one candle of the current timeframe M1 and M5 When a blue dot appears, open a deal up When a red dot appears, open a trade down. How to open trades on Forex. When a signal is rec
RTrends
Nikolay Likhovid
The RTrends indicator does two things: first, it automatically draws the layout of the price chart by plotting trend lines and, secondly, it produces bearish and bullish signals. The layout reflects the fractal nature of the market. Trends from different time horizons are applied simultaneously on the chart. Thus, from a single chart a trader can see trend lines of higher timeframes. The lines, depending on the horizon, differ in color and width: the older the horizon, the thicker the line is. T
Trade with Gann on your side!! MASTER CIRCLE 360 CIRCLE CHART, originally created by Gann admitted that this is “The Mother of all charts”. It is one of the last studies that this great trader left for us. The numeric tab le is apparently quite simple like all the tables and is based on square numbers, the SQUARE OF 12 and is by evolution, one of the most important square numbers. Here we can find CYCLE, PRICE AND TIME thanks to angles and grades, to show past and future support and resistance.
VR Cub
Vladimir Pastushak
VR Cub ist ein Indikator für den Erhalt hochwertiger Einstiegspunkte. Der Indikator wurde entwickelt, um mathematische Berechnungen zu erleichtern und die Suche nach Einstiegspunkten in eine Position zu vereinfachen. Die Handelsstrategie, für die der Indikator geschrieben wurde, hat sich seit vielen Jahren bewährt. Ihr großer Vorteil liegt in der Einfachheit der Handelsstrategie, die es auch unerfahrenen Händlern ermöglicht, erfolgreich damit zu handeln. VR Cub berechnet Positionseröffnungspunkt
Forex Gump
Andrey Kozak
2.83 (6)
Forex Gump is a fully finished semi-automatic trading system. In the form of arrows, signals are displayed on the screen for opening and closing deals. All you need is to follow the instructions of the indicator. When the indicator shows a blue arrow, you need to open a buy order. When the indicator shows a red arrow, you need to open a sell order. Close orders when the indicator draws a yellow cross. In order to get the most effective result, we recommend using the timeframes H1, H4, D1. There
Price Breakout pattern Scanner is the automatic scanner for traders and investors. It can detect following patterns automatically from your chart. Head and Shoulder - Common tradable pattern. Reverse Head and Shoulder - This pattern is the reverse formation of the Head and Shoulder. Double Top - When the price hits resistance level twice and decline toward the support level, the trader can anticipate sudden bearish breakout through the support level. Double Bottom - The double bottom pattern is
Daily Candle Predictor ist ein Indikator, der den Schlusskurs einer Kerze vorhersagt. Der Indikator ist in erster Linie für die Verwendung in D1-Charts gedacht. Dieser Indikator eignet sich sowohl für den traditionellen Devisenhandel als auch für den Handel mit binären Optionen. Der Indikator kann als eigenständiges Handelssystem oder als Ergänzung zu Ihrem bestehenden Handelssystem verwendet werden. Dieser Indikator analysiert die aktuelle Kerze und berechnet bestimmte Stärkefaktoren innerhalb
To get access to MT5 version please click here . - This is the exact conversion from TradingView: "Stochastic Momentum Index" By "UCSgears". - This is a popular version of stochastic oscillator on tradingview. - This is a light-load processing and non-repaint indicator. - Buffers are available for the lines on chart. - You can message in private chat for further changes you need. Thanks for downloading
The Penta-O is a 6-point retracement harmonacci pattern which usually precedes big market movements. Penta-O patterns can expand and repaint quite a bit. To make things easier this indicator implements a twist: it waits for a donchian breakout in the right direction before signaling the trade. The end result is an otherwise repainting indicator with a very reliable trading signal. The donchian breakout period is entered as an input. [ Installation Guide | Update Guide | Troubleshooting | FAQ | A
Master Scalping M1 ist ein innovativer Indikator, der einen Algorithmus verwendet, um den Trend schnell und genau zu bestimmen. Der Indikator berechnet den Zeitpunkt zum Öffnen und Schließen von Positionen, die Indikatoralgorithmen ermöglichen es Ihnen, die idealen Zeitpunkte für den Einstieg in einen Handel (Kauf oder Verkauf eines Vermögenswerts) zu finden, was den Erfolg von Transaktionen für die meisten Händler erhöht. Vorteile des Indikators: Einfach zu bedienen, überladen Sie das Diagramm
Forex Indicator  " Morning  Star  pattern" for MT4 Indicator "Morning Star pattern" is a very powerful indicator for Price Action trading:    No repaint, No delays; Indicator   detects bullish Morning Star patterns on chart:  Blue arrow signal on chart (see pictures) P C, Mobile & Email alerts   are included Also its brother - bearish  " Evening Star pattern" indicator is available (follow the links below) Indicator  " Morning Star pattern"  is excellent to   combine with Support/Resistance Leve
For this set of indicators 1. General information     - Calculates with high performance mathematical algorithms.     - Calculated from the price of candles     - The entry point of this order is filtered by the train EMA and the oscillator.     - Calculate the integrity of the candle 2. How does it work?     - You can see two types of order entry points: the notification on the monitor and the arrow.     - You can trust 75-95 percent of this entry point. 3. Settings     - Retracement is re
Fibonacci-Erweiterung und Retracement-Analyse-Tool Fibonacci-Retracing- und Extended-Line-Tools für die MT4-Plattform, ideal für Trader, die die und den Golden Section-Handel nutzen Hauptmerkmale: 1. Sie können mehrere Sätze von Fibonacci-Retracements direkt zeichnen, und die Beziehung zwischen wichtigen Rückkehrpunkten ist auf einen Blick ersichtlich. 2. Kann Fibonacci-Erweiterungen zeichnen 3. Das Fibonacci-Foldback und die Verlängerung der Linie können nach links und nach rechts zu
Forex Indicator  " Shooting Star pattern" for MT4 Indicator  " Shooting Star pattern "  is very powerful indicator   for Price Action trading :    No repaint, No delays; Indicator   detects bearish Shooting Star patterns  on chart:    Red arrow signal on chart (see pictures) P C, Mobile & Email alerts   are included Indicator    " Shooting Star pattern"  is excellent to   combine with Support/Resistance  Levels // More great Expert Advisors and Indicators are available here:  https://www.mql5.co
The Candlestick Pattern Detector is an advanced MetaTrader 4 indicator designed to identify and highlight candlestick patterns on your charts. Currently, the indicator detects one specific candlestick pattern - the pinbar, known for its significance in technical analysis and trading strategies. This tool provides traders with visual cues, making it easier to spot potential market reversals or continuations. Features: Customizable Colors: Users can customize the colors of the bullish and bearish
Divergenzen sind schwierig zu finden und seltener anzutreffen. Sie sind eines der zuverlässigsten Handelsszenarien. Dieser Indikator sucht automatisch mit Ihrem bevorzugten Oszillator nach regelmäßigen und versteckten Abweichungen. [ Installationsanleitung | Update-Anleitung | Fehlerbehebung | FAQ | Alle Produkte ] Einfach zu handeln Findet regelmäßige und versteckte Abweichungen Unterstützt viele bekannte Oszillatoren Implementiert Handelssignale basierend auf Ausbrüchen Zeigt geeignete
Gold Bricks FX USES THE TREND WAVE INDICATOR AND IT CAN IDENTIFY THE BEGINNING AND THE END OF A NEW WAVE TREND MOVEMENT. AS AN OSCILLATOR, THE INDICATOR IDENTIFIES THE OVERBOUGHT AND OVERSOLD ZONES. IT WORKS GREAT TO CATCH THE SHORT TERM PRICE REVERSALS AND USES A MARTINGALE STRATEGY TO CLOSE ALL TRADES IN PROFIT. USE DEFAULT SETTINGS ON H1 OR HIGHER TIME FRAME ON ANY PAIR FOR MORE ACCURATE TRADES WHY THIS EA : Smart entries calculated by 4 great strategies The EA can be run on even a
Wolfe Wave Scanner MT4
Reza Aghajanpour
4.6 (10)
**  All Symbols  x  All Timeframes  scan just by pressing scanner button ** *** Contact me after the purchase to send you instructions and add you in "Wolfe Wave Scanner group" for sharing or seeing experiences with other users. Introduction: A Wolfe Wave is created with five-wave patterns in price. It shows supply and demand and a fight towards a balance price. T hese waves of price actions can help traders identify the boundaries of   the trend . Also  It helps forecast how the price will move
Promotion $66 lifetime for you. The principle of this indicator is very simple: detecting the trend with Moving Average, then monitoring the return point of graph by using the crossing of Stochastic Oscillator and finally predicting BUY and SELL signal with arrows, alerts and notifications. The parameters are fixed and automatically calculated on each time frame. Example: If you install indicator on EURUSD, timeframe M5: the indicator will detect the main trend with the Moving Average on this
GJ Options
Sayan Vandenhout
GJ OPTIONS USES THE TREND WAVE INDICATOR AND IT CAN IDENTIFY THE BEGINNING AND THE END OF A NEW WAVE TREND MOVEMENT. AS AN OSCILLATOR, THE INDICATOR IDENTIFIES THE OVERBOUGHT AND OVERSOLD ZONES. IT WORKS GREAT TO CATCH THE SHORT TERM PRICE REVERSALS AND USES A MARTINGALE STRATEGY TO CLOSE ALL TRADES IN PROFIT. USE DEFAULT SETTINGS ON H1 OR HIGHER TIME FRAME ON ANY PAIR FOR MORE ACCURATE TRADES WHY THIS EA : Smart entries calculated by 5 great strategies The EA can be run on even a $20000 account
Chart Patterns Detect 15 patterns (Ascending Triangle, Descending Triangle, Rising Wedge, Falling Wedge, Bullish Flag, Bearish Flag, Bullish Rectangle, Bearish Rectangle Symmetrical triangle, Head and Shoulders, Inverted Head and Shoulders, Triple top, Triple Bottom, Double Top, Double Bottom) Use historical data to calculate the probability of each pattern to succeed (possibility to filter notification according to the chance of success) gives graphic indication about the invalidation level and
Käufer dieses Produkts erwarben auch
Gann Made Easy
Oleg Rodin
4.88 (98)
Gann Made Easy ist ein professionelles und einfach zu bedienendes Forex-Handelssystem, das auf den besten Handelsprinzipien unter Verwendung der Theorie von Mr. basiert. W.D. Gann. Der Indikator liefert genaue KAUF- und VERKAUFSsignale, einschließlich Stop-Loss- und Take-Profit-Levels. Mit PUSH-Benachrichtigungen können Sie auch unterwegs handeln. Bitte kontaktieren Sie mich nach dem Kauf! Ich werde meine Handelstipps und tolle Bonusindikatoren kostenlos mit Ihnen teilen! Wahrscheinlich haben Si
Gold Stuff
Vasiliy Strukov
4.9 (269)
Gold Stuff-Ein Trendindikator, der speziell für Gold entwickelt wurde, kann auch auf allen Finanzinstrumenten verwendet werden. Der Indikator wird nicht neu gezeichnet und verzögert sich nicht. Empfohlener Zeitrahmen H1. Nach diesem Indikator geschrieben EA Gold Stuff Berater, können Sie es in meinem Profil finden. WICHTIG! Kontaktieren Sie mich sofort nach dem Kauf, um Anweisungen und Bonus zu erhalten!   Sie können eine kostenlose Kopie unseres Strong Support- und Trendscanner-Indikators
Trend Punch
Mohamed Hassan
4.91 (22)
This indicator is unstoppable when combined with our other indicator called  Support & Resistance . After purchase, send us a message and you will get it   for  FREE as a BONUS! Introducing Trend Punch , the revolutionary forex trend indicator that will transform the way you trade! Trend Punch is uniquely designed to provide precise buy and sell arrows during strong market trends, making your trading decisions clearer and more confident. Whether you're trading major currency pairs or exotic sym
Trend Pulse
Mohamed Hassan
5 (4)
Please contact me after purchase to immediately get your PDF strategy + documentation for Trend Pulse !  Official release price of $89  ( 3 /50 copies left). Next price is $199 . Introducing Trend Pulse , a unique and robust indicator capable of detecting bullish, bearish, and even ranging trends! Trend Pulse uses a special algorithm to filter out market noise with real precision. If the current symbol is moving sideways, Trend Pulse will send you a ranging signal, letting you know that it
Atomic Analyst
Issam Kassas
5 (3)
Zunächst einmal ist es erwähnenswert, dass dieser Handelsindikator nicht neu malt, nicht neu zeichnet und keine Verzögerung aufweist, was ihn sowohl für manuellen als auch für Roboterhandel ideal macht. Benutzerhandbuch: Einstellungen, Eingaben und Strategie. Der Atom-Analyst ist ein PA-Preisaktionsindikator, der die Stärke und das Momentum des Preises nutzt, um einen besseren Vorteil auf dem Markt zu finden. Ausgestattet mit fortschrittlichen Filtern, die helfen, Rauschen und falsche Signale z
Scalper Inside PRO
Alexey Minkov
4.75 (60)
An exclusive indicator that utilizes an innovative algorithm to swiftly and accurately determine the market trend. The indicator automatically calculates opening, closing, and profit levels, providing detailed trading statistics. With these features, you can choose the most appropriate trading instrument for the current market conditions. Additionally, you can easily integrate your own arrow indicators into Scalper Inside Pro to quickly evaluate their statistics and profitability. Scalper Inside
DERZEIT 26% RABATT Die beste Lösung für jeden Newbie oder Expert Trader! Dieser Indikator ist ein einzigartiges, qualitativ hochwertiges und erschwingliches Trading-Tool, da wir eine Reihe von proprietären Funktionen und eine neue Formel integriert haben. Mit nur EINEM Chart können Sie die Währungsstärke für 28 Forex-Paare ablesen! Stellen Sie sich vor, wie sich Ihr Handel verbessern wird, weil Sie in der Lage sind, den genauen Auslösungspunkt eines neuen Trends oder einer Scalping-Gelegenh
PZ Day Trading
PZ TRADING SLU
3.67 (3)
Dieser Indikator erkennt Preisumkehrungen im Zick-Zack, wobei nur Preisaktionsanalysen und ein Donchian-Kanal verwendet werden. Es wurde speziell für den kurzfristigen Handel entwickelt, ohne dass ein Nachlackieren oder ein Backpainting erforderlich ist. Es ist ein fantastisches Werkzeug für clevere Trader, die darauf abzielen, das Timing ihrer Operationen zu verbessern. [ Installationsanleitung | Update-Anleitung | Fehlerbehebung | FAQ | Alle Produkte ] Erstaunlich einfach zu handeln Es bi
Enigmera
Ivan Stefanov
5 (4)
ENIGMERA: Der Kern des Marktes https://www.enigmera.com Einführung Dieser Indikator und dieses Handelssystem sind ein bemerkenswerter Ansatz für die Finanzmärkte. ENIGMERA nutzt die fraktalen Zyklen zur genauen Berechnung von Unterstützungs- und Widerstandsniveaus. Er zeigt die echte Akkumulationsphase an und gibt Richtung und Ziele vor.  Ein System, das funktioniert, egal ob wir uns in einem Trend oder in einer Korrektur befinden.  Wie funktioniert es? ENIGMERA besteht aus drei Linien: der
Currency Strength Wizard ist ein sehr leistungsstarker Indikator, der Ihnen eine Komplettlösung für erfolgreichen Handel bietet. Der Indikator berechnet die Stärke dieses oder jenes Forex-Paares anhand der Daten aller Währungen in mehreren Zeitrahmen. Diese Daten werden in Form von benutzerfreundlichen Währungsindizes und Währungsstärkelinien dargestellt, anhand derer Sie die Stärke dieser oder jener Währung erkennen können. Sie müssen lediglich den Indikator an das Diagramm anhängen, mit dem Si
DERZEIT 31% RABATT! Die beste Lösung für jeden Newbie oder Expert Trader! Dieser Indikator ist ein einzigartiges, qualitativ hochwertiges und erschwingliches Handelsinstrument, da wir eine Reihe von proprietären Funktionen und eine geheime Formel eingebaut haben. Mit nur EINEM Chart liefert er Alerts für alle 28 Währungspaare. Stellen Sie sich vor, wie sich Ihr Handel verbessern wird, weil Sie in der Lage sind, den genauen Auslösepunkt eines neuen Trends oder einer Scalping-Gelegenheit zu e
Gold Channel is a volatility-based indicator, developed with a specific timing algorithm for the XAUUSD pair, which consists of finding possible corrections in the market. This indicator shows two outer lines, an inner line (retracement line) and an arrow sign, where the theory of the channel is to help identify overbought and oversold conditions in the market. The market price will generally fall between the boundaries of the channel. If prices touch or move outside the channel it is a tra
Order Block Hunter
Noha Mohamed Fathy Younes Badr
5 (1)
Order block hunter indicator is the best indicator for  hunt the order blocks that area where there has been a large concentration of limit orders waiting to be executed Order blocks are identified on a chart by observing previous price action and looking for areas where the price experienced significant movement or sudden changes in direction .This indicator does that for you by using very complicated codes and helps you to take the best areas To buy and sell because it make marks at the best a
Zunächst einmal ist es wichtig zu betonen, dass dieses Handelstool ein Nicht-Repaint-, Nicht-Redraw- und Nicht-Verzögerungsindikator ist, was es ideal für professionelles Trading macht. Online-Kurs, Benutzerhandbuch und Demo. Der Smart Price Action Concepts Indikator ist ein sehr leistungsstarkes Werkzeug sowohl für neue als auch erfahrene Händler. Er vereint mehr als 20 nützliche Indikatoren in einem und kombiniert fortgeschrittene Handelsideen wie die Analyse des Inner Circle Traders und Stra
FX Power MT4 NG
Daniel Stein
5 (12)
Erhalten Sie Ihr tägliches Marktupdate mit Details und Screenshots über unser Morning Briefing hier auf mql5 und auf Telegram ! FX Power MT4 NG ist die nächste Generation unseres langjährig sehr beliebten Währungsstärkemessers FX Power. Und was bietet dieser Stärkezähler der nächsten Generation? Alles, was Sie am ursprünglichen FX Power geliebt haben PLUS GOLD/XAU-Stärkeanalyse Noch präzisere Berechnungsergebnisse Individuell konfigurierbare Analysezeiträume Anpassbares Berechnungslimit für noc
Derzeit 20% Rabatt! Die beste Lösung für jeden Neueinsteiger oder Expert Händler! Dieses Dashboard arbeitet mit 28 Währungspaaren. Es basiert auf 2 unserer Hauptindikatoren (Advanced Currency Strength 28 und Advanced Currency Impulse). Es bietet einen hervorragenden Überblick über den gesamten Forex-Markt. Es zeigt die Werte der Advanced Currency Strength, die Veränderungsrate der Währungen und die Signale für 28 Devisenpaare in allen (9) Zeitrahmen. Stellen Sie sich vor, wie sich Ihr Hande
Trend Screener
STE S.S.COMPANY
4.82 (93)
Trendindikator, bahnbrechende, einzigartige Lösung für Trendhandel und -filterung mit allen wichtigen Trendfunktionen in einem Tool! Es handelt sich um einen 100 % nicht neu zu malenden Multi-Timeframe- und Multi-Währungs-Indikator, der für alle Symbole/Instrumente verwendet werden kann: Forex, Rohstoffe, Kryptowährungen, Indizes und Aktien. Trend Screener ist ein effizienter Trendfolgeindikator, der Pfeiltrendsignale mit Punkten im Diagramm liefert. Die Funktionen, die im Trendanalysator-Indika
- Real price is 80$ - 40% Discount ( It is 49$ now ) Contact me for instruction, any questions! Introduction The breakout and retest strategy is traded support and resistance levels. it involves price breaking through a previous level.  The break and retest strategy is designed to help traders do two main things, the first is to avoid false breakouts. Many false breakouts start with a candlestick that breaks out of a level but ends with an immediate candlestick that brings the price back into t
Advanced Supply Demand
Bernhard Schweigert
4.9 (314)
Derzeit 33% Rabatt! Die beste Lösung für jeden Anfänger oder erfahrenen Händler! Dieser Indikator ist ein einzigartiges, qualitativ hochwertiges und erschwingliches Trading-Tool, da wir eine Reihe von proprietären Funktionen und eine neue Formel integriert haben. Mit diesem Update werden Sie in der Lage sein, doppelte Zeitrahmenzonen anzuzeigen. Sie können nicht nur einen höheren TF (Zeitrahmen) anzeigen, sondern sowohl den Chart-TF als auch den höheren TF: SHOWING NESTED ZONES. Alle Supply Dema
Scalper Vault
Oleg Rodin
5 (29)
Scalper Vault ist ein professionelles Scalping-System, das Ihnen alles bietet, was Sie für erfolgreiches Scalping benötigen. Dieser Indikator ist ein komplettes Handelssystem, das von Forex- und Binäroptionshändlern verwendet werden kann. Der empfohlene Zeitrahmen ist M5. Das System liefert Ihnen genaue Pfeilsignale in Richtung des Trends. Es liefert Ihnen auch Top- und Bottom-Signale und Gann-Marktniveaus. Die Indikatoren bieten alle Arten von Warnungen, einschließlich PUSH-Benachrichtigungen.
BITTE LESEN SIE DIE INFORMATIONEN UNTEN, BEVOR SIE DAS PRODUKT KAUFEN! Apollo Pips PLUS SP ist ein einzigartiges Produkt! ES IST FÜR ALLE, DIE MEINEN NEUEN „APOLLO PIPS“-INDIKATOR PLUS „SUPER PACK“-BONUS MIT ZUGRIFF AUF ALLE MEINE HANDELSINDIKATOREN ERHALTEN MÖCHTEN! Mit dem Kauf des Produkts Apollo Pips PLUS SP erwerben Sie tatsächlich eine völlig neue Version meines Apollo Pips-Indikators. Diese Version des Indikators verfügt über einen verbesserten Algorithmus und einen benutzerfreundlichen P
Entry Points Pro
Yury Orlov
4.7 (226)
Dies ist ein Indikator für MT4, der genaue Signale für den Einstieg in einen Handel ohne Repainting (Neuzeichnen) liefert. Er kann auf alle Finanzwerte angewendet werden: Forex, Kryptowährungen, Metalle, Aktien, Indizes. Er liefert ziemlich genaue Schätzungen und sagt Ihnen, wann es am besten ist, eine Position zu eröffnen und zu schließen. Sehen Sie sich das Video (6:22) mit einem Beispiel für die Verarbeitung nur eines Signals an, das sich für den Indikator gelohnt hat! Die meisten Händler ver
Entdecken Sie das Geheimnis des erfolgreichen Forex -Handels mit unserem benutzerdefinierten MT4 -Indikator! Haben Sie sich jemals gefragt, wie Sie Erfolg auf dem Forex -Markt erzielen können und gleichzeitig Gewinne erzielen und gleichzeitig das Risiko minimieren können? Hier ist die Antwort, nach der Sie gesucht haben! Erlauben Sie uns, unseren proprietären MT4 -Indikator vorzustellen, der Ihren Handelsansatz revolutionieren wird. Einzigartige Vielseitigkeit Unser Indikator ist speziell
Automated Trendlines
Georgios Kalomoiropoulos
5 (17)
Trendlinien sind das wichtigste Werkzeug der technischen Analyse im Devisenhandel. Leider zeichnen die meisten Händler sie nicht richtig. Der automatische Trendlinien-Indikator ist ein professionelles Tool für ernsthafte Trader, das Ihnen hilft, die Trendbewegung der Märkte zu visualisieren. Es gibt zwei Arten von Trendlinien Bullische Trendlinien und Bärische Trendlinien. Im Aufwärtstrend wird die Forex-Trendlinie durch die niedrigsten Swing-Punkte der Preisbewegung gezogen. Wenn man m
M1 Arrow
Oleg Rodin
4.73 (15)
Eine Intraday-Strategie, die auf zwei Grundprinzipien des Marktes basiert. Der Algorithmus basiert auf der Analyse von Volumina und Preiswellen mit zusätzlichen Filtern. Der intelligente Algorithmus des Indikators gibt nur dann ein Signal, wenn sich zwei Marktfaktoren zu einem vereinen. Der Indikator berechnet Wellen eines bestimmten Bereichs auf dem M1-Diagramm unter Verwendung der Daten des höheren Zeitrahmens. Und um die Welle zu bestätigen, verwendet der Indikator eine Volumenanalyse. Dieser
IX Power MT4
Daniel Stein
5 (6)
IX Power bringt die unschlagbare Präzision von FX Power endlich auch zu Nicht-Forex-Symbolen. Es bestimmt präzise die Intensität von kurz-, mittel- und langfristigen Trends in Ihren Lieblingsindizes, Aktien, Rohstoffen, ETFs und sogar Kryptowährungen. Sie können alles analysieren, was Ihr Terminal zu bieten hat. Probieren Sie es aus und erleben Sie, wie sich Ihr Timing beim Handel deutlich verbessert . IX Power Hauptmerkmale 100% präzise, nicht nachpinselnde Berechnungsergebnisse - für
RelicusRoad Pro
Relicus LLC
4.73 (141)
Jetzt 147 US -Dollar (nach ein paar Aktualisierungen auf 499 US -Dollar) - Unbegrenzte Konten (PCs oder MACs) RelicusRoad Benutzerhandbuch + Schulungsvideos + Zugang zur privaten Discord-Gruppe + VIP-Status EINE NEUE ART, DEN MARKT ZU BETRACHTEN RelicusRoad ist der weltweit leistungsstärkste Handelsindikator für Forex, Futures, Kryptowährungen, Aktien und Indizes und gibt Händlern alle Informationen und Tools, die sie benötigen, um profitabel zu bleiben. Wir bieten technische Analysen un
MEHRWÄHRUNGS- und MULTITIMEFRAME-KAUF- UND VERKAUFSALARM. AUTO TRAILING STOP UND RISIKO REWARD TAKEPROFIT! Der Indikator scannt und analysiert den Markt, sodass Sie nichts zu tun haben! HANDELN SIE ALLE IHRE WÄHRUNGEN AUF EINEM CHART!   Bitte hinterlassen Sie nach dem Kauf einen Kommentar, kontaktieren Sie mich und ich sende Ihnen den Handelsassistenten EA. Der Indikator verwendet mehrere Oszillatoren und angeschlossene Filter, um die besten BESTÄTIGTEN Einstiegspunkte zu finden, sodass S
Italo Trend Indicator
Italo Santana Gomes
4.79 (38)
BUY INDICATOR AND GET EA FOR FREE AS A BONUS + SOME OTHER GIFTS! ITALO TREND INDICATOR  is the best trend indicator on the market, the Indicator works on all time-frames and assets, indicator built after 7 years of experience on forex and many other markets. You know many trend indicators around the internet are not complete, does not help, and it's difficult to trade, but the Italo Trend Indicator is different , the Italo Trend Indicator shows the signal to buy or sell, to confirm the signal t
Break and Retest
Mohamed Hassan
4.12 (17)
This Indicator only places quality trades when the market is really in your favor with a clear break and retest. Patience is key with this price action strategy! If you want more alert signals per day, you increase the number next to the parameter called: Support & Resistance Sensitivity.  After many months of hard work and dedication, we are extremely proud to present you our  Break and Retest price action indicator created from scratch. One of the most complex indicators that we made with ove
Weitere Produkte dieses Autors
Modifikation des stochastischen Oszillators für mehrere Währungen und mehrere Zeitrahmen. Sie können in den Parametern beliebige Währungen und Zeitrahmen angeben. Das Panel zeigt die aktuellen Werte und Schnittpunkte der Linien – Signal und Main (Stochastik-Crossover) – an. Außerdem kann der Indikator Benachrichtigungen senden, wenn überkaufte und überverkaufte Niveaus überschritten werden. Durch Klicken auf eine Zelle mit einem Punkt werden dieses Symbol und dieser Punkt geöffnet. Dies ist der
Inside Bar Dashboard
Taras Slobodyanik
5 (2)
Multicurrency and multi-timeframe indicator Inside Bar (IB). In the parameters, you can specify any desired currencies and timeframes. The panel displays the last found Inside Bar (and Mother Bar) pattern, the current price position and the breakout of the levels of the Mother and Inside Bars. You can set the size and color for bars and text in the cells. The indicator can also send notifications when levels are broken. By clicking on a cell with a period, the specified symbol and period will b
Time Scale for MT5
Taras Slobodyanik
4.9 (20)
The indicator draws the time scale on the chart. You can specify the time offset, adjust the size and font to display on the chart ( it is displaying your local time on your chart instead of MT time ). You can also select the desired format for displaying the date and time. You may be interested in my other product , which contains a more advanced version of the Time Scale . Parameters Hours (time shift) — time shift (hours); Minutes (time shift) — time shift (minutes); Show time on mouse — sh
FREE
Heikin Ashi Dashboard
Taras Slobodyanik
5 (4)
Multi-currency and multitimeframe Heikin Ashi indicator. Shows the current state of the market. On the scanner panel you can see the direction, strength and number of bars of the current trend. The Consolidation/Reversal candles are also shown using color. You can specify any desired currencies and periods in the parameters. Also, the indicator can send notifications when the trend changes or when reversal and consolidation candles (dojis) appear. By clicking on a cell, this symbol and period wi
ADX Dashboard
Taras Slobodyanik
5 (4)
Der ADX-Indikator wird verwendet, um den Trend und seine Stärke zu bestimmen. Die Richtung des Preises wird durch die Werte +DI und -DI angezeigt, und der ADX-Wert zeigt die Stärke des Trends. Wenn +DI über -DI liegt, befindet sich der Markt in einem Aufwärtstrend, wenn nicht, ist es ein Abwärtstrend. Wenn ADX unter 20 liegt, gibt es keine eindeutige Richtung. Sobald der Indikator dieses Niveau durchbricht, beginnt ein Trend mittlerer Stärke. Werte über 40 zeigen einen starken Trend an (einen A
MACD Dashboard
Taras Slobodyanik
Multi-currency and multi-timeframe indicator MACD. The dashboard can display both the Traditional (true) MACD and the MACD which is built into MetaTrader. On the panel you can see the current state of the indicator — the direction of movement of the MACD lines, their intersection and a pop-up window with the indicator chart. In the parameters you can specify any desired pairs-symbols and timeframes. The scanner can also send notifications about lines crossing each other and about lines crossing
MTF RSI for MT5
Taras Slobodyanik
5 (1)
Multi-timeframe indicator Relative Strength Index displays information simultaneously from different periods in one subwindow of the chart. Parameters Period of averaging — averaging period for the RSI calculation. Type of price — price used. Timeframes for RSI — list of periods, separated by a space or comma or semicolon. Number of bars for each period — the number of bars displayed for each period. Sort periods — sort periods if they are listed in no particular order. Current period first —
ZigZag Lines MTF
Taras Slobodyanik
4.33 (12)
Multi timeframe ZigZag indicator. It displays the support/resistance horizontal lines and their breakouts, as well as draws the current targets of the market. It can also display lines of the Fractals indicator and candles from other periods (up to Quarterly).  The indicator redraws the last (current) point, and in some cases can change the last 2-3 points. All lines are drawn as objects (not indicator buffers, but there is a possibility to receive the data for the EA ). When used in an Exp
Lines Profit Loss MT5
Taras Slobodyanik
4.61 (18)
Der Indikator zeigt den Gewinn (Verlust) des aktuellen Symbols an. Sie können die Linie frei per Drag & Drop verschieben, um den aktuellen Gewinn oder Verlust anzuzeigen. Parameter Calculation in money or in points — Berechnen Sie den Gewinn/Verlust in Punkten oder in Geld. Add pending orders to calculate — Berücksichtigen Sie ausstehende Aufträge bei Berechnungen. Magic Number (0 - all orders on symbol) — magische Zahl, wenn es notwendig ist, bestimmte Befehle auszuwerten. Offset for fir
FREE
ZigZag Dashboard for MT4
Taras Slobodyanik
4.75 (4)
Multicurrency and multitimeframe modification of the ZigZag indicator. Displays the current direction of the market, the height of the last movement, the number of bars in this movement and the breaking of the previous point of the ZigZag (horizontal line). This is MTF Scanner. You can specify any desired currencies and timeframes in the parameters. Also, the panel can send notifications when the ZigZag changes direction or when there was a breakthrough of the previous point. By clicking on a
ZigZag Dashboard for MT5
Taras Slobodyanik
5 (3)
Multicurrency and multitimeframe modification of the ZigZag indicator. Displays the current direction of the market, the height of the last movement, the number of bars in this movement and the breaking of the previous point of the ZigZag (horizontal line). This is MTF Scanner. You can specify any desired currencies and timeframes in the parameters. Also, the panel can send notifications when the ZigZag changes direction or when there was a breakthrough of the previous point. By clicking on a
Multi-currency and multitimeframe Heikin Ashi indicator. Shows the current state of the market. On the scanner panel you can see the direction, strength and number of bars of the current trend. The Consolidation/Reversal candles are also shown using color. You can specify any desired currencies and periods in the parameters. Also, the indicator can send notifications when the trend changes or when reversal and consolidation candles (dojis) appear. By clicking on a cell, this symbol and period wi
Der Indikator zeichnet automatisch die Fibonacci-Niveaus basierend auf dem ZigZag-Indikator, Handelssitzungen, Fraktalen oder Kerzen (einschließlich nicht standardmäßiger Zeitrahmen: Jahr, 6 Monate, 4 Monate, 3 Monate, 2 Monate) (Auto-Fibo-Retracement). Sie können einen beliebigen höheren Zeitrahmen für die Fibonachi-Berechnung wählen. Die Level werden jedes Mal neu gezeichnet, wenn der aktuelle Balken schließt. Es ist möglich, Warnungen beim Überschreiten der angegebenen Ebenen zu aktivieren.
Lines Profit Loss
Taras Slobodyanik
4.82 (22)
Der Indikator zeigt den Gewinn (Verlust) des aktuellen Symbols an. Sie können die Linie frei per Drag & Drop verschieben, um den aktuellen Gewinn oder Verlust anzuzeigen. Parameter Calculation in money or in points — Berechnen Sie den Gewinn/Verlust in Punkten oder in Geld. Add pending orders to calculate — Berücksichtigen Sie ausstehende Aufträge bei Berechnungen. Magic Number (0 - all orders on symbol) — magische Zahl, wenn es notwendig ist, bestimmte Befehle auszuwerten. Offset for fir
FREE
Fractals Dashboard MT4
Taras Slobodyanik
5 (3)
Multicurrency and multitimeframe modification of the Fractals indicator. Displays the last two fractals — their sequence (and which one is broken), or the distance between them. You can specify any desired currencies and timeframes in the parameters. Also, the panel can send notifications on a fractal's breakout. By clicking on a cell with a period, this symbol and period will be opened. This is MTF Scanner. The key to hide the dashboard from the chart is "D" by default. Parameters Calculati
Modifikation des stochastischen Oszillators für mehrere Währungen und mehrere Zeitrahmen. Sie können in den Parametern beliebige Währungen und Zeitrahmen angeben. Das Panel zeigt die aktuellen Werte und Schnittpunkte der Linien – Signal und Main (Stochastik-Crossover) – an. Außerdem kann der Indikator Benachrichtigungen senden, wenn überkaufte und überverkaufte Niveaus überschritten werden. Durch Klicken auf eine Zelle mit einem Punkt werden dieses Symbol und dieser Punkt geöffnet. Dies ist der
CCI Dashboard for MT5
Taras Slobodyanik
5 (1)
Multicurrency and multitimeframe modification of the Commodity Channel Index (CCI) indicator. You can specify any desired currencies and timeframes in the parameters. Also, the panel can send notifications when crossing overbought and oversold levels. By clicking on a cell with a period, this symbol and period will be opened. This is MTF Scanner. The key to hide the dashboard from the chart is "D" by default. Parameters CCI Period  — averaging period. CCI Applied price  — price type. Clea
MA Dashboard
Taras Slobodyanik
4.5 (2)
Mehrwährungs- und Mehrzeitrahmen-Modifikation des Indikators Moving Average (MA). Auf dem Dashboard können Sie den aktuellen Status des Indikators sehen – Ausbrüche und Berührungen (nach Preis) des Fast MA und Slow MA sowie die Schnittpunkte der MA-Linien untereinander (Moving Average Crossover). In den Parametern können Sie beliebige Währungen und Zeitrahmen angeben. Außerdem kann der Indikator Benachrichtigungen über den Preis senden, der die Linien berührt, und über deren Kreuzung. Durch Kli
Magnifier Ruler Crosshair
Taras Slobodyanik
5 (3)
The indicator has three main tools: Magnifier (Zoom chart), Ruler  ( Time and Price scales ),   and Crosshair. You can move it all around with your mouse and customize different formats for  displaying , customize   size and color of each element. The Magnifier (zoom chart) allows you to display candles from any time frame and at different scales. Hotkeys: 'Q' - higher timeframe, 'A' - lower timeframe, 'W' - decrease candle size, 'S' - increase candle size, 'Z' - show/hide zoom chart. You c
Symbol Manager
Taras Slobodyanik
5 (5)
Symbol Manager or Grid Manager, designed to group orders into one position (by symbol and by direction). This utility will be useful to multi-currency traders, who can have multiple orders on several pairs. You will be able to see the total number of lots, the total profit, and set virtual stop loss and virtual take profit. To set a real TP (or SL), you must first set the virtual value, and then enter the command in this cell: "set". If you want to set real TP/SL for all orders at once, then en
ZigZag Lines MTF for MT5
Taras Slobodyanik
5 (8)
Multi timeframe ZigZag indicator. It displays the support/resistance horizontal lines and their breakouts, as well as draws the current targets of the market. It can also display lines of the Fractals indicator and candles from other periods (up to Quarterly).  The indicator redraws the last (current) point, and in some cases can change the last 2-3 points. All lines are drawn as objects (not indicator buffers, but there is a possibility to receive the data for the EA ). When used in an Exp
Inside Bar MT4
Taras Slobodyanik
4 (4)
The indicator determines the inside bar and marks its High/Low. It is plotted based on the closed candles (does not redraw). The identified inside bar can be displayed on the smaller periods. You may set a higher period (to search for the inside bar) and analyze on a smaller one. Also you can see the levels for Mother bar. Indicator Parameters Period to find Inside Bar — the period to search for the inside bar. If a specific period is set, the search will be performed in that period. Type of i
ADX Dashboard MT5
Taras Slobodyanik
5 (3)
Der ADX-Indikator wird verwendet, um den Trend und seine Stärke zu bestimmen. Die Richtung des Preises wird durch die Werte +DI und -DI angezeigt, und der ADX-Wert zeigt die Stärke des Trends. Wenn +DI über -DI liegt, befindet sich der Markt in einem Aufwärtstrend, wenn nicht, ist es ein Abwärtstrend. Wenn ADX unter 20 liegt, gibt es keine eindeutige Richtung. Sobald der Indikator dieses Niveau durchbricht, beginnt ein Trend mittlerer Stärke. Werte über 40 zeigen einen starken Trend an (einen A
Time Scale
Taras Slobodyanik
4.8 (10)
The indicator draws the time scale on the chart. You can specify the time offset, adjust the size and font to display on the chart (it is displaying your local time on your chart instead of MT time). You can also select the desired format for displaying the date and time. While holding down the middle mouse button, and moving the cursor, a slider will appear on the scale. You may be interested in my other product , which contains a more advanced version of the Time Scale. Parameters Hours (tim
FREE
Symbol Manager for MT5
Taras Slobodyanik
5 (1)
Symbol Manager or Grid Manager, designed to group orders into one position (by symbol and by direction). This utility will be useful to multi-currency traders, who can have multiple orders on several pairs. You will be able to see the total number of lots, the total profit, and set virtual stop loss and virtual take profit. To set a real TP (or SL), you must first set the virtual value, and then enter the command in this cell: "set". If you want to set real TP/SL for all orders at once, then en
News Dashboard MT5
Taras Slobodyanik
This dashboard displays current news from three sources: from the ForexFactory.com website (FFC calendar), from the Investing.com website and the Economic Calendar from mql5.com. You can sort news by impact and by country, and display them on the chart with one click. By holding down the 'Ctrl' key, you can select several different 'currencies' or 'impacts' to sort. Also, this utility shows not only the forecast, but also the actual values ​​after they appear on the site. You can set a separate
News Dashboard MT4
Taras Slobodyanik
4.43 (7)
This dashboard displaying current news from ForexFactory.com (calendar FFC) and from the Investing.com website . You can sort news by impact and by country, and display them on the chart with one click. By holding down the 'Ctrl' key, you can select several different 'currencies' or 'impacts' to sort. Also, this utility shows not only the forecast, but also the actual values ​​after they appear on the site. You can set a separate notification for each news. You can read the news using your EA
Multicurrency and multitimeframe modification of the indicator Bollinger Bands. On the dashboard you can see breakouts and touches of the Bollinger Bands. In the parameters you can specify any desired currencies and timeframes. The indicator can also send notifications when the price touches the Bollinger Bands, when the current volatility changes (expands or falls), and when the price touches all the bands. By clicking on a cell with a period, this symbol and period will be opened. This is MTF
Modifikation des Relative Strength Index (RSI)-Indikators für mehrere Währungen und mehrere Zeitrahmen. Sie können in den Parametern alle gewünschten Währungen und Zeitrahmen angeben. Außerdem kann das Panel Benachrichtigungen senden, wenn überkaufte und überverkaufte Niveaus überschritten werden. Durch Klicken auf eine Zelle mit einem Punkt werden dieses Symbol und dieser Punkt geöffnet. Dies ist der MTF-Scanner. Die Taste zum Ausblenden des Dashboards aus dem Diagramm ist standardmäßig „D“.
Auswahl:
Steve davies
26
Steve davies 2023.04.06 15:37 
 

great indicator, worth every penny.

trade2travel12
36
trade2travel12 2020.11.04 09:29 
 

I purchased this Levels of Timeframes indicator but I cannot access it. Where is it? Where is the exe file or zip file?? Please email it to trade2travel12@gmail.com immediately

Taras Slobodyanik
67166
Antwort vom Entwickler Taras Slobodyanik 2023.04.24 10:50
Hello. You can download the product from your MT4/MT5 (from Market tab). If you want to contact me write a private message.
Antwort auf eine Rezension
Version 4.0 2024.02.12
1) Added parameters for the H3 timeframe.
2) Fixed a bug in displaying extra Separator lines in the past.
Version 3.90 2023.09.29
1) Added parameter "Alert when 'Previous Open'".
Version 3.80 2023.09.22
1) Added parameters for drawing lines from a given level - "Lines from Level".
Version 3.70 2023.08.11
1) Fixed bug updating levels H6, H8, H12.
Version 3.60 2023.05.29
1) Fixed bug of period separator alerts.
Version 3.50 2023.04.26
1) Made the saving of the "show/hide levels" variable into the global variables of the terminal.
Version 3.40 2023.04.24
1) Added parameter "Hotkey to show/hide levels".
Version 3.30 2023.04.02
1) Added non-standard (for MT4) timeframes H6, H8, H12.
Version 3.20 2022.12.17
1) Fixed a possible bug on the current bar D1.
Version 3.10 2022.12.16
1) Added parameter "On Sat-Sun-Mon show Friday levels (for D1)". The indicator will draw Friday levels on Saturday-Sunday-Monday.
Version 3.0 2022.12.12
1) Added TF list parameter for alerts - "Allow alerts for timeframes". If this parameter is empty, then all alerts will be sent.
Version 2.90 2022.10.02
1) Added parameter extending all levels to the right "Ray to the right".
Version 2.80 2022.05.02
1) Added levels for the H1 timeframe.
Version 2.70 2021.10.05
1) Added alerts when crossing the Close levels.
2) Fixed a bug with drawing Close levels on the current bar.
Version 2.60 2021.10.03
1) Added options to disable drawing of Highs/Lows levels. Now you can only see the Close levels.
2) Added the "All TF for Highs & Lows" option to draw Close/Open levels. You can now see these levels from many timeframes.
Version 2.50 2021.06.25
1) Added round levels, and alerts for them.
Version 2.40 2021.01.17
1) Added parameter "Week starts on Sunday".
Version 2.30 2021.01.14
1) Added parameters for showing open and close lines.
Version 2.20 2020.06.12
1) Fixed display of levels on the first bar.
Version 2.10 2020.06.11
1) Added the option "Change the opening of bars". Now you can see the virtual candles.
2) Added periods H6, H8, H12.
Version 1.30 2020.06.10
1) Recompilation for the new build.
Version 1.20 2020.01.18
1) Code optimization.
Version 1.10 2020.01.18
1) Added parameter: "Number of levels to calculate".