• Übersicht
  • Bewertungen
  • Diskussion (1)
  • Neue Funktionen

MTF Moving Averages overbought and oversold

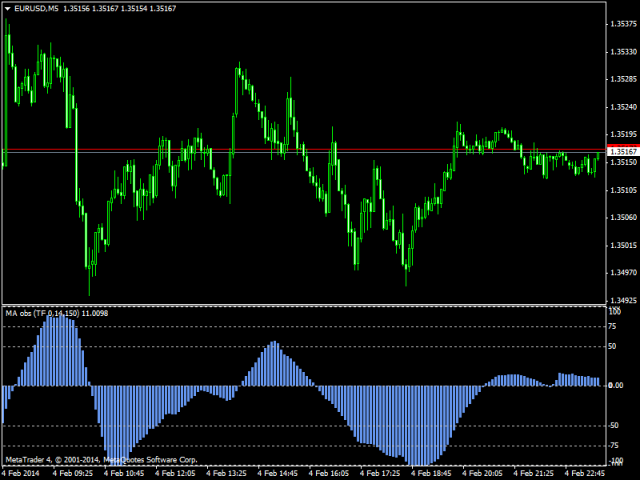
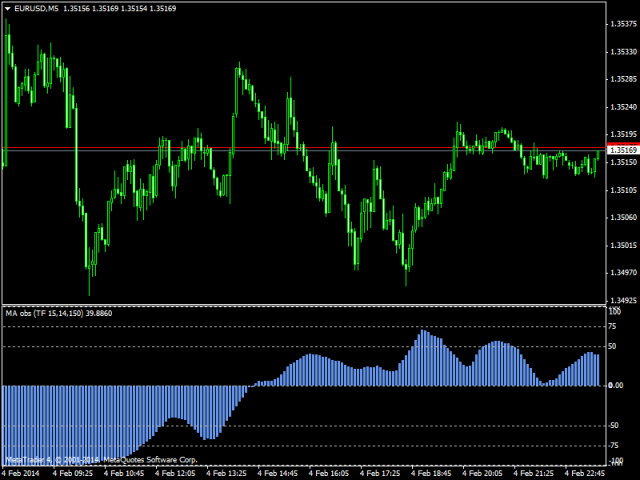
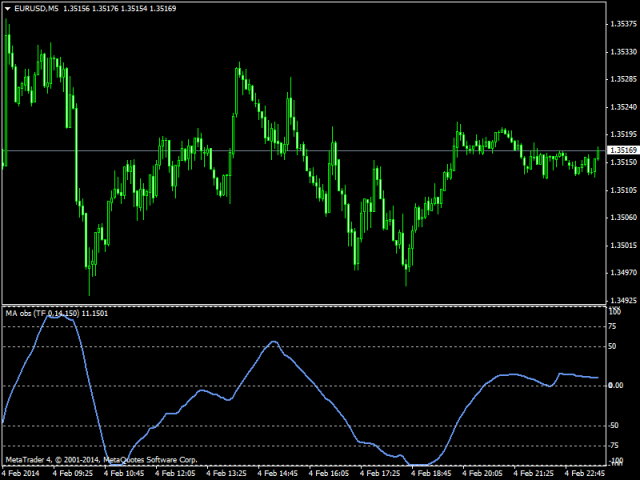
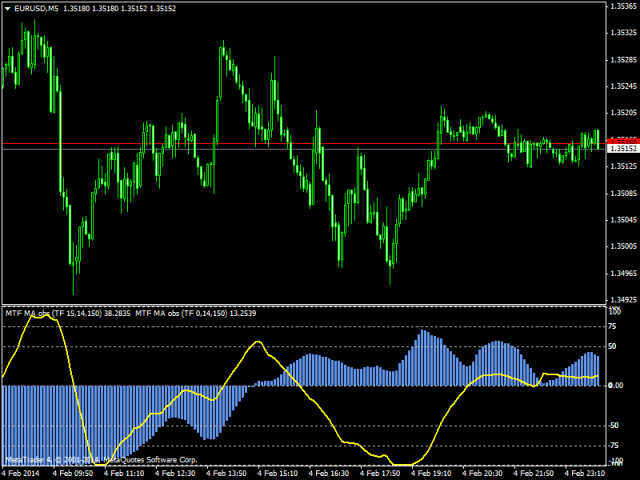
MTF Moving Averages indicator with overbought and oversold zones.

Two display options - as a line and as a histogram.

A series of OBS (overbought and oversold) indicators - these are indicators that have been enhanced with overbought and oversold zones.

Another feature of this indicator is that the lines of the indicators (when analyzing several indicators in a single window) are not redrawn relative to each other when scrolling the chart.

Settings

  • OBS Period - period of overbought/oversold calculation
  • Period MA - period of MA
  • Shift MA - shift MA
  • Price MA - price MA calculation prices
  • Method MA - MA calculation method
  • Time Frame - time frame used for calculation of MA
  • Line or Histo - displaying by line or histogram

Empfohlene Produkte
Forex Indicator "HTF Envelopes" for MT4 Upgrade   your trading methods with the professional  HTF   Envelopes  for MT4. H TF means -   H igher Time Frame Envelopes    is one of the best trend indicator on the market - perfect tool for trading It is used to help traders to identify extreme overbought and oversold conditions as well as trading ranges. HTF   Envelopes indicator is excellent for   Multi-Time Frame trading systems   with Price Action entries or in combination with other indicators. I
The Penta-O is a 6-point retracement harmonacci pattern which usually precedes big market movements. Penta-O patterns can expand and repaint quite a bit. To make things easier this indicator implements a twist: it waits for a donchian breakout in the right direction before signaling the trade. The end result is an otherwise repainting indicator with a very reliable trading signal. The donchian breakout period is entered as an input. [ Installation Guide | Update Guide | Troubleshooting | FAQ | A
VWap Bands EForex
Veridiana Adorno Kendrick
VWAP Bands Metatrader 4 Forex Indicator The VWAP Bands Metatrader 4 Forex indicator is a quite similar to the Bollinger bands, but it deploys volume weighted average as the core value of the bands. There is an option of using the tick volume or real volume for calculation when using the VWAP Bands Metatrader 5 custom forex indicator, especially when the forex broker displays symbol alongside real volume. Similarly, you can decide to have deviations calculated with the sample correction or not
Indicator for binary options arrow is easy to use and does not require configuration works on all currency pairs, cryptocurrencies buy signal blue up arrow sell signal red down arrow tips do not trade during news and 15-30 minutes before their release, as the market is too volatile and there is a lot of noise it is worth entering trades one or two candles from the current period (recommended for 1 candle) timeframe up to m 15 recommended money management fixed lot or fixed percentage of the depo
The Visual Volatility Clustering indicator clusters the market based on volatility. The indicator does not redraw and gives accurate data, does not use closing prices. Uses the opening prices or the highs or lows of the previous completed bar. Therefore, all information will be clear and unambiguous. The essence of the indicator is to divide the price market into certain areas according to a similar type of volatility. This can be done in any way. In this example, the indicator is configured fo
The principle of this indicator is very simple: detecting the trend with Moving Average, then monitoring the return point of graph by using the crossing of Stochastic Oscillator and finally predicting BUY and SELL signal with arrows, alerts and notifications. The parameters are fixed and automatically calculated on each time frame. Example: If you install indicator on EURUSD, timeframe M5: the indicator will detect the main trend with the Moving Average on this timeframe (for example the Moving
Elliott Wave Trend was designed for the scientific wave counting. This tool focuses to get rid of the vagueness of the classic Elliott Wave Counting using the guideline from the template and pattern approach. In doing so, firstly Elliott Wave Trend offers the template for your wave counting. Secondly, it offers Wave Structural Score to assist to identify accurate wave formation. It offers both impulse wave Structural Score and corrective wave Structure Score. Structural Score is the rating to sh
Dear traders I am happy to introduce to you my new tool called "Brilliant Oscillator" Indicator. This is one of the indicators that can be used as a stand alone indicator. WHAT I LIKE ABOUT THIS TOOL IS Fast and reliable signals Purpose The purpose of this tool is to assist both newbie and Advanced traders to analyze the market with high level of accuracy in both bearish and bullish market trends. The inputs In the input section you will be able to change colors of the indicator only. Currency p
Warning: Our product works with 28 symbols. The average accuracy level of the signals is 99%. We see signals below 15 pips as unsuccessful. Technique Signal   indicator is designed for signal trading. This indicator generates trend signals. It uses many algorithms and indicators to generate this signal. It tries to generate a signal from the points with the highest trend potential. This indicator is a complete trading product. This indicator does not need any additional indicators. The
The   Visual Volatility Clustering   indicator clusters the market based on volatility. The indicator does not redraw and gives accurate data, does not use closing prices. Uses the opening prices or the highs or lows of the previous completed bar. Therefore, all information will be clear and unambiguous. The essence of the indicator is to divide the price market into certain areas according to a similar type of volatility. This can be done in any way. In this example, the indicator is configure
Trend Flasher Trend is your friend is the age old saying quote in trading arena, there are though many ways to gauge the trend and its direction, more scientific measure and logically meaningful will be an ATR break outs to identify and spot the trend and its acceleration, so we created this easy to use trend identification panel and optimized super trend based multi time frame panel entry system to aid and help the traders to make their trading decision. Unique Features of Trend Flasher 1
This indicator works on MT4 and is very easy to use. When you receive a signal from it, you wait for that candle with the signal to close and you enter your trade at the beginning of the next new candle . A red arrow means sell and a green arrow means buy. All arrows comes with Alert  like for easy identification of trade signal. Are you okay with that? 1 minute candle 1 minute expire
MT My Way
Issara Seeboonrueang
Best strategy,  Easy trade ,  Support of version update in the future MT My Way:  For new traders with no experience It is a very simple trade. Open the order when there is signal and close the order when there is exit or found the next opposite signal. You can set Stop Loss at the arrow and set the distance at Arrow Gap. For experienced traders, It will be very easy to trade. indicator for trade by yourself TRADE: Forex  TIME FRAME:  All Time Frame (Not M1) SYMBOL PAIR: All Sy
ABCD Harmonic Patterns
Mehmet Ozhan Hastaoglu
Thanks to this indicator, you can easily see the new ABCD harmonic patterns in the chart. If the two price action lengths are equal, the system will give you a signal when it reaches the specified level. You can set the limits as you wish. For example, You can get the signal of the price, which occurs in the Fibonaci 38.2 and 88.6 retracements, and then moves for the same length, at the level you specify. For example, it will alarm you when the price reaches 80% as a percentage. In vertic
Owl smart levels
Sergey Ermolov
4.34 (35)
MT5-Version  |  FAQ Der   Owl Smart Levels Indikator   ist ein komplettes Handelssystem innerhalb eines Indikators, der so beliebte Marktanalysetools wie die   fortschrittlichen Fraktale von Bill Williams , Valable ZigZag, das die   richtige Wellenstruktur   des Marktes aufbaut, und   Fibonacci-Levels , die die genauen Einstiegslevels markieren, enthält in den Markt und Orte, um Gewinne mitzunehmen. Detaillierte Strategiebeschreibung Anleitung zur Verwendung des Indikators Berater-Assistent im
CyberZingFx Trend Reversal
Afsal Meerankutty
4.18 (17)
Indicator captures the trend reversals with no-repaint Buy and Sell Arrow signals. CyberZingFx Trend Reversal Indicator - your go-to solution for accurate and reliable trend reversal signals. With its  advanced trading strategy , the indicator offers you Buy and Sell Arrow signals that do not repaint, making it a reliable tool for catching Swing Highs and Swing Lows in any market and any time frame. Indicator works on  any market  and  any time frames . __________________________________________
Super Reversal Pattern
Parfait Mujinga Ndalika
Super Reversal Pattern Indicator Unlock the power of advanced pattern recognition with our Super Reversal Pattern Indicator. Designed for traders seeking precision and reliability, this indicator identifies one of the most effective reversal patterns in technical analysis, offering a significant edge in your trading strategy. Key Features: Non-Repainting Accuracy: Enjoy the confidence of non-repainting technology. Once a Super Reversal Pattern is detected, it remains static, providing consis
Trend formation channel is a set of lines. The two central lines of the indicator represent moving averages of the specified type and period, they also form a small channel. The large channel is formed - the central lines of the indicator plus / minus the standard deviation estimate, multiplied by the coefficient selected by the user. The basic rule for plotting is that about 5% of prices should be outside these lines, and 95% - inside. If the price crosses the upper or lower line too often, th
The Sensitive Volume indicator is an indicator designed to generate trading signals. The purpose of this indicator is to generate signals from the highest probability of trading. Using a number of price movements and a set of indicator properties to generate these signals.  Easy to use, simple and understandable to the user. With alert features, user signals can be reached quickly.  Visually the user can easily recognize the signals. This indicator will not repaint. Parameters Trend_Period - p
Trend lines master
The Trading Team Ltd
5 (1)
Launch promotion For a limited time only:  30$ instead of 157$ Summary Create precise trend lines in a second Description This indicator will draw your trend lines automatically with great precision, saving you some precious time. It uses Bill Williams Fractals to identify the key points and draws both inner and outer trend lines. Features Automatically draws precise trend lines
POWER TO GET WEALTHY TRADING SYSTEMS.  NON REPAINT REVERSAL ARROW AND CHANNEL  Intra-Day trading and Scalping Strategy:   Designed for fast and accurate day trading and short-term trades. Day and Swing Trading Strategy:   Can be used as a reliable tool for day and swing traders who aim for the big moves of the price. Multi Currencies and Markets:   Works on different instruments and markets with its reliable precision. Multi Timeframes:   Can be used on multiple timeframes with good perfor
Marker Bands
Ramon Sobrevals Arce
4 (1)
This indicator consists in two different algorithms, in order to profit all fast movements created during noises of the market. First of all, it plots normalized trend bands to can filter the possible trades. The normalized trend bands are calcualted using an exclusive mathematical algorithm to has both the correct trend and the fast adaptability to the change of trends. With those bands you can know when you are inside the trend, or when you are outside. The second alhorithm uses a private
This is a new strategy for SUPPLY DEMAND areas It is based on a calculation using the tick volume to detect the big price action in market for both bear /bull actions this smart volume action candles are used to determine the supply and demand areas prices in between main supply and demand lines indicate sideway market  up arrows will be shown when prices moves above the main supply and the secondary supply lines Down arrows will be shown when prices moves below the main demand and the secondary
norepaint buy sell indicator is norepaint indicator.and works all pairs and all timeframes. Indicator hold too long way to signals. And show major and minor cycles.and gives signals Minor cycles are indicating with x signs. Major cycles are indicating big arrows. So 5m chart and 15m chart more suitable For major cycles, 1 h and 4h chart suitable for minor cycles. using is wery simple ,it puts arrow on price probably buy sell arrows. thise indicator is suitable for beginner and experienced trader
HMA Trend Professional MT4
Pavel Zamoshnikov
4.57 (7)
Improved version of the free HMA Trend indicator (for MetaTrader 4) with statistical analysis. HMA Trend is a trend indicator based on the Hull Moving Average (HMA) with two periods. HMA with a slow period identifies the trend, while HMA with a fast period determines the short-term movements and signals in the trend direction. The main differences from the free version: Ability to predict the probability of a trend reversal using analysis of history data. Plotting statistical charts for analyz
Trend Line Chart Pattern Signals  Is a traders Tool for Signals based on Strong  Patterns Formed By a pair of robust trend lines. They FOR WITH DIFFERENT POPULAR PATTERNS ON CHARTS LIKE – TRIANGLES, FLAGS,RANGE , ASCENDING TRIANGLES, DESCENDING PATTERNS, PENNANTS ETC. The TREND LINES  form  dynamically  on running bars. The  sensitivity  of the trend lines can be changed by custom settings. The  Buy and Sell Signals Generate upon Break Of the Trend Line + "Close" of the same bar above the previo
This indicator alerts you when/before new candle bar formed. In other words,this indicator alerts you every 1/5/30/60/240 minutes. This indicator is especially useful for traders who trade when new bars formed. *This indicator don't work propery in strategy tester.Use Free Version to check functionality in live trading. Input Parameters Alert_Or_Sound =Sound ----- Choose alert or sound or both to notify you when new bar is coming. Enable_1mBarAlert ----- Enable alert for 1 min bar dif
Engulfing Candle Hunter MT4
Odaine Ramon Mcmillan
1 (1)
The Game-Changing Engulfing Candle Hunter - Your Guide to Profitable Trend Trading Step into the realm of trading possibilities with our revolutionary product - The Engulfing Hunter. Designed by traders for traders, this dynamic indicator combines the potency of engulfing candlestick patterns and the versatility of proprietary trend detection system, offering a trading edge unlike any other. Engulfing candlestick patterns have always been a revered tool in the arsenal of seasoned traders. Actin
Fair value gap (FVG) = Imbalance zone Fair value gap Indicator MT4 is the most accurate and customizable indicator on the market. It was developed to facilitate the analysis of operations based on candlestick patterns and supply-demand zones. These zones are possible movement reversal points. For this indicator is generated by the order block of smart money concept. High Time Frame (HTF) To Find High Quality Order Block Low Time Frame (LTF) To Find a secure Entry W1 D1, H4 D1 H4, H1, M30 H4
Noize Absorption Index MT4
Ekaterina Saltykova
5 (1)
Noize Absorption Index - is the manual trading system that measures the difference of pressure between bears forces and bulls forces. Green line - is a noize free index that showing curent situation. Zero value of index shows totally choppy/flat market.Values above zero level shows how powerfull bullish wave is and values below zero measures bearish forces.Up arrow appears on bearish market when it's ready to reverse, dn arrow appears on weak bullish market, as a result of reverse expectation. S
Käufer dieses Produkts erwarben auch
Gann Made Easy
Oleg Rodin
4.85 (82)
Gann Made Easy ist ein professionelles und einfach zu bedienendes Forex-Handelssystem, das auf den besten Handelsprinzipien unter Verwendung der Theorie von Mr. basiert. W.D. Gann. Der Indikator liefert genaue KAUF- und VERKAUFSsignale, einschließlich Stop-Loss- und Take-Profit-Levels. Mit PUSH-Benachrichtigungen können Sie auch unterwegs handeln. Bitte kontaktieren Sie mich nach dem Kauf! Ich werde meine Handelstipps und tolle Bonusindikatoren kostenlos mit Ihnen teilen! Wahrscheinlich haben Si
- Real price is 80$ - 40% Discount ( It is 49$ now ) Contact me for instruction, add group and any questions! Related Product:  Bitcoin Expert , Gold Expert Introduction The breakout and retest strategy is traded support and resistance levels. it involves price breaking through a previous level.  The break and retest strategy is designed to help traders do two main things, the first is to avoid false breakouts. Many false breakouts start with a candlestick that breaks out of a level but ends wi
Atomic Analyst
Issam Kassas
5 (2)
Zunächst einmal ist es erwähnenswert, dass dieser Handelsindikator nicht neu malt, nicht neu zeichnet und keine Verzögerung aufweist, was ihn sowohl für manuellen als auch für Roboterhandel ideal macht. Benutzerhandbuch: Einstellungen, Eingaben und Strategie. Der Atom-Analyst ist ein PA-Preisaktionsindikator, der die Stärke und das Momentum des Preises nutzt, um einen besseren Vorteil auf dem Markt zu finden. Ausgestattet mit fortschrittlichen Filtern, die helfen, Rauschen und falsche Signale z
Scalper Inside PRO
Alexey Minkov
4.73 (56)
An exclusive indicator that utilizes an innovative algorithm to swiftly and accurately determine the market trend. The indicator automatically calculates opening, closing, and profit levels, providing detailed trading statistics. With these features, you can choose the most appropriate trading instrument for the current market conditions. Additionally, you can easily integrate your own arrow indicators into Scalper Inside Pro to quickly evaluate their statistics and profitability. Scalper Inside
Gold Stuff
Vasiliy Strukov
4.89 (239)
Gold Stuff-Ein Trendindikator, der speziell für Gold entwickelt wurde, kann auch auf allen Finanzinstrumenten verwendet werden. Der Indikator wird nicht neu gezeichnet und verzögert sich nicht. Empfohlener Zeitrahmen H1. Nach diesem Indikator geschrieben EA Gold Stuff Berater, können Sie es in meinem Profil finden. WICHTIG! Kontaktieren Sie mich sofort nach dem Kauf, um Anweisungen und Bonus zu erhalten!   Sie können eine kostenlose Kopie unseres Strong Support- und Trendscanner-Indikators
Derzeit 20% Rabatt! Die beste Lösung für jeden Neueinsteiger oder Expert Händler! Dieses Dashboard arbeitet mit 28 Währungspaaren. Es basiert auf 2 unserer Hauptindikatoren (Advanced Currency Strength 28 und Advanced Currency Impulse). Es bietet einen hervorragenden Überblick über den gesamten Forex-Markt. Es zeigt die Werte der Advanced Currency Strength, die Veränderungsrate der Währungen und die Signale für 28 Devisenpaare in allen (9) Zeitrahmen. Stellen Sie sich vor, wie sich Ihr Hande
Enigmera
Ivan Stefanov
5 (3)
ENIGMERA: Der Kern des Marktes https://www.enigmera.com Einführung Dieser Indikator und dieses Handelssystem sind ein bemerkenswerter Ansatz für die Finanzmärkte. ENIGMERA nutzt die fraktalen Zyklen zur genauen Berechnung von Unterstützungs- und Widerstandsniveaus. Er zeigt die echte Akkumulationsphase an und gibt Richtung und Ziele vor.  Ein System, das funktioniert, egal ob wir uns in einem Trend oder in einer Korrektur befinden.  Wie funktioniert es? ENIGMERA besteht aus drei Linien: der
TPSproTREND PrO
Roman Podpora
4.79 (19)
TPSpro TREND PRO   ist ein Trendindikator, der den Markt automatisch analysiert und Informationen über den Trend und jede seiner Änderungen liefert sowie Signale für den Einstieg in Geschäfte ohne Neuzeichnung gibt! Der Indikator verwendet jede Kerze und analysiert sie separat. bezieht sich auf verschiedene Impulse – Aufwärts- oder Abwärtsimpuls. Exakte Einstiegspunkte in Transaktionen für Währungen, Krypto, Metalle, Aktien, Indizes! Version MT5                   VOLLSTÄNDIGE BESCHREIBUNG DES
Dynamic Forex28 Navigator – Das Forex-Handelstool der nächsten Generation AKTUELL 49 % RABATT. Dynamic Forex28 Navigator ist die Weiterentwicklung unserer seit langem beliebten Indikatoren und vereint die Leistung von drei in einem: Advanced Currency Strength28 Indicator (695 Bewertungen) + Advanced Currency IMPULSE mit ALERT (520 Bewertungen) + CS28 Combo Signals (Bonus) Details zum Indikator https://www.mql5.com/en/blogs/post/758844 Was bietet der Strength Indicator der nächsten Generation?
Trend Punch
Mohamed Hassan
4.95 (19)
This indicator is unstoppable when combined with our other indicator called  Support & Resistance . After purchase, send us a message and you will get it   for  FREE as a BONUS! Introducing Trend Punch , the revolutionary forex trend indicator that will transform the way you trade! Trend Punch is uniquely designed to provide precise buy and sell arrows during strong market trends, making your trading decisions clearer and more confident. Whether you're trading major currency pairs or exotic sym
Trend Screener
STE S.S.COMPANY
4.8 (87)
Trendindikator, bahnbrechende, einzigartige Lösung für Trendhandel und -filterung mit allen wichtigen Trendfunktionen in einem Tool! Es handelt sich um einen 100 % nicht neu zu malenden Multi-Timeframe- und Multi-Währungs-Indikator, der für alle Symbole/Instrumente verwendet werden kann: Forex, Rohstoffe, Kryptowährungen, Indizes und Aktien. ZEITLICH BEGRENZTES ANGEBOT: Der Support- und Resistance-Screener-Indikator ist für nur 50 $ und lebenslang verfügbar. (Ursprünglicher Preis 250 $) (Angebot
FX Volume
Daniel Stein
4.58 (33)
Erhalten Sie Ihr tägliches Marktupdate mit Details und Screenshots über unser Morning Briefing hier auf mql5 und auf Telegram ! FX Volume ist der ERSTE und EINZIGE Volumenindikator, der einen ECHTEN Einblick in die Marktstimmung aus Sicht eines Brokers bietet. Es bietet fantastische Einblicke in die Positionierung von institutionellen Marktteilnehmern, wie z.B. Brokern, auf dem Forex-Markt, viel schneller als COT-Berichte. Diese Informationen direkt auf Ihrem Chart zu sehen, ist der wahre Game
TPSpro RFI Levels
Roman Podpora
4.82 (22)
ANWEISUNGEN    Russland -    ENG    Die Empfehlung basiert auf dem Indikator -   TPSpro   TREND PRO -   Version MT5 Die wichtigsten Elemente in der Branche sind entweder in Zonen oder in der Fabrik enthalten, oder sie führen zu einer Lösung bei einem Kauf oder dem Verkauf eines anderen Instruments. Wenn viele Menschen ihre Rechte nicht auf dem Händlerkonto verschlüsseln, werden die Folgen nicht schnell genug sein. Ich habe es damit abgeschlossen, dass ich diese Folgen nun noch interpretieren un
FX Power MT4 NG
Daniel Stein
5 (13)
Erhalten Sie Ihr tägliches Marktupdate mit Details und Screenshots über unser Morning Briefing hier auf mql5 und auf Telegram ! FX Power MT4 NG ist die nächste Generation unseres langjährig sehr beliebten Währungsstärkemessers FX Power. Und was bietet dieser Stärkezähler der nächsten Generation? Alles, was Sie am ursprünglichen FX Power geliebt haben PLUS GOLD/XAU-Stärkeanalyse Noch präzisere Berechnungsergebnisse Individuell konfigurierbare Analysezeiträume Anpassbares Berechnungslimit für noc
Zunächst einmal ist es wichtig zu betonen, dass dieses Handelstool ein Nicht-Repaint-, Nicht-Redraw- und Nicht-Verzögerungsindikator ist, was es ideal für professionelles Trading macht. Online-Kurs, Benutzerhandbuch und Demo. Der Smart Price Action Concepts Indikator ist ein sehr leistungsstarkes Werkzeug sowohl für neue als auch erfahrene Händler. Er vereint mehr als 20 nützliche Indikatoren in einem und kombiniert fortgeschrittene Handelsideen wie die Analyse des Inner Circle Traders und Stra
Ultimate Gold Advisor für MetaTrader 4 Der Ultimate Gold Advisor ist ein fortschrittliches technologisches Werkzeug, das entwickelt wurde, um das Handelserlebnis auf MetaTrader 4 zu optimieren. Es wurde entwickelt, um den Bedürfnissen erfahrener Trader gerecht zu werden. Dieser Indikator kombiniert Präzision, anspruchsvolle Analysen und vielseitige Funktionalität, um informierte Handelsentscheidungen zu unterstützen. Ideal für den Goldhandel, aber auch auf eine Vielzahl von Vermögenswerten anwen
Stratos Pali
Michela Russo
5 (1)
Stratos Pali Indicator   is a revolutionary tool designed to enhance your trading strategy by accurately identifying market trends. This sophisticated indicator uses a unique algorithm to generate a complete histogram, which records when the trend is Long or Short. When a trend reversal occurs, an arrow appears, indicating the new direction of the trend. Important Information Revealed Leave a review and contact me via mql5 message to receive My Top 5 set files for Stratos Pali at no cost! D
Legacy of Gann
Pavel Zamoshnikov
4.83 (12)
The indicator very accurately determines the levels of the possible end of the trend and profit fixing. The method of determining levels is based on the ideas of W.D.Gann, using an algorithm developed by his follower Kirill Borovsky. Extremely high reliability of reaching levels (according to K. Borovsky  - 80-90%) Indispensable for any trading strategy – every trader needs to determine the exit point from the market! Precisely determines targets on any timeframes and any instruments (forex, met
Gold Channel is a volatility-based indicator, developed with a specific timing algorithm for the XAUUSD pair, which consists of finding possible corrections in the market. This indicator shows two outer lines, an inner line (retracement line) and an arrow sign, where the theory of the channel is to help identify overbought and oversold conditions in the market. The market price will generally fall between the boundaries of the channel. If prices touch or move outside the channel it is a tra
Currency Strength Wizard ist ein sehr leistungsstarker Indikator, der Ihnen eine Komplettlösung für erfolgreichen Handel bietet. Der Indikator berechnet die Stärke dieses oder jenes Forex-Paares anhand der Daten aller Währungen in mehreren Zeitrahmen. Diese Daten werden in Form von benutzerfreundlichen Währungsindizes und Währungsstärkelinien dargestellt, anhand derer Sie die Stärke dieser oder jener Währung erkennen können. Sie müssen lediglich den Indikator an das Diagramm anhängen, mit dem Si
GOLD Impulse with Alert
Bernhard Schweigert
4.56 (9)
Dieser Indikator ist eine hervorragende Kombination aus unseren 2 Produkten Advanced Currency IMPULSE with ALERT  +   Currency Strength Exotics . Es funktioniert für alle Zeitrahmen und zeigt grafisch Impulse der Stärke oder Schwäche für die 8 wichtigsten Währungen plus ein Symbol! Dieser Indikator ist darauf spezialisiert, die Beschleunigung der Währungsstärke für beliebige Symbole wie Gold, Exotische Paare, Rohstoffe, Indizes oder Futures anzuzeigen. Als erster seiner Art kann jedes Sym
Scalper Vault
Oleg Rodin
5 (27)
Scalper Vault ist ein professionelles Scalping-System, das Ihnen alles bietet, was Sie für erfolgreiches Scalping benötigen. Dieser Indikator ist ein komplettes Handelssystem, das von Forex- und Binäroptionshändlern verwendet werden kann. Der empfohlene Zeitrahmen ist M5. Das System liefert Ihnen genaue Pfeilsignale in Richtung des Trends. Es liefert Ihnen auch Top- und Bottom-Signale und Gann-Marktniveaus. Die Indikatoren bieten alle Arten von Warnungen, einschließlich PUSH-Benachrichtigungen.
Market Structure
Reza Aghajanpour
4.85 (26)
** All Symbols x All Timeframes scan just by pressing scanner button ** *** Contact me  to send you instruction and add you in "Market Structure group" for sharing or seeing experiences with other users. Introduction: Market structure is important for both new and professional traders since it can influence the liquidity and price action of a market (Breakout and Retest). It’s also one of the most commonly used techniques to understand trends, identify potential reversal points, and get a feel f
Matrix Arrow Indicator MT4
Juvenille Emperor Limited
5 (3)
Matrix Arrow Indicator MT4 ist ein einzigartiger 10-in-1-Trend, der zu 100 % nicht neu gezeichnet werden kann. Multi-Timeframe-Indikator, der für alle Symbole/Instrumente verwendet werden kann: Forex, Rohstoffe, Kryptowährungen, Indizes, Aktien. Der Matrix Arrow Indicator MT4 wird den aktuellen Trend in seinen frühen Stadien bestimmen und Informationen und Daten von bis zu 10 Standardindikatoren sammeln, die sind: Durchschnittlicher Richtungsbewegungsindex (ADX) Rohstoffkanalindex (CCI) Klassis
IX Power MT4
Daniel Stein
5 (5)
IX Power bringt die unschlagbare Präzision von FX Power endlich auch zu Nicht-Forex-Symbolen. Es bestimmt präzise die Intensität von kurz-, mittel- und langfristigen Trends in Ihren Lieblingsindizes, Aktien, Rohstoffen, ETFs und sogar Kryptowährungen. Sie können alles analysieren, was Ihr Terminal zu bieten hat. Probieren Sie es aus und erleben Sie, wie sich Ihr Timing beim Handel deutlich verbessert . IX Power Hauptmerkmale 100% präzise, nicht nachpinselnde Berechnungsergebnisse - für
DERZEIT 31% RABATT! Die beste Lösung für jeden Newbie oder Expert Trader! Dieser Indikator ist ein einzigartiges, qualitativ hochwertiges und erschwingliches Handelsinstrument, da wir eine Reihe von proprietären Funktionen und eine geheime Formel eingebaut haben. Mit nur EINEM Chart liefert er Alerts für alle 28 Währungspaare. Stellen Sie sich vor, wie sich Ihr Handel verbessern wird, weil Sie in der Lage sind, den genauen Auslösepunkt eines neuen Trends oder einer Scalping-Gelegenheit zu e
Hinterlassen Sie nach dem Kauf einen Kommentar, um 4 hochwertige Indikatoren als Bonus zu erhalten. Der Chart Patterns All-in-One Indikator hilft Tradern, verschiedene Chartmuster, die häufig in der technischen Analyse verwendet werden, zu visualisieren. Dieser Indikator unterstützt die Identifizierung möglicher Marktbewegungen, garantiert jedoch keine Rentabilität. Es wird empfohlen, den Indikator vor dem Kauf im Demomodus zu testen. Aktuelles Angebot : 50 % Rabatt auf den "Chart Patterns All i
Blahtech Supply Demand
Blahtech Limited
4.61 (33)
Was: $299  Now: $99   Supply Demand uses previous price action to identify potential imbalances between buyers and sellers. The key is to identify the better odds zones, not just the untouched ones. Blahtech Supply Demand indicator delivers functionality previously unavailable on any trading platform. This 4-in-1 indicator not only highlights the higher probability zones using a multi-criteria strength engine, but also combines it with multi-timeframe trend analysis, previously confirmed swings
AW Prime Oscillator
AW Trading Software Limited
5 (1)
Eine Kombination aus zwei Oszillatoren. Der erste zeigt die Einstiegspunkte an, der zweite zeigt den aktuellen Trend. Der Indikator kann Oszillatorsignale durch Pfeile in zwei Modi anzeigen: alle schnellen Oszillatorsignale oder Signale nur in der Richtung des aktuellen Trends. Es verfügt über ein Multi-Timeframe-Panel und drei Arten von Signalbenachrichtigungen. Vorteile: Geeignet für Day- und Scalping-Handel Trendfilterung Einfache und sensible Einrichtung Panel mit mehreren Zeitrahmen Geeign
Weitere Produkte dieses Autors
SFT Full OsMA
Artem Kuzmin
4 (1)
A classic indicator with advanced features for more accurate display of the market situation. All settings of all moving averages are available, such as the moving average type and the priced used in its calculation. It is also possible to change the appearance of the indicator - line or histogram. Additional parameters provide the ability of fine tuning. Distinctive features Does not redraw. Additional parameters for fine tuning. Displayed as a line or as a histogram. Works on all timeframes
FREE
A new interpretation of the classical indicator in the form of an oscillator for a more accurate representation of the situation on the market. Less lagging than the standard Alligator. All settings are fully accessible, such as the type and prices for which it is built. Thanks to the additional parameters, it became possible to fine tune. Distinctive features Does not redraw. Additional parameters for fine tuning. Works on all timeframes and symbols. Suitable for manual trading and developm
FREE
The support and resistance levels are among the main components of the entire technical analysis. They are used both by professional traders and by beginners. Prices usually move within the price channels. The upper boundary of such a channel is called resistance, and the lower one is support. This indicator plots fractal support and resistance lines at the highest and lowest local price values (fractals). Distinctive features Does not redraw. Clear and understandable signals. It is possible t
Opening positions in the direction of the trend is one of the most common trading tactics. The main idea is that the probability of the trend continuation is higher than that of its change. This indicator determines the direction of a local movement, marking the beginning of a trend with a large dot and its continuation with a line of the corresponding color. Distinctive features No Repaint. Simple and accurate settings. Clear and understandable signals. Works on all timeframes and symbols. Su
This highly informative indicator applies overbought/oversold levels for more accurate representation of the market situation. It is also possible to change the appearance of the indicator - line or histogram. Additional parameters enable more fine-tuning, while trading can be inside the channel and along a trend. Distinctive features Oversold/overbought levels; Does not redraw. Displayed as a line or a histogram; Works on all timeframes and symbols. Suitable for manual trading and developmen
MACD indicator with overbought and oversold zones. Two display options - classic lines and a histogram. Can be used to detect a possible reversal or pullback in price, as well as for channel strategies All settings are simple and straightforward - all like a standard indicator, but with additional support and resistance levels Can be used both separately and together with other indicators
Awesome oscillator with overbought and oversold zones. A series of OBS indicators (overbought and oversold) - these are indicators enhanced with overbought and oversold zones. This makes it possible to determine when the instrument is trending, as well as when it is flat. Works on all timeframes, all currency pairs, metals and cryptocurrencies. Can be used with binary options. Settings OBS Period - period of overbought and oversold calculation
Accelerator indicator with overbought and oversold zones. A series of OBS indicators (overbought and oversold) - these are indicators enhanced with overbought and oversold zones. This is the standard indicator, but it provides additional possibilities for the analysis of any market. Thanks to a special algorithm, this indicator has overbought zones =70 and =100, as well as oversold zones -70 and -100, which allows you to use it to determine the possible reversal or pullback of the price, as well
The Bears indicator with overbought and oversold zones. Two display options - as a line and as a histogram.  A series of OBS indicators (overbought and oversold) - these are indicators enhanced with overbought and oversold zones. This is the standard indicator, but it provides additional possibilities for the analysis of any market. Thanks to a special algorithm, this indicator has overbought zones =70 and =100, as well as oversold zones -70 and -100, which allows you to use it to determine the
Bulls indicator with overbought and oversold zones. Two display options - as a line and as a histogram. OBS (overbought and oversold) indicator series - are indicators that have been provided with overbought and oversold zones. This is the standard indicator, but it provides additional possibilities for the analysis of any market. Thanks to a special algorithm, this indicator has overbought zones =70 and =100, as well as oversold zones -70 and -100, which allows you to use it to determine the p
The Force Index indicator with overbought and oversold zones. Two display options - as a line and as a histogram.  A series of OBS indicators (overbought and oversold) - these are indicators enhanced with overbought and oversold zones. Settings OBS Period - overbought/oversold calculation period Force Period - period of Force Price MA - prices for MA calculation Method MA - MA calculation method Line or Histo - display by line or histogram
Multicurrency indicator Any chart obs is a price chart with a percentage scale. Can be displayed as a line and as a histogram. There is also a reverse function available, it mirrors the chart. The name of an instrument to be displayed is specified in the input parameters, the current symbol is used on default. The indicator doesn't have lags as it is not smoothed with any formulas, but bound to a percentage scale, what allows detecting the price equilibrium, the overbought and oversold state. Th
The Accumulation indicator with overbought and oversold zones. Two display options - as a line and as a histogram.  A series of OBS indicators (overbought and oversold) - these are indicators enhanced with overbought and oversold zones.  Simple and straightforward settings that are easy to match to the right tool In the indicator, you can adjust: Display depth of the indicator Color of indicator levels
The indicator gives signals on trend reversal or the possible direction of price movement when leaving the flat movement. Features and settings: Sensitivity = 3 - sensitivity from 1 to 5; the higher the value, the more signals (example displayed in the screenshot below). DeepBars = 3000 - indicator display depth. ZeroBarCalc = false - use a zero bar in the calculations; if yes, the signal will appear earlier, but it may disappear before the current candlestick is closed. UseAlert = false - e
The indicator calculates critical price levels. If the level is red, the price has passed it downwards; if the level is blue, the price has passed it upwards. If the price is approaching the blue level from below, that level will most probably be broken through. If the price is approaching it from above, there will most probably be a rollback. Similarly, if the price is approaching the red level from above, the level will most probably be broken through. If the price is approaching it from below
The indicator is based on pair trading methods. It is not redrawn unlike similar indicators. Shows correlation between two selected instruments in percent for a predetermined period, and the positions of the instruments relative to each other. Has a function for reverse display of any of the analyzed symbols - for instruments with negative correlation. Can be drawn as a line or as a histogram. Settings: Symb1 - first symbol name. Revers1 - reverse display of the first symbol. Symb2 - second symb
An indicator for entering with trend and timely exiting. It has sensitivity setting, by adjusting which it can be applied to both long-term and short-term speculation.  The highest sensitivity = 1, with this setup, you can even scalp on M1. No lag, does not withdraw after candlestick closure.  One of the use options: enter after a candlestick closes, if the vertical line consists of squares of the same color; exit if the color of two or more squares changes. Before using it, be sure to analyze t
The indicator builds fractals on extrema of the OsMA indicator Appears on the chart as a fractal or a fractal channel. It has a flexible setting and, in contrast to the standard fractals, lags only by 1 bar. Settings: DeepBars - the indicator's depth of display; Sensitivity_1_or_2 - 1 - for small periods of OsMA, 2 - for large periods; Arrow_or_channel - display on the chart fractals or channel; FastMA - period of the fast moving average;  SlowMA - period of slow moving average;  SignalSMA -
This is an indicator for additional signal filtering. It can be used as an additional filter in a trading system. The indicator does not redraw its data and can be used both in forex trading and with binary options. It has 3 operation modes and flexible sensitivity settings. The indicator uses multiple buffers, therefore it can be easily used in various Expert Advisors.
Flat Factor
Artem Kuzmin
5 (1)
The indicator is designed for visual determining market directions. It allows to determine the distance from a price and helps in drawing correct conclusions. Perfectly defines flat zones, horizontal intraday trends and trend movements, and an additional setting allows to use the indicator on any instrument. Does not redraw its readings. You get professional trading indicator for a reasonable price. Settings: Period_FF = 7 - indicator period Sensitivity_FF = 5 - sensitivity in % Wish you all s
The indicator colors bars displaying prices of overbought and oversold areas on the chart. It will help you to estimate moments when market climate changes and the price has its local extreme values. It can be used both independently and as a good supplement to any channel trading system. And this indicator is easy-to-use in expert advisors due to usage of indicator buffers instead of graphical objects. Settings ExtPeriod = 100 — indicator period; Sensitivity = 80 — indicator sensitivity.
This is a moving average which can move not only to the right/left, but also up/down. You can also select a mode of displaying the indicator (as a line or as dots) and all other settings of a standard moving average. If you overlay several indicators in one window, you can clearlier determine price channels setting each border individually. Settings Line_or_Dot - mode of displaying the indicator: true - as a line, false - as dots; MA_period - moving average period; MA_shift_X - number of candl
Alarm arrow indicator of increased sensitivity After closing the candle the arrows do not disappear Allows you to enter the transaction on time at the lowest price movements Can be used on any currency pairs, metals and cryptocurrency Suitable for working with binary options Distinctive features Does not redraw; Determines the price correction; Advanced settings for fine tuning; Works on all timeframes and on all symbols; Suitable for trading currencies, metals, options and cryptocurrency (Bitco
A classic indicator with advanced features for more accurate display of the market situation. All settings of all moving averages are available, such as the moving average type and the priced used in its calculation. It is also possible to change the appearance of the indicator - line or histogram. Additional parameters provide the ability of fine tuning. Distinctive features Does not redraw. Additional parameters for fine tuning. Displayed as a line or as a histogram. Works on all timeframes
This highly informative indicator applies overbought/oversold levels for more accurate representation of the market situation. All moving average settings are available, including average type and price it is based on. It is also possible to change the appearance of the indicator - line or histogram. Additional parameters enable more fine-tuning, while trading can be inside the channel and along a trend. Distinctive features Oversold/overbought levels; Does not redraw. Additional parameters fo
Arrow indicator, to determine adjustments and local trends The arrow appears on the current bar and after closing the bar will not disappear. Allows you to enter the transaction at the very beginning of the movement Thanks to the flexible settings you can use on any currency pairs, metals and cryptocurrency Can be used when working with binary options Distinctive features Does not redraw. Additional parameters for fine tuning. Works on all timeframes and symbols. Suitable for trading c
Opening positions in the direction of the trend is one of the most common trading tactics. This indicator determines the direction of the local movement and colors the candles on the chart in the appropriate color. Allows you to enter the transaction at the very beginning of the movement Thanks to the flexible settings you can use on any currency pairs, metals and cryptocurrency Can be used when working with binary options Distinctive features Does not redraw. Additional parameters for
One of the main components of successful trading is the correct determination of the direction of the market. This indicator shows the general directionality of the price movement and is painted in the corresponding color. Allows you to conduct trend and counter trend trading It works on all timeframes, on any currency pairs, metals and cryptocurrency Can be used when working with binary options Distinctive features Does not redraw; Simple and clear settings; Works on all timeframes and symbo
Arrow indicator, for determining price reversals Arrow appears on the closed bar Allows you to enter the transaction at the very beginning of the turn Can be used on any currency pairs, metals and cryptocurrency Suitable for working with binary options Distinctive features Determines the price correction; Advanced settings for fine tuning; It works on all timeframes and on all symbols; Suitable for trading currencies, metals, options and cryptocurrency (Bitcoin, Litecoin, Ethereum, etc.) Suita
Auswahl:
Keine Bewertungen
Antwort auf eine Rezension
Version 1.1 2022.04.29
Improved code
Compiled in the new build