Advanced Info Displayer mt5
- Utilitys
- Massimiliano Pirola
- Version: 1.10
- Aktualisiert: 16 August 2018
- Aktivierungen: 10
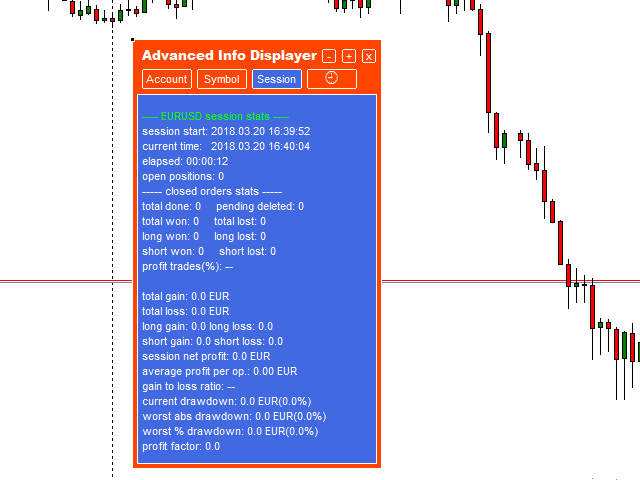
- Would you like to have statistics about your trades displayed while you operate?
- Have you a solid understanding of the symbol you are trading?
- Do you really know everything you need to about your trading account?
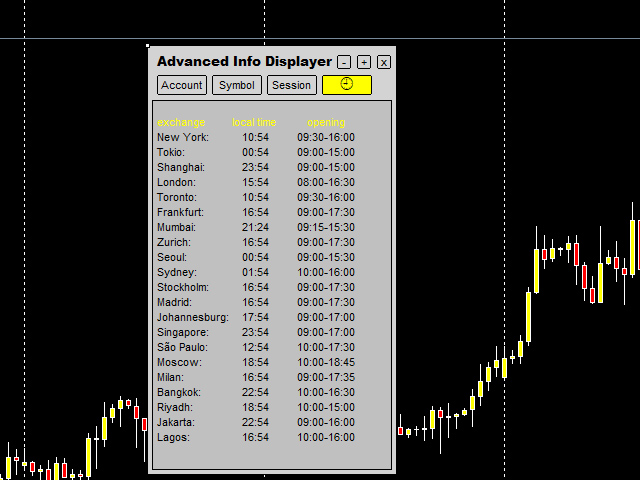
- Do you need to keep an eye on the local times around the world?
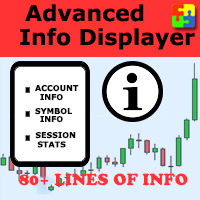
Advanced Info Displayer answers to all that.
It helps you to know many hidden or hard to find data. Also, it is very convenient if you value statistics and maths.
Just to exemplify, in more than 80 lines of information you will find:
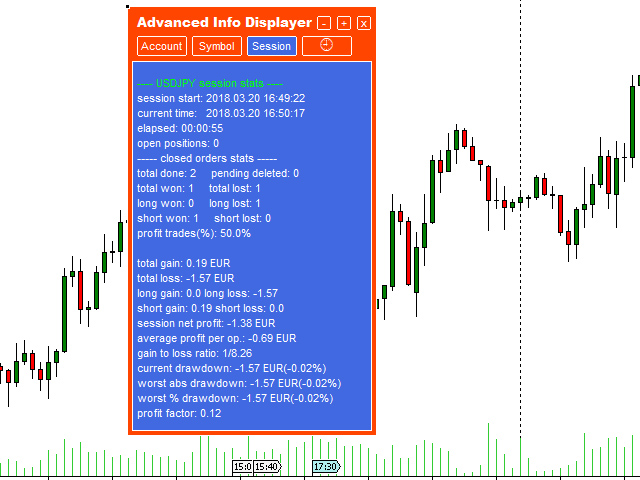
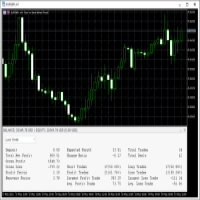
- (Session) net profit, profit factor, profit trades(%), average profit per operation, absolute drawdown, relative drawdown, etc.
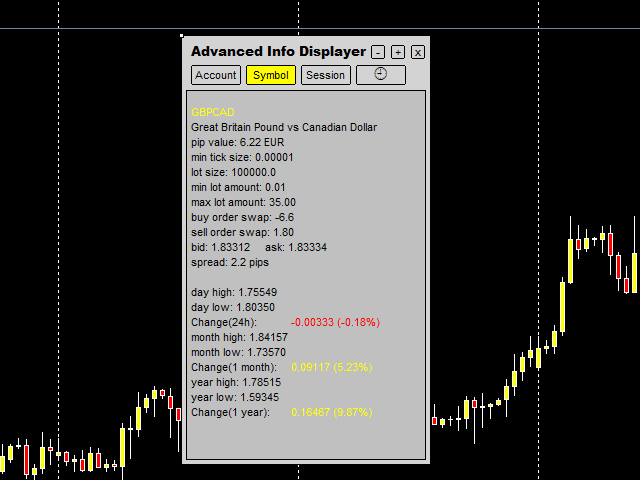
- (Symbol) pip value, tick size, min lot size, max lot size, change (24h), change (1 month), change (1 year), day high, day low, month high, month low, etc.
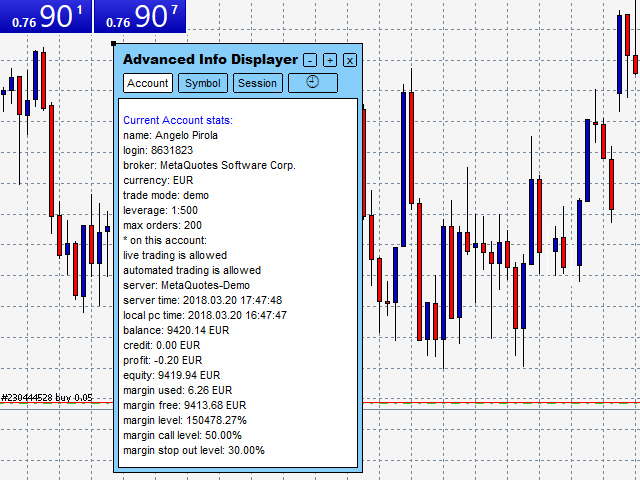
- (Account) leverage, max orders, permission to use expert advisors, server time, margin used, margin free, margin call level, stop out level, etc.
All of that is displayed in a customizable window you can move around and minimize to you liking.
Please note that if you change period, your session stats will be lost. Therefore, if you need to elaborate statistics on, for example, EURUSD M1 and EURUSD H4, you must open those 2 chart windows, place the indicator on one of them, and set input value "compute_only_current_chart_stats" to false.
Inputs
- compute_only_current_chart_stats: if true, statistics are elaborated computing only the orders of the chart the indicator is running on. Otherwise computing any orders.
- panel_starting_position: the position where the panel is initially created.
- font_type: font type. Only Arial is selectable.
- font_color: font color.
- background_color: color of the outer panel.
- background_color_2: color of the inner panel.
- selected_button_color: selected button color.
- UP_color: color of uptrend data and of the headers of the paragraphs.
- DOWN_color: color of downtrend data.
- display_data_in_background: if false the panel will cover the candles/bars.
- clear_chart_on_exit: if true when you close the indicator, the panel disappears. Otherwise it stays (useful in case of backtesting).
