Dashboard RSI Multicurrency
- Indikatoren
- Taras Slobodyanik
- Version: 5.50
- Aktualisiert: 28 Oktober 2024
- Aktivierungen: 10
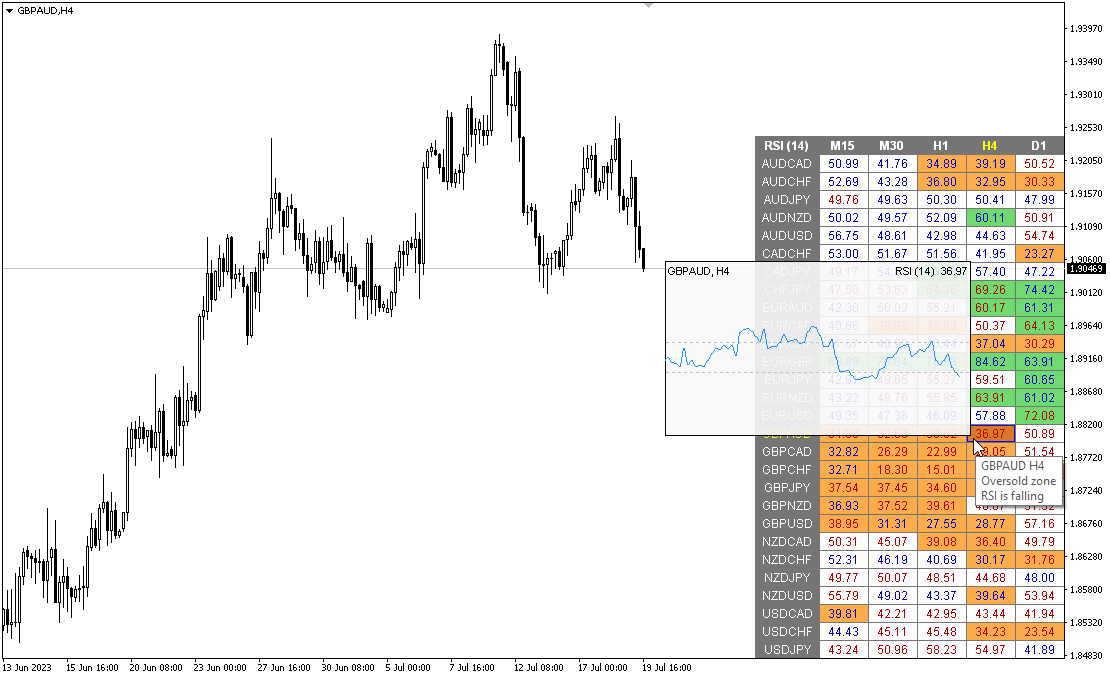
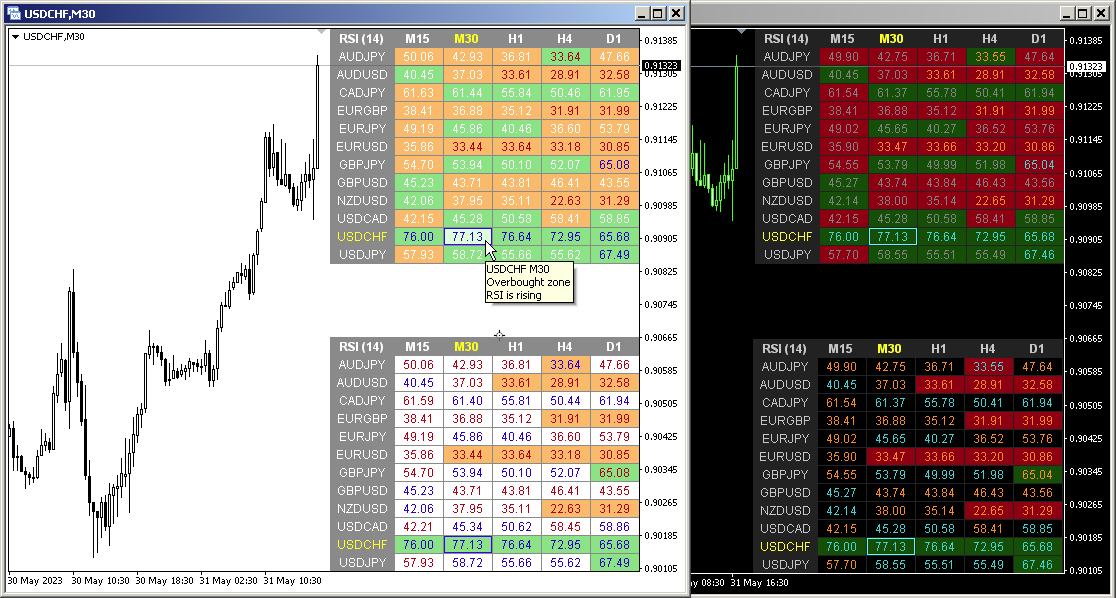
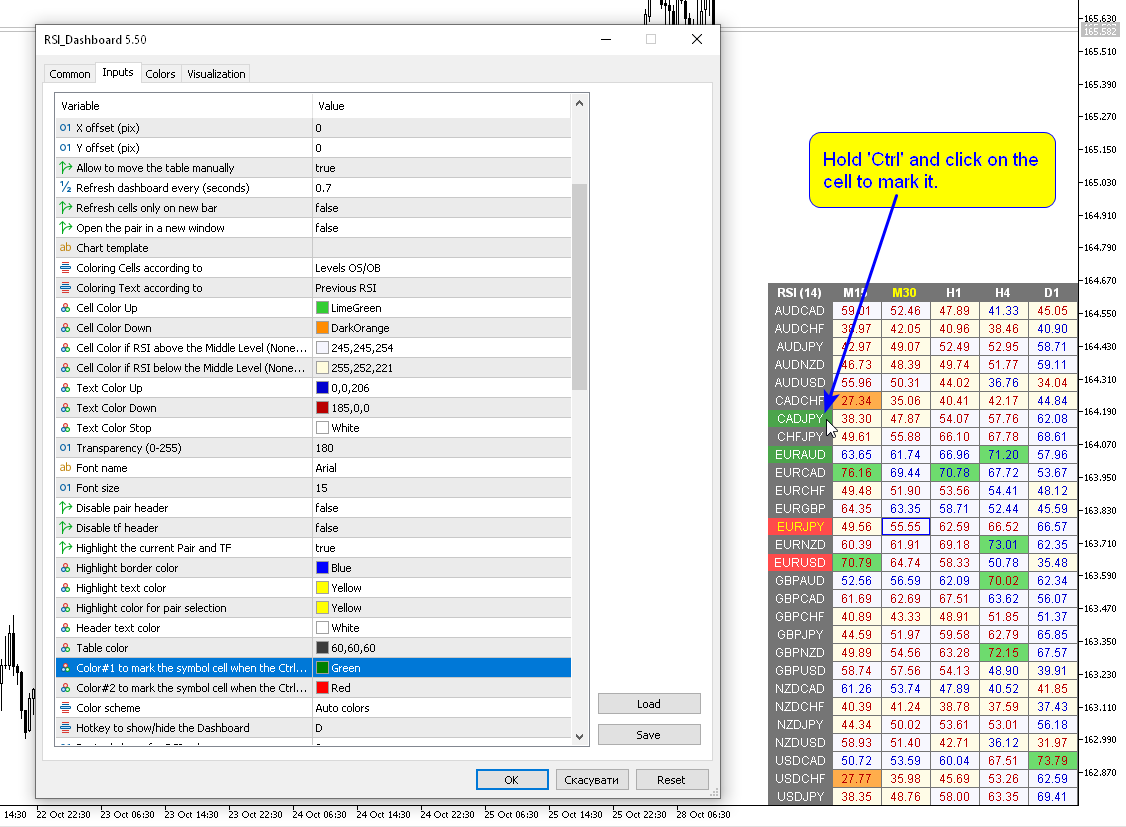
Modifikation des Relative Strength Index (RSI)-Indikators für mehrere Währungen und mehrere Zeitrahmen. Sie können in den Parametern alle gewünschten Währungen und Zeitrahmen angeben. Außerdem kann das Panel Benachrichtigungen senden, wenn überkaufte und überverkaufte Niveaus überschritten werden. Durch Klicken auf eine Zelle mit einem Punkt werden dieses Symbol und dieser Punkt geöffnet. Dies ist der MTF-Scanner.
Die Taste zum Ausblenden des Dashboards aus dem Diagramm ist standardmäßig „D“.
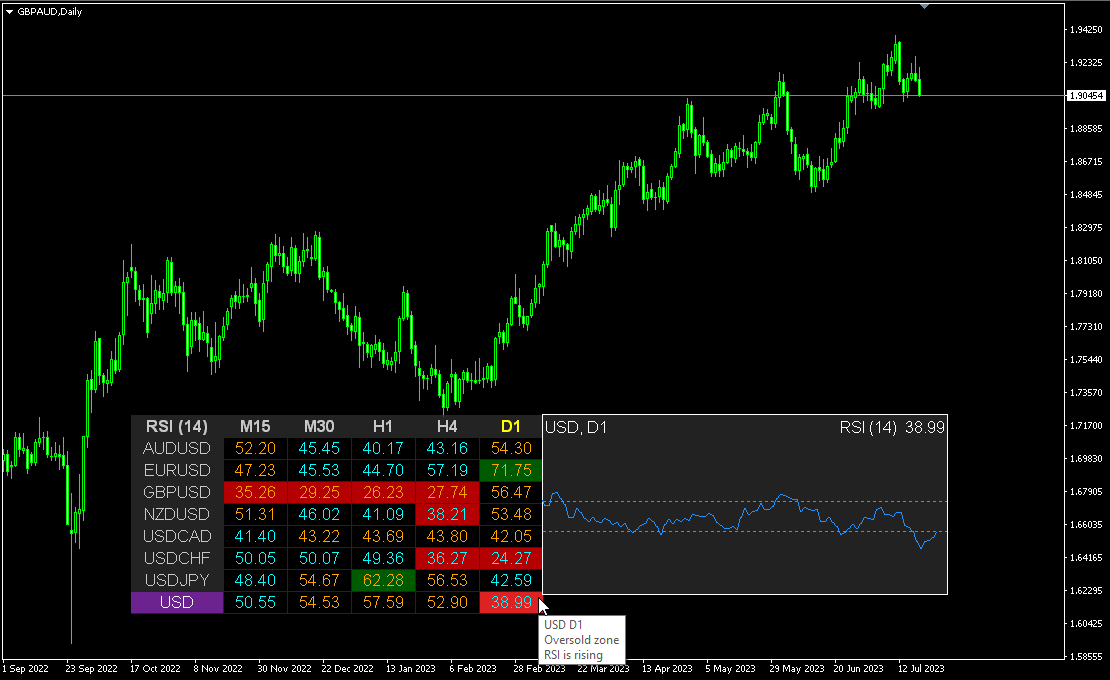
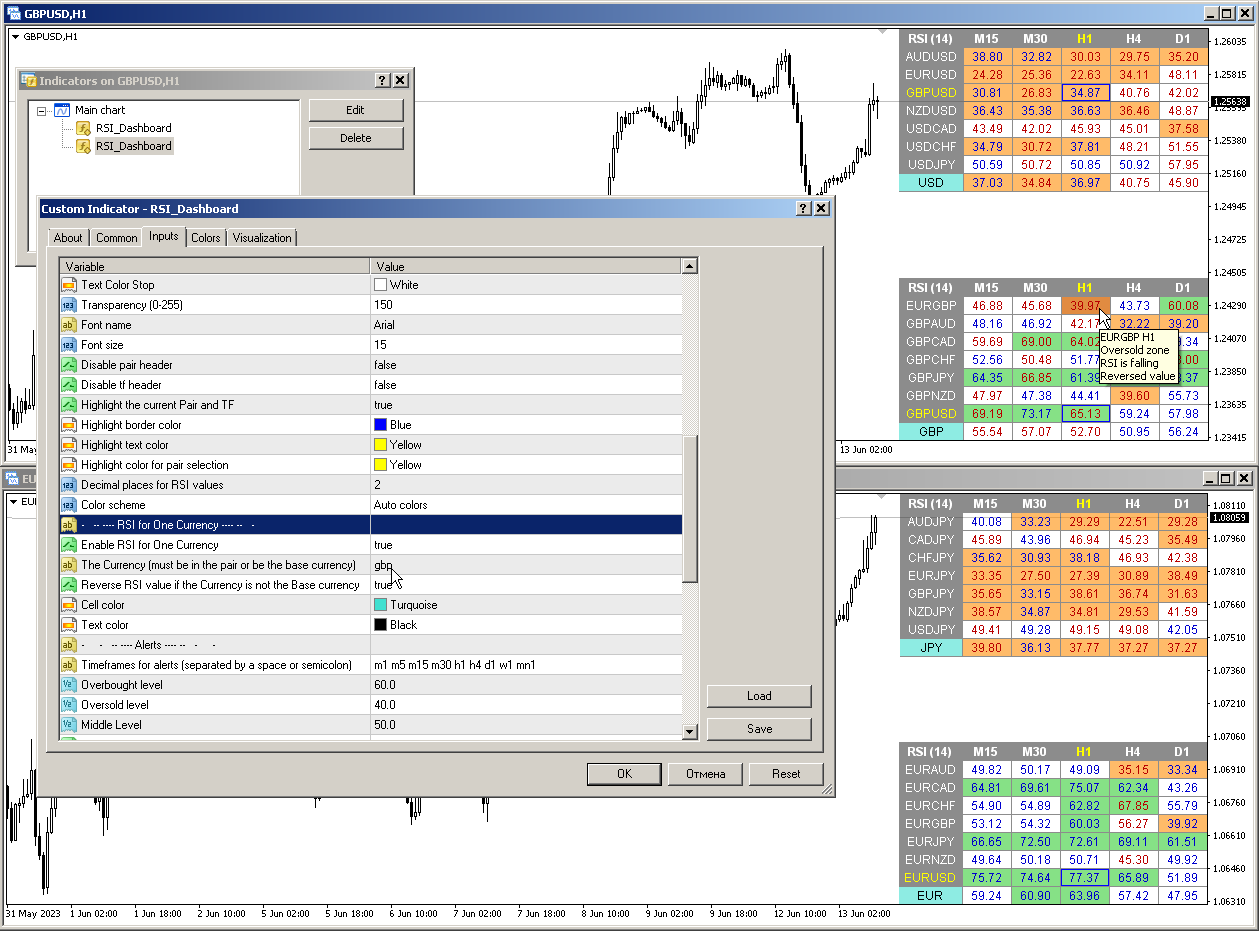
Ähnlich wie der Currency Strength Meter (CSM) kann das Dashboard automatisch Paare auswählen, die eine bestimmte Währung enthalten, oder Paare, die diese Währung als Basiswährung haben. Der Indikator sucht in allen Paaren, die im „Paarsatz“ angegeben sind, nach Währungen; andere Paare werden ignoriert. Und basierend auf diesen Paaren wird der Gesamt-RSI für diese Währung berechnet. Und Sie können sehen, wie stark oder schwach diese Währung ist.
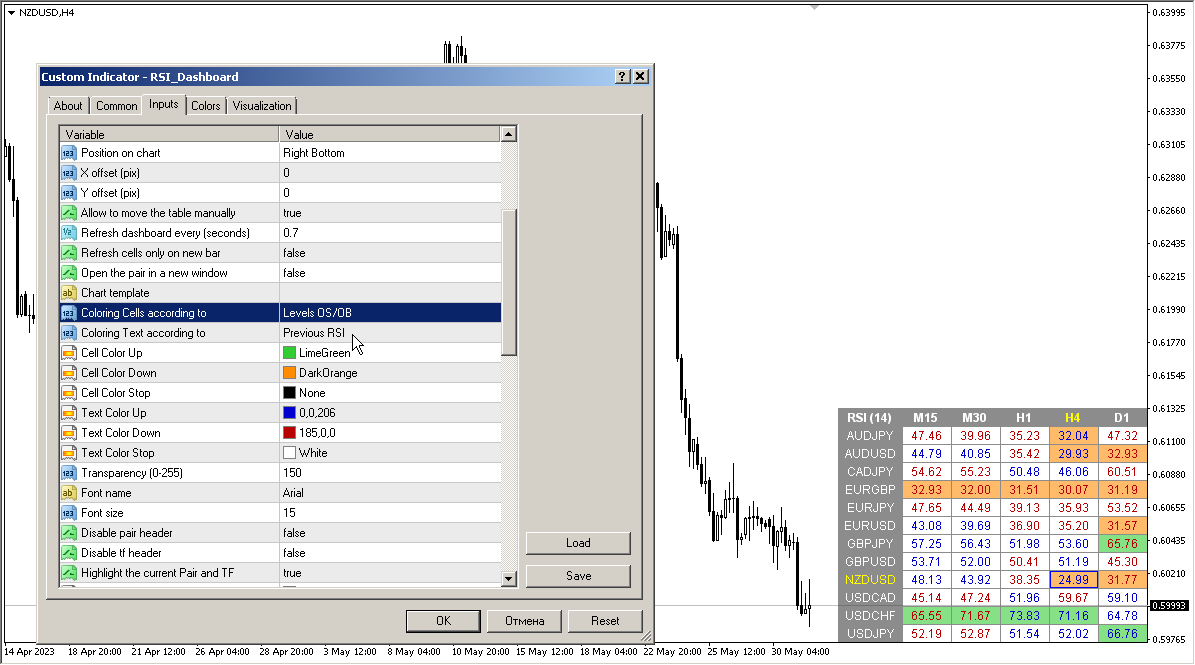
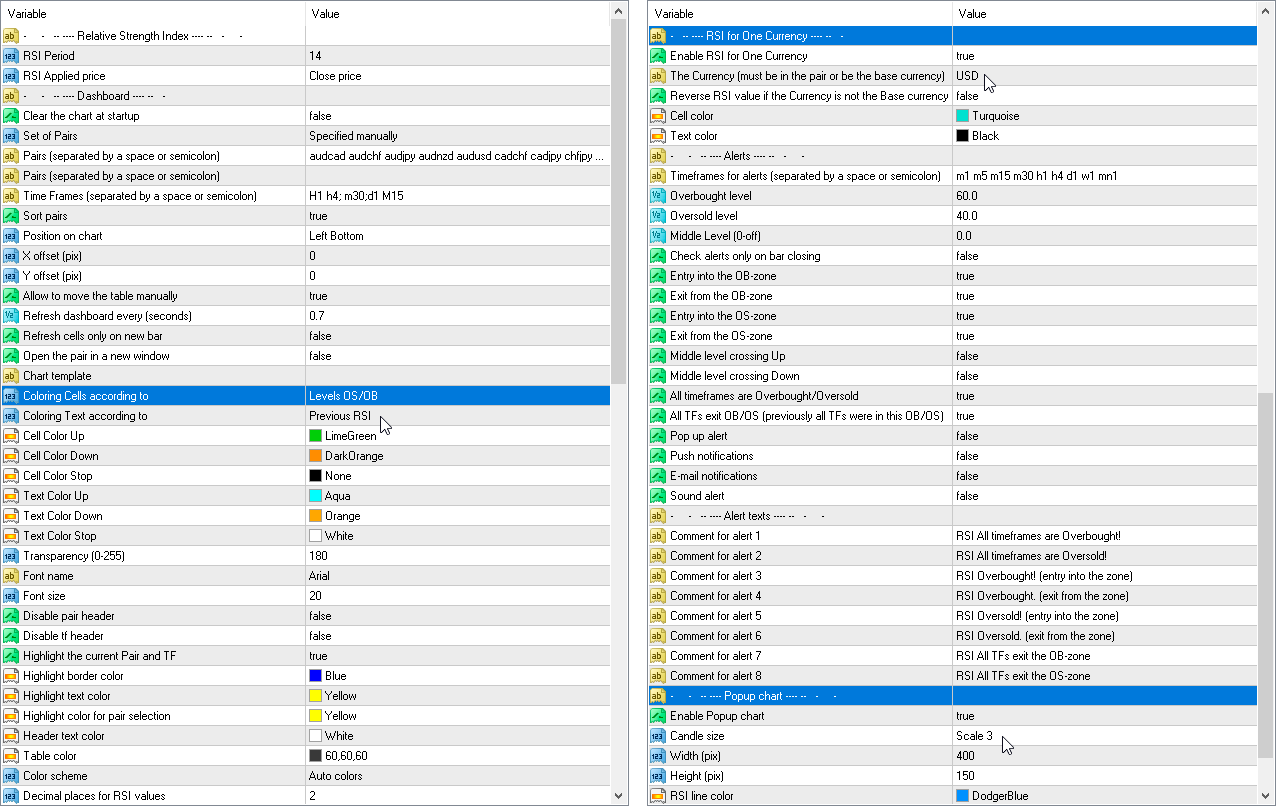
Parameter
RSI Period — Durchschnittszeitraum.
RSI Applied price — Preistyp.
Clear the chart at startup — Diagramm beim Start löschen.
Set of Pairs — Symbolsatz
— Market Watch — Paare aus der „Marktübersicht“.— Specified manually — Paare, die manuell in den Parametern „Paare“ angegeben wurden.— Current pair — zeigt nur das aktuelle Paar.
Pairs (separated by a space or semicolon) — Liste von Symbolen, getrennt durch Leerzeichen oder Semikolon. Die Währungsnamen sollten genau wie die des Brokers geschrieben werden, Groß- und Kleinschreibung sowie Präfix/Suffix sollten beibehalten werden.
Time Frames (separated by a space or semicolon) — Liste von Zeitrahmen, getrennt durch Leerzeichen oder Semikolon (mehrere Zeitrahmen).
Sort pairs — Sortierung der Liste von Paaren.
Position on chart — Ecke, um das Panel auf dem Diagramm anzuzeigen.
X offset (pix) — verschiebt das Panel entlang der X-Achse;
Y offset (pix) — verschiebt das Panel entlang der Y-Achse;
Refresh dashboard every (seconds) — Aktualisierungszeitraum für alle Paare und Zeitrahmen.
Refresh cells only on new bar — Zellaktualisierungen (und Warnungen) erfolgen nur, wenn ein neuer Balken erscheint.
Open the pair in a new window — öffnet ein Symbol in einem neuen Chartfenster durch Klicken.
Chart template — Name der Vorlage für das Chart, wenn das Chart in einem neuen Fenster geöffnet wird.
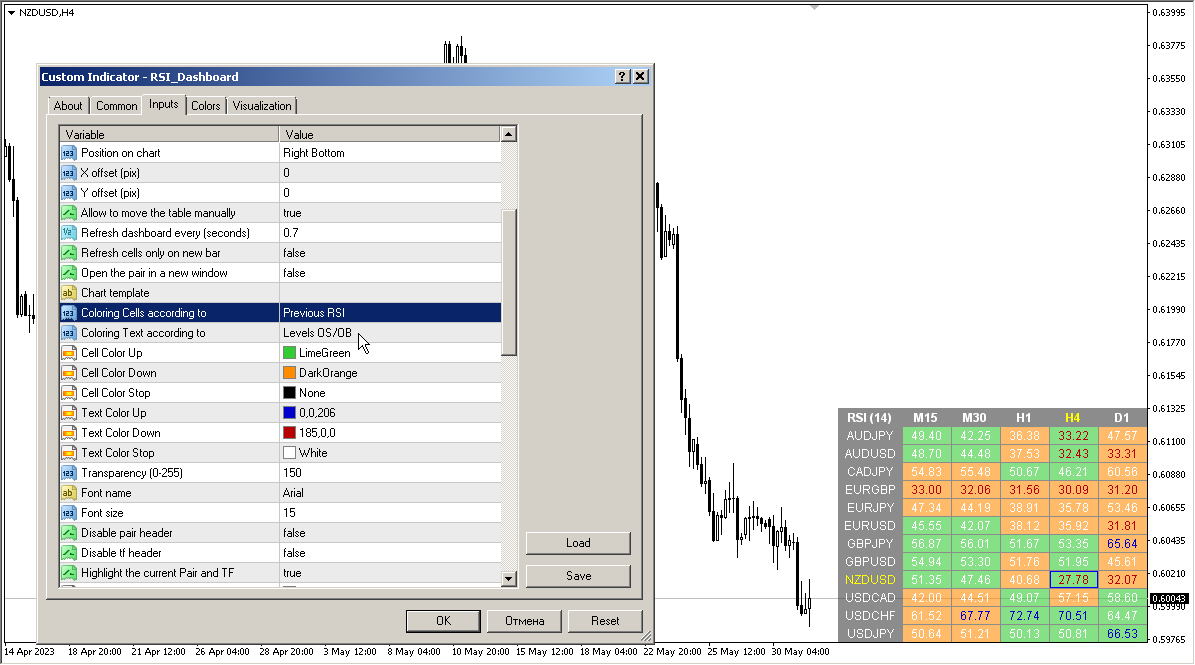
Coloring the cells according to the — malt die Zellen der Tabelle gemäß den Überkaufs-/Überverkaufsniveaus oder gemäß der Richtung der vorherigen Kerze.
Color Up — Zellenfarbe, wenn der Indikator steigt.
Color Down — Zellenfarbe, wenn der Indikator fällt.
Color Stop — Zellenfarbe, wenn sich der Indikator nicht ändert.
Transparency (0-255) — Transparenz des Panels.
Font name — Schriftname.
Font size — Schriftgröße.
Warnungen
Timeframes for alerts (separated by a space or semicolon) — Liste der Zeiträume, für die die Warnung gesendet wird (getrennt durch Leerzeichen oder Semikolon).
Overbought level — Überkauftes Niveau für Warnungen.
Oversold level — Überverkauftes Niveau für Warnungen.
Middle Level — Mittleres Niveau
Check alerts only on bar closing — Niveauüberschreitung nur nach Balkenschluss prüfen.
Entry into the OB-zone — Eintritt in die OB-Zone
Exit from the OB-zone — Austritt aus der OB-Zone
Entry into the OS-zone — Eintritt in die OS-Zone
Exit from the OS-zone — Austritt aus der OS-Zone
Middle level crossing Up — Übergang des mittleren Niveaus nach oben
Middle level crossing Down — Übergang des mittleren Niveaus nach unten
Alert when RSI direction changes — Alarm bei RSI-Richtungsänderung
All timeframes are Overbought/Oversold — Alle Zeitrahmen sind überkauft/überverkauft
All TFs exit OB/OS (previously all TFs were in this OB/OS) — Alle TFs verlassen OB/OS (zuvor befanden sich alle TFs in diesem OB/OS)
Pop up alert — Popup-Alarm.
Push notifications — Push-Benachrichtigung.
E-mail notifications — E-Mail-Benachrichtigung.
Sound alert — Tonalarm.


hello I have RSI dashboard and Stochastic dashbord. I need something for alert system. I really like your dashboards. But I need something more useful. If you can add it I will be very happy.. Example: When the RSI is over 70 on the H1 and at the same time The RSI is under the 30 on the M1 , Can be an alert for it ? When the RSI is under 30 on the H1 and at the same time The RSI is over the 70 on the M1 , Can be an alert for it ? I mean that when a timeframe is over 70 and the other timeframe is under 30 , there will be an alert for it