Fractal Divergence Channel
- Indikatoren
- Ihor Herasko
- Version: 140.517
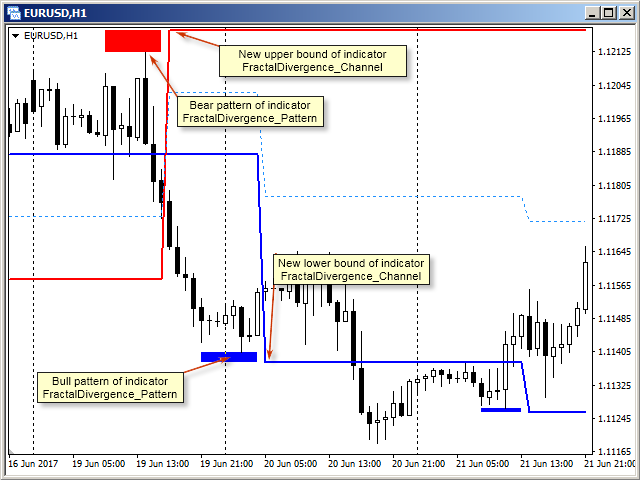
Fractal Divergence Channel is based on the fractal divergence patterns, representing them in the form of a channel with the borders changing the moment the next pattern appears. The upper border of the channel corresponds to the upper part of the last found bearish fractal divergence pattern. The lower border of the channel is the lower part of the last found bullish pattern (see screenshot 1).
Compared to the FractalDivergence_Patterns indicator, the channel version has the same parameters with addition of two:
- Alert on level breakdown? - an Alert window appears when the price breaks the upper or lower border of the channel. The next window will appear only when the opposite border is broken.
- Notification on level breakdown? - send notification to mobile devices when the price breaks the upper or lower border of the channel.
Representation of the fractal divergence in the form of a channel helps not only visually mark the level of the last two patterns (bullish and bearish), but also evaluate the current market trend:
- The market is in a flat. Channel with a normal relative position of the boundaries (the resistance level is above the support level), where the boundaries are successively approaching each other (see screenshot 2).
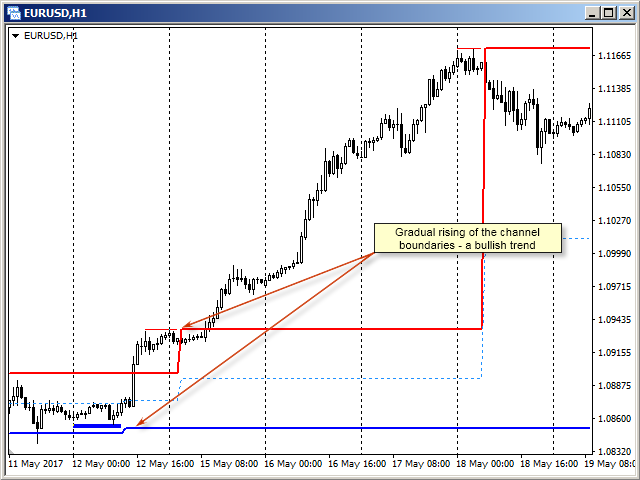
- Uptrend. Channel with relative position of the boundaries, where they are sequentially raised (see screenshot 3).
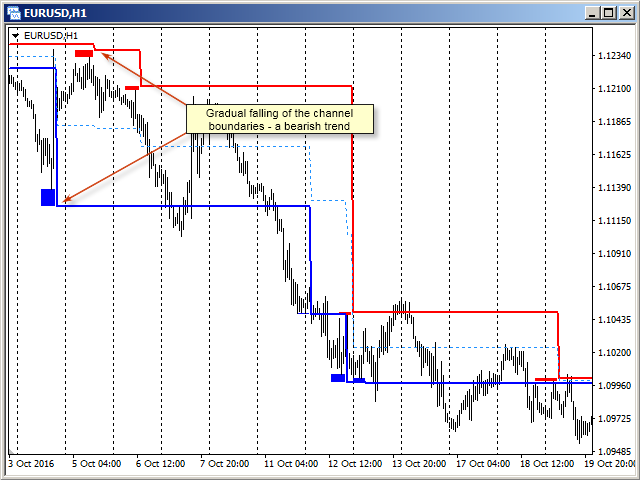
- Downtrend. Channel with relative position of the boundaries, where they are sequentially lowered (see screenshot 4).
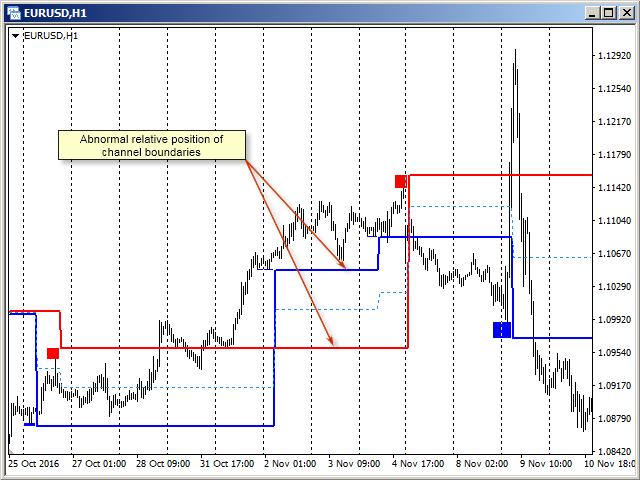
- Transitional state of the market. Channel with abnormal relative position of the boundaries (the support level is below the resistance level). It is impossible to say anything adequately about the state of the market. Such states often precede a change in the current trend, and therefore it is better to be out of the market at such times (see screenshot 5).

