Exchange Zone
- Indikatoren
- Igor Malcev
- Version: 1.0
- Aktivierungen: 5
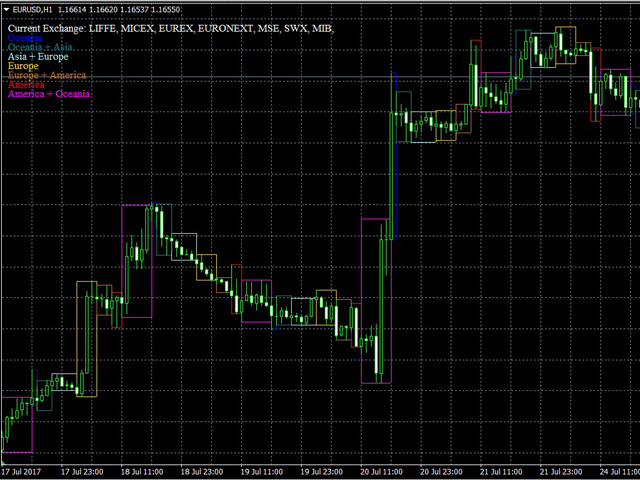
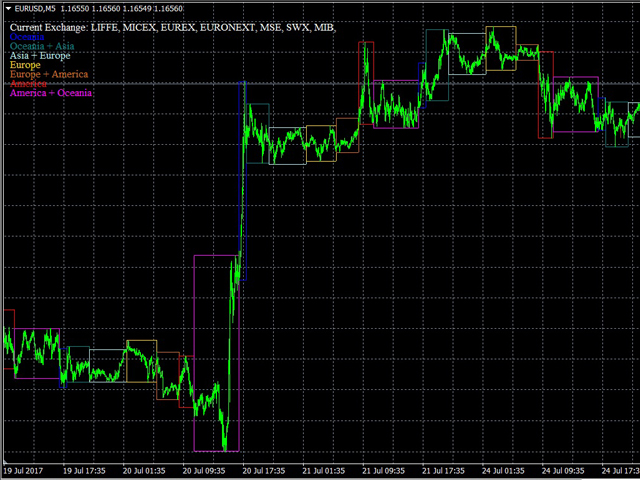
The ExchangeZone indicator displays the working time of the worldwide currency exchanges on the price chart.
It shows the stock exchanges operating at the moment.
The purpose of the indicator is to help trader prepare for the upcoming trade.
This indicator can be used for analyzing the volatility on a historical chart at the time of the work of different exchanges.
Such an analysis allows predicting the upcoming market dynamics and make appropriate decisions on buying or selling.
Indicator also facilitates searching for patterns on the market based on the past events, which had taken place during the operation of certain exchanges.
For example, the indicator clearly shows that the highest market activity occurs in the "America + Oceania" zone.
The sharp price rises and falls are observed in this zone the most.
Accordingly, traders need to be especially careful in this time zone.
This tool will be useful for most trading strategies, as it adds clarity to the time component of the price chart analysis.
The indicator works on timeframes from M1 to H1, on any currency pair.
Description of settings
- Depth_Bars - depth of display in history, in bars.
- TimeZone - time zone.
- locationX - location of the text labels on the chart along the X axis.
- locationY - location of the text labels on the chart along the Y axis.
- Cur_Exchange - color for the line that shows the operation of stock exchanges operating at a given time.
- Oceania - color of the time zone of the Oceania exchanges.
- Oceania_Asia - color of the time zone of the Oceania + Asia exchanges.
- Asia_Europe - color of the time zone of the Asia + Europe exchanges.
- Europe - color of the time zone of the Europe exchanges.
- Europe_America - color of the time zone of the Europe + America exchanges.
- America - color of the time zone of the America exchanges.
- America_Oceania - color of the time zone of the America + Oceania exchanges.


