• Übersicht
  • Bewertungen (44)
  • Diskussion (17)
  • Neue Funktionen

Classic Keltner Channel

4.87

Oder CKC.

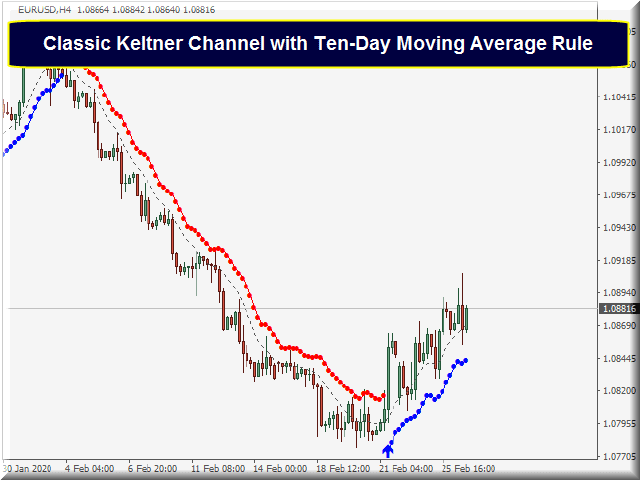
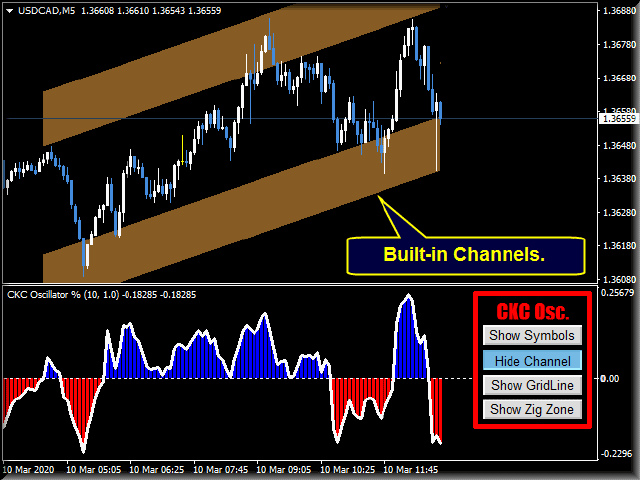
Dieser Indikator funktioniert in Abhängigkeit von der klassischen Zehn-Tage-Regel des gleitenden Durchschnitts, die von Chester W. Keltner (1909–1998) beschrieben wurde. Alle Parameter sind standardmäßig auf die klassische Version des Keltner-Systems eingestellt, während der Benutzer sie nach Belieben ändern kann.

Wichtige Informationen

    CKC-Handbuch lesen:https://www.mql5.com/en/blogs/post/736577
        CKC Expert Advisor Beispiel:https://www.mql5.com/en/blogs/post/734150


          Über die Keltner-Kanalformel

          1. Berechnen Sie die Mittellinie als einfachen gleitenden Durchschnitt aus dem typischen Preis (= (Hoch + Tief + Schluss) / 3).

          2. Berechnen Sie die durchschnittliche tägliche Spanne (ADR), die die durchschnittliche Differenz zwischen Hoch und Tief ist, mit dem gleichen Zeitraum und der gleichen Berechnungsmethode für die Mittellinie.

          3. Keltner Kauflinie = Mittellinie + ADR.

          4. Keltner Verkaufslinie = Mittellinie – ADR.


          Keltner 10-Tage-Regel des gleitenden Durchschnitts

          Die Keltner-Formel führt dazu, dass zwei grundlegende Linien auf dem Diagramm erstellt werden.

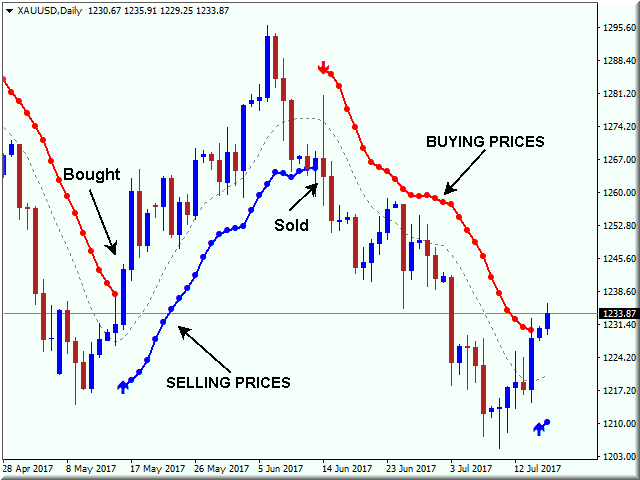
            1. Keltner Kauflinie.Dies ist die Linie, in der Sie Ihre Verkaufsposition decken und kaufen.

            2. Keltner Verkaufslinie.Dies ist die Linie, in der Sie Ihre Kaufposition decken und verkaufen.

              Durch die Verwendung dieser beiden Linien haben wir Handelsregeln erhalten, die auf dem in der technischen Analyse weit verbreiteten "Start and Reverse"-Prinzip basieren.

                1. Wenn die Preislinie über der Keltner-Kauflinie (der roten Linie) schließt, dann kaufen. Verwenden Sie die Keltner-Verkaufslinie (die blaue Linie) als Stopp und kehren Sie vom Kauf zum Verkauf um.

                2. Wenn die Preislinie unter der Keltner Sell Line (der blauen Linie) schließt, dann verkaufen. Verwenden Sie die Keltner-Kauflinie (die rote Linie) als Stopp und kehren Sie vom Verkauf zum Kauf um.

                  CKC-Funktionen

                    CKC zeichnet seine Ergebnisse nicht neu und berechnet sie auch nicht neu.

                    Es funktioniert auf Kryptowährungen, Aktien, Indizes, Öl, Gold und auf allen Zeitrahmen.

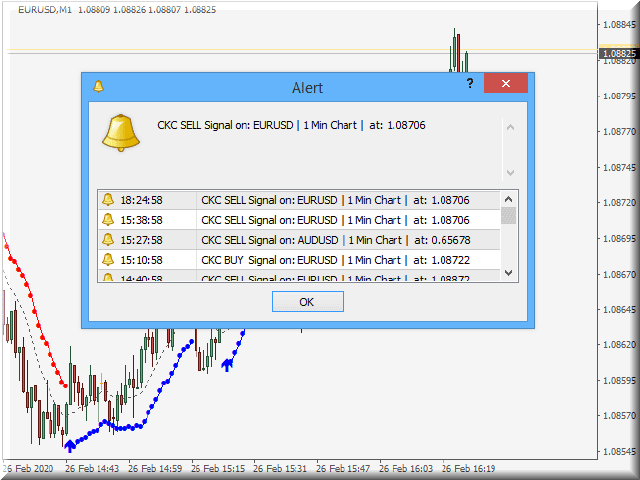
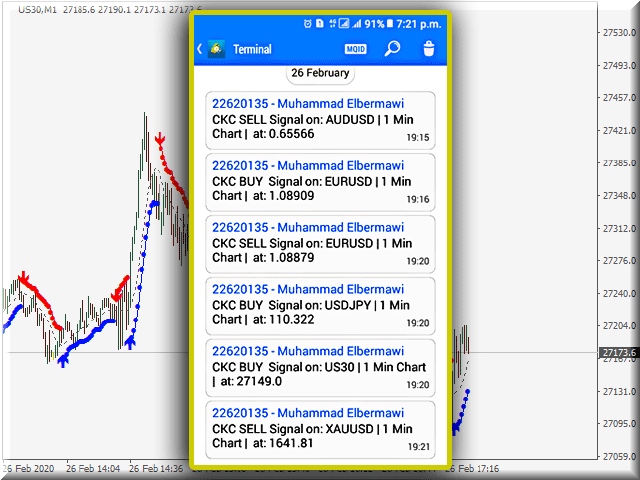
                    Ton, E-Mail-Benachrichtigungen und mobile Benachrichtigung.

                    Kaufen, verkaufen Sie Pfeile, um Trendsignale zu erkennen.

                    Gut gestaltete Parameter, die dem Benutzer helfen, leicht zwischen ihnen zu navigieren.

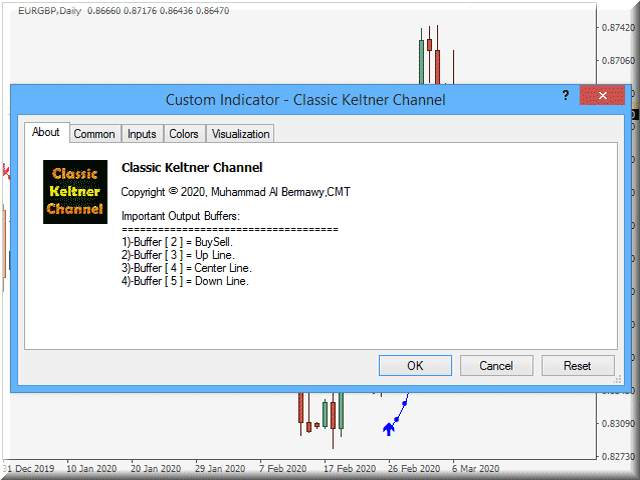
                    Puffer zum Aufbau eigener Fachberater.

                    Vier verschiedene Farblisten zur Auswahl.

                    CKC-Parameter

                    (1) ANZEIGEPARAMETER

                    • CKC-Kerzen.Die Anzahl der Kerzen, die in Bandberechnungen verwendet werden (Standard ist 10 Kerzen).
                    • CKC-Bereichsmultiplikator.Wie weit wird die Kauf-/Verkaufslinie von Keltner von ihrer Mittellinie getrennt (Standardwert ist 1,0).
                    • CKC-Methode des gleitenden Durchschnitts.Typ des gleitenden Durchschnitts, der in Berechnungen verwendet wird (einfacher gleitender Durchschnitt ist die Standardeinstellung).
                    • CKC angewandter Preis.Preis, der in Keltner-Mittellinienberechnungen verwendet wird (Typischer Preis ist die Standardeinstellung).

                    (2) WARNUNGEN

                    • Sirenenalarm.Wählen Sie aus, ob Sie den Warnton und die Nachricht verwenden oder stoppen möchten (Standard ist "true").
                    • E-Mail senden.Option zum Senden einer E-Mail an den Benutzer (Standard ist false).
                    • Senden Sie eine mobile Benachrichtigung.Option zum Senden einer mobilen Benachrichtigung an den Benutzer (Standard ist false).

                    (3) ANZEIGEART

                    • Liste der Diagrammfarben.Sie können zwischen vier verschiedenen Farblisten wählen (Standard ist Nichts tun).
                    • CKC obere Bandfarbe.Standard ist Rot.
                    • CKC untere Bandfarbe.Standard ist Blau.
                    • CKC-Breite.Standard ist eins.


                    Wenn Sie Fragen haben, kontaktieren Sie mich bitte über eine private Nachricht oder schreiben Sie diese in den Kommentarbereich.
                    Muhammad Al Bermaui, CMT


                    Bewertungen 44
                    udayan datta
                    843
                    udayan datta 2024.01.27 11:51 
                     

                    Indicator looks perfectly good and working fine, looking forward to learn it

                    Leroy Pastran
                    427
                    Leroy Pastran 2023.06.03 01:25 
                     

                    I started reading about the Keltner Channel and was surprised to see a simple yet effective indicator being sold/rented for a good price. I recently just rented the indicator and plan to test it out with my personal strategy. Thanks for creating this indicator!

                    davevicens
                    321
                    davevicens 2022.12.22 16:03 
                     

                    Very good indicator. , i use it together with bermaui bands . It´s amazing!!!!

                    Empfohlene Produkte
                    Fibonacci retracements can be used to draw support lines, identify resistance levels, place stop-loss orders and set target prices. The Advanced Automatic Fibonacci retracements draws automatically all the levels. You have a lot of options to choose. For exemple you can use the tracements of another time frame (MTF) in the current chart, you can also choose between the closest level or less close to draw the retracements. You can also add 2 levels of your choice. You can add levels extensions o
                    YK-Fibo Pivot Indicator: Trade Smarter with Fibonacci Pivot Points The YK-Fibo Pivot Indicator is a powerful technical analysis tool that combines the precision of Fibonacci retracements with the insights of Pivot Points. Whether you're a novice or seasoned trader, this indicator empowers you to spot profitable opportunities in the market with ease. Why Choose YK-Fibo Pivot? Pinpoint Support & Resistance: By calculating Fibonacci levels based on the previous day's high, low, and close prices, y
                    Classic Fractals indicator for MT4, with additional Trendlines connecting the latest couples of fractals ( fractals are showing highest high, and lowest low on each period) Rules for trendlines: -if new top fractal is below the last one = new resistance line -if new bot fractal is above the last one = new support line -Trendlines can be hidden -Fractals can be hidden Fractal Period = can be both even or uneven number, as it is setting for half (one side) of the bars sequence for findin
                    Koala Fibo Base Time
                    Ashkan Hazegh Nikrou
                    3 (1)
                    Willkommen zur Koala Fibo Base Time     Willkommen in der Koala Fibo Zeitzone     Willkommen bei Koala Fibo Time Extention     Willkommen bei Missed Tool For Meta Trade! Einfache Einführung: Fibonacci-Zeitzonen sind vertikale Linien, die auf der Fibonacci-Sequenz basieren. Diese Linien erstrecken sich entlang der X-Achse (Datumsachse) als Mechanismus zur Vorhersage von Umkehrungen basierend auf der verstrichenen Zeit. Als Ausgangspunkt wird häufig ein großes Tief oder Hoch gewählt. Die Entfe
                    FREE
                    The PUA MultiType Pivot indicator is built on the daily chart of the previous day. The PUA MultiType Pivot indicator is one of the most popular tools in technical analysis, used by traders to identify potential reversal points in financial markets. This indicator constructs three types of Pivot points: Classic, Fibonacci, and Camarilla, each offering its unique approach to market analysis. The advantages of this indicator include: Simplicity and Clarity PUA MultiType Pivot provides clearly defi
                    Der Morning Star PRT-Indikator verwendet das Morning Flat Breakout-Prinzip. Der Indikator zeigt Morning Flat-Levels und mögliche Ziele an. Dem Indikator wurde ein zusätzliches Fibonacci-Level hinzugefügt, sowie akustische Warnungen über den Schnittpunkt der beiden in den Einstellungen angegebenen Ziellevels und des Night Flat-Levels. Der Morning Star PRT-Indikator erstellt am Ende der Nacht einen Night Flat-Kanal sowie zwei Fibonacci-Preislevel nach oben und unten. Diese Levels können sowohl
                    The Penta-O is a 6-point retracement harmonacci pattern which usually precedes big market movements. Penta-O patterns can expand and repaint quite a bit. To make things easier this indicator implements a twist: it waits for a donchian breakout in the right direction before signaling the trade. The end result is an otherwise repainting indicator with a very reliable trading signal. The donchian breakout period is entered as an input. [ Installation Guide | Update Guide | Troubleshooting | FAQ | A
                    Der Trendfänger: Die Strategie des Trendfängers mit Alarmindikator ist ein vielseitiges technisches Analysewerkzeug, das Händlern hilft, Markttrends und potenzielle Ein- und Ausstiegspunkte zu identifizieren. Sie verfügt über eine dynamische Trendfängerstrategie, die sich den Marktbedingungen anpasst, um eine klare visuelle Darstellung der Trendrichtung zu ermöglichen. Händler können die Parameter an ihre Vorlieben und Risikotoleranz anpassen. Der Indikator hilft bei der Trendidentifikation, s
                    FREE
                    Unser Basic Support and Resistance Indikator ist die Lösung, die Sie für die Steigerung Ihrer technischen Analyse benötigen.Mit diesem Indikator können Sie Support- und Widerstandsebenen in der Tabelle projizieren/ MT5 -Version Funktionen Integration von Fibonacci -Ebenen: Mit der Option, Fibonacci -Werte neben Unterstützung und Widerstandsniveau anzuzeigen, gibt unser Indikator einen noch tieferen Einblick in das Marktverhalten und mögliche Umkehrbereiche. Leistungsoptimierung: Mit der Optio
                    Murrey Math Multi Timeframe Indicator Support/Resistance  Murrey Math Lines are strong tools to plot the support and resistance levels. Murrey Math Multi Timeframe Indicator draws multi timeframe MM lines on a smaller tf chart. General Information: According to Gann, prices move in 1/8's, these 1/8's act as points of price support and resistance as an entity's price changes in time. Given this 1/8 characteristic of price action, Murrey assigns properties to each of the MML's in an a given oc
                    Noize Absorption Index MT4
                    Ekaterina Saltykova
                    5 (1)
                    Noize Absorption Index - is the manual trading system that measures the difference of pressure between bears forces and bulls forces. Green line - is a noize free index that showing curent situation. Zero value of index shows totally choppy/flat market.Values above zero level shows how powerfull bullish wave is and values below zero measures bearish forces.Up arrow appears on bearish market when it's ready to reverse, dn arrow appears on weak bullish market, as a result of reverse expectation. S
                    Automatic fibonacci with alerts is an indicator that automatically plots a fibonacci retracement based on the number of bars you select on the BarsToScan setting in the indicator. The fibonacci is automatically updated in real time as new highest and lowest values appear amongst the selected bars. You can select which level values to be displayed in the indicator settings. You can also select the color of the levels thus enabling the trader to be able to attach the indicator several times with d
                    Free automatic Fibonacci is an indicator that automatically plots a Fibonacci retracement based on the number of bars you select on the BarsToScan setting in the indicator. The Fibonacci is automatically updated in real time as new highest and lowest values appears amongst the selected bars. You can select which level values to be displayed in the indicator settings. You can also select the color of the levels thus enabling the trader to be able to attach the indicator several times with differe
                    FREE
                    TWO PAIRS SQUARE HEDGE METER INDICATOR Try this brilliant 2 pairs square indicator It draws a square wave of the relation between your two inputs symbols when square wave indicates -1 then it is very great opportunity to SELL pair1 and BUY Pair2 when square wave indicates +1 then it is very great opportunity to BUY pair1 and SELL Pair2 the inputs are : 2 pairs of symbols         then index value : i use 20 for M30 charts ( you can try other values : 40/50 for M15 , : 30 for M30 , : 10 for H1 ,
                    Automatic redrawing of Trend Supports and resistances levels and Possible Wedge pattern formation to indicate price breaking of Rising Wedge (signal SELL) or price breaking of falling Wedge (signal BUY) Very simple and smart indicator  ALERTS AND MOBILE NOTIFICATIONS availavle !!! you can edit the calculation bars of the bars count for formation of the trend lines and the initial shift from current price  Smaller values for bars /shift inputs when using Higher Time frames (D1-H4) and the reverse
                    Are you tired of plotting fibonacci retracements or extensions manually? This indicator displays fibonacci retracements or extensions automatically, calculated from two different price points, without human intervention or manual object anchoring.  [ Installation Guide | Update Guide | Troubleshooting | FAQ | All Products ] Easy to use Manual anchoring is not needed Perfect for price confluence studies The indicator evaluates if retracements or extensions are needed Once drawn, you can manually
                    Daily Candle Predictor ist ein Indikator, der den Schlusskurs einer Kerze vorhersagt. Der Indikator ist in erster Linie für die Verwendung in D1-Charts gedacht. Dieser Indikator eignet sich sowohl für den traditionellen Devisenhandel als auch für den Handel mit binären Optionen. Der Indikator kann als eigenständiges Handelssystem oder als Ergänzung zu Ihrem bestehenden Handelssystem verwendet werden. Dieser Indikator analysiert die aktuelle Kerze und berechnet bestimmte Stärkefaktoren innerhalb
                    Cosmic Diviner X Planet
                    Olena Kondratenko
                    4 (2)
                    This unique multi-currency strategy simultaneously determines the strength of trends and market entry points, visualizing this using histograms on the chart. The indicator is optimally adapted for trading on the timeframes М5, М15, М30, Н1. For the convenience of users, the indicator renders the entry point (in the form of an arrow), recommended take profit levels (TP1, TP2 with text labels) and the recommended Stop Loss level. The take profit levels (TP1, TP2) are automatically calculated for
                    Blahtech Market Profile
                    Blahtech Limited
                    4.53 (15)
                    Was: $249  Now: $149   Market Profile defines a number of day types that can help the trader to determine market behaviour. A key feature is the Value Area, representing the range of price action where 70% of trading took place. Understanding the Value Area can give traders valuable insight into market direction and establish the higher odds trade. It is an excellent addition to any system you may be using. Blahtech Limited presents their Market Profile indicator for the MetaTrader community. In
                    The Th3Eng PipFinite indicator is based on a very excellent analysis of the right trend direction with perfect custom algorithms. It show the true direction and the best point to start trading. With StopLoss point and Three Take Profit points. Also it show the right pivot of the price and small points to order to replace the dynamic support and resistance channel, Which surrounds the price. And Finally it draws a very helpful Box on the left side on the chart includes (take profits and Stop loss
                    DMS Fibo
                    Diogo Mitsunaga Dos Santos
                    Fibonacci retracements are trend lines drawn between two significant points, usually between absolute lows and absolute highs, plotted on a chart. Intersecting horizontal lines are placed at the Fibonacci levels. Fibonacci retracements are useful tools that help traders identify support and resistance levels. With the information gathered, they can place orders, identify stop-loss levels, and set price targets. Although useful, traders often use other indicators to make more accurate assessments
                    Auto Fibo mq
                    DMITRII GRIDASOV
                    Der Crypto_Forex-Indikator „Auto FIBO“ ist ein großartiges Hilfstool beim Trading! - Der Indikator berechnet automatisch Fibo-Level und lokale Trendlinien (rote Farbe) und platziert sie im Chart. - Fibonacci-Level zeigen Schlüsselbereiche an, in denen der Preis umkehren kann. - Die wichtigsten Level sind 23,6 %, 38,2 %, 50 % und 61,8 %. - Sie können ihn für Reversal Scalping oder für Zone Grid Trading verwenden. - Es gibt auch viele Möglichkeiten, Ihr aktuelles System mit dem Auto FIBO-Indikat
                    This indicator prepared by using 57 days moving averagr and least square method. It can only work for 1 hr time interval. Once a signal created. It is creating order and 2 limit orders. It works in CFD pairs as well as in Forex pairs. You can fins our other products from link : https://www.mql5.com/en/users/drbastem/seller Also, you can ask all your questins from email : haskayafx@gmail.com or mobile : +90 530 867 5076 or @MehmetBastem on telegram application This system is for Long term and pr
                    VR Cub
                    Vladimir Pastushak
                    VR Cub ist ein Indikator für den Erhalt hochwertiger Einstiegspunkte. Der Indikator wurde entwickelt, um mathematische Berechnungen zu erleichtern und die Suche nach Einstiegspunkten in eine Position zu vereinfachen. Die Handelsstrategie, für die der Indikator geschrieben wurde, hat sich seit vielen Jahren bewährt. Ihr großer Vorteil liegt in der Einfachheit der Handelsstrategie, die es auch unerfahrenen Händlern ermöglicht, erfolgreich damit zu handeln. VR Cub berechnet Positionseröffnungspunkt
                    This is the FXTraderariel-TakeProfit - Stop Loss Indicator . It provides you 3 potential Take Profits and 1 Stop Loss. These potential targets are computed based on several methods . The indicator can be used on every time frame, but we advise to use it on H1, H4 and D1. Especially if you are a novice trader. Pro Traders can also you use it for scalping in smaller time frames (M1, M5 and M15). This indicator is not a complete trading system. It doesn't provide you a Signal nor can predict the m
                    Fibonacci SR Indicator This indicator creates support and resistance lines. This indicator is based on Fibonacci Retracement and Extension levels. It will consider many combinations of the Fibonacci levels and draw support/resistance lines based on these. This indicator uses tops and bottoms drawn by the ZigZag indicator in its calculations. The ZigZag can also be drawn on the chart, if necessary. The indicator considers many combinations of past reversal points and Fibonacci ratio levels, and w
                    FREE
                    FiboRec
                    Alfred Kamal
                    This indicator depends on Fibonacci lines but there is a secret lines i used them, by using FiboRec indicator you will be able to know a lot of important information in the market such as: Features You can avoid entry during market turbulence. You can enter orders in general trend only. You will know if the trend is strong or weak. Signal Types and Frame used You can use this indicator just on H1 frame. Enter buy order in case Candle break out the square area and closed over it, at least 20 pi
                    Super Reversal Pattern
                    Parfait Mujinga Ndalika
                    Super Reversal Pattern Indicator Unlock the power of advanced pattern recognition with our Super Reversal Pattern Indicator. Designed for traders seeking precision and reliability, this indicator identifies one of the most effective reversal patterns in technical analysis, offering a significant edge in your trading strategy. Key Features: Non-Repainting Accuracy: Enjoy the confidence of non-repainting technology. Once a Super Reversal Pattern is detected, it remains static, providing consiste
                    Stratos Pali
                    Michela Russo
                    5 (1)
                    Stratos Pali Indicator   is a revolutionary tool designed to enhance your trading strategy by accurately identifying market trends. This sophisticated indicator uses a unique algorithm to generate a complete histogram, which records when the trend is Long or Short. When a trend reversal occurs, an arrow appears, indicating the new direction of the trend. Important Information Revealed Leave a review and contact me via mql5 message to receive My Top 5 set files for Stratos Pali at no cost! Dow
                    Master Scalping M1 ist ein innovativer Indikator, der einen Algorithmus verwendet, um den Trend schnell und genau zu bestimmen. Der Indikator berechnet den Zeitpunkt zum Öffnen und Schließen von Positionen, die Indikatoralgorithmen ermöglichen es Ihnen, die idealen Zeitpunkte für den Einstieg in einen Handel (Kauf oder Verkauf eines Vermögenswerts) zu finden, was den Erfolg von Transaktionen für die meisten Händler erhöht. Vorteile des Indikators: Einfach zu bedienen, überladen Sie das Diagramm
                    Käufer dieses Produkts erwarben auch
                    Gann Made Easy
                    Oleg Rodin
                    4.81 (102)
                    Gann Made Easy ist ein professionelles und einfach zu bedienendes Forex-Handelssystem, das auf den besten Handelsprinzipien unter Verwendung der Theorie von Mr. basiert. W.D. Gann. Der Indikator liefert genaue KAUF- und VERKAUFSsignale, einschließlich Stop-Loss- und Take-Profit-Levels. Mit PUSH-Benachrichtigungen können Sie auch unterwegs handeln. Bitte kontaktieren Sie mich nach dem Kauf! Ich werde meine Handelstipps und tolle Bonusindikatoren kostenlos mit Ihnen teilen! Wahrscheinlich haben Si
                    FX Volume
                    Daniel Stein
                    4.59 (34)
                    FX Volume: Erleben Sie den echten Marktüberblick aus der Sicht eines Brokers Kurzüberblick Möchten Sie Ihre Handelsstrategie auf das nächste Level bringen? FX Volume liefert Ihnen Echtzeit-Einblicke in die Positionierung von Retail-Tradern und Brokern — lange bevor verzögerte Berichte wie der COT verfügbar sind. Ob Sie nach beständigen Gewinnen streben oder einfach einen tieferen Vorteil am Markt suchen, FX Volume hilft Ihnen, große Ungleichgewichte zu erkennen, Breakouts zu bestätigen und Ihr
                    Scalper Inside PRO
                    Alexey Minkov
                    4.75 (60)
                    !SPECIAL SALE!  An exclusive indicator that utilizes an innovative algorithm to swiftly and accurately determine the market trend. The indicator automatically calculates opening, closing, and profit levels, providing detailed trading statistics. With these features, you can choose the most appropriate trading instrument for the current market conditions. Additionally, you can easily integrate your own arrow indicators into Scalper Inside Pro to quickly evaluate their statistics and profitability
                    TPSproTREND PrO
                    Roman Podpora
                    4.79 (19)
                    TPSpro TREND PRO   ist ein Trendindikator, der den Markt automatisch analysiert und Informationen über den Trend und jede seiner Änderungen liefert sowie Signale für den Einstieg in Geschäfte ohne Neuzeichnung gibt! Der Indikator verwendet jede Kerze und analysiert sie separat. bezieht sich auf verschiedene Impulse – Aufwärts- oder Abwärtsimpuls. Exakte Einstiegspunkte in Transaktionen für Währungen, Krypto, Metalle, Aktien, Indizes! Version MT5                   VOLLSTÄNDIGE BESCHREIBUNG DES I
                    Golden Trend Indicator
                    Noha Mohamed Fathy Younes Badr
                    5 (8)
                    Golden Trend indicator  is The best indicator for predicting trend movement this indicator never lags and never repaints and never back paints    and give  arrow buy and sell    before the candle appear  and it will help you and  will make your trading decisions clearer its work on all currencies and  gold and crypto and all time frame This unique  indicator uses very secret algorithms to catch the  trends, so you can trade using this indicator and see the trend clear on charts  manual guide and
                    TPSpro RFI Levels
                    Roman Podpora
                    4.82 (22)
                    ANWEISUNGEN    Russland -    ENG    Die Empfehlung basiert auf dem Indikator -   TPSpro   TREND PRO -   Version MT5 Die wichtigsten Elemente in der Branche sind entweder in Zonen oder in der Fabrik enthalten, oder sie führen zu einer Lösung bei einem Kauf oder dem Verkauf eines anderen Instruments. Wenn viele Menschen ihre Rechte nicht auf dem Händlerkonto verschlüsseln, werden die Folgen nicht schnell genug sein. Ich habe es damit abgeschlossen, dass ich diese Folgen nun noch interpretieren un
                    Bei diesem Indikator handelt es sich um einen Indikator für die automatische Wellenanalyse, der sich perfekt für den praktischen Handel eignet! Fall... Hinweis:   Ich bin es nicht gewohnt, westliche Namen für die Welleneinstufung zu verwenden. Aufgrund des Einflusses der Namenskonvention von Tang Lun (Tang Zhong Shuo Zen) habe ich die Grundwelle als   Stift   und das sekundäre Wellenband als   Segment   bezeichnet Gleichzeitig hat das Segment die   Trendrichtung   benannt (diese Benennungsmeth
                    Dynamic Forex28 Navigator
                    Bernhard Schweigert
                    5 (4)
                    Dynamic Forex28 Navigator – Das Forex-Handelstool der nächsten Generation AKTUELL 49 % RABATT. Dynamic Forex28 Navigator ist die Weiterentwicklung unserer seit langem beliebten Indikatoren und vereint die Leistung von drei in einem: Advanced Currency Strength28 Indicator (695 Bewertungen) + Advanced Currency IMPULSE mit ALERT (520 Bewertungen) + CS28 Combo Signals (Bonus) Details zum Indikator https://www.mql5.com/en/blogs/post/758844 Was bietet der Strength Indicator der nächsten Generation?
                    Entry Points Pro
                    Yury Orlov
                    4.61 (169)
                    Dies ist ein Indikator für MT4, der genaue Signale für den Einstieg in einen Handel ohne Repainting (Neuzeichnen) liefert. Er kann auf alle Finanzwerte angewendet werden: Forex, Kryptowährungen, Metalle, Aktien, Indizes. Er liefert ziemlich genaue Schätzungen und sagt Ihnen, wann es am besten ist, eine Position zu eröffnen und zu schließen. Sehen Sie sich das Video (6:22) mit einem Beispiel für die Verarbeitung nur eines Signals an, das sich für den Indikator gelohnt hat! Die meisten Händler ver
                    GOLD Impulse with Alert
                    Bernhard Schweigert
                    4.6 (10)
                    Dieser Indikator ist eine hervorragende Kombination aus unseren 2 Produkten Advanced Currency IMPULSE with ALERT  +   Currency Strength Exotics . Es funktioniert für alle Zeitrahmen und zeigt grafisch Impulse der Stärke oder Schwäche für die 8 wichtigsten Währungen plus ein Symbol! Dieser Indikator ist darauf spezialisiert, die Beschleunigung der Währungsstärke für beliebige Symbole wie Gold, Exotische Paare, Rohstoffe, Indizes oder Futures anzuzeigen. Als erster seiner Art kann jedes Symbol
                    Scalper Vault
                    Oleg Rodin
                    5 (27)
                    Scalper Vault ist ein professionelles Scalping-System, das Ihnen alles bietet, was Sie für erfolgreiches Scalping benötigen. Dieser Indikator ist ein komplettes Handelssystem, das von Forex- und Binäroptionshändlern verwendet werden kann. Der empfohlene Zeitrahmen ist M5. Das System liefert Ihnen genaue Pfeilsignale in Richtung des Trends. Es liefert Ihnen auch Top- und Bottom-Signale und Gann-Marktniveaus. Die Indikatoren bieten alle Arten von Warnungen, einschließlich PUSH-Benachrichtigungen.
                    Advanced Supply Demand
                    Bernhard Schweigert
                    4.91 (294)
                    Derzeit 33% Rabatt! Die beste Lösung für jeden Anfänger oder erfahrenen Händler! Dieser Indikator ist ein einzigartiges, qualitativ hochwertiges und erschwingliches Trading-Tool, da wir eine Reihe von proprietären Funktionen und eine neue Formel integriert haben. Mit diesem Update werden Sie in der Lage sein, doppelte Zeitrahmenzonen anzuzeigen. Sie können nicht nur einen höheren TF (Zeitrahmen) anzeigen, sondern sowohl den Chart-TF als auch den höheren TF: SHOWING NESTED ZONES. Alle Supply Dema
                    Easy Breakout
                    Mohamed Hassan
                    5 (8)
                    4 copies left before price increases to $120! After your purchase, feel free to contact me for more details on how to receive a bonus indicator called VFI, which pairs perfectly with Easy Breakout for enhanced confluence!   Easy Breakout is a powerful price action trading system built on one of the most popular and widely trusted strategies among traders: the Breakout strategy ! This indicator delivers crystal-clear Buy and Sell signals based on breakouts from key support and resistance zone
                    Currency Strength Exotics
                    Bernhard Schweigert
                    4.87 (31)
                    Stärke von 8 Währungen plus EIN EXOTISCHES Paar oder Rohstoffe oder Indexe! Jedes Produkt kann als 9. Linie hinzugefügt werden. Fügen Sie Rohstoffe, Indexes oder exotische Währungen hinzu (Gold, Silber, Öl, DAX, US30, MXN, TRY, CNH ...). Eine neue noch nie dagewesene TRADING STRATEGIE  !!! Dieser Indikator ist einzigartig, weil wir eine Reihe von proprietäre Funktionen und neue Formeln eingebaut haben. Es funktioniert für alle Zeitrahmen. Basierend auf neuen zugrunde liegenden Algorithmen ist e
                    Hinterlassen Sie nach dem Kauf einen Kommentar, um 4 hochwertige Indikatoren als Bonus zu erhalten. Der Chart Patterns All-in-One Indikator hilft Tradern, verschiedene Chartmuster, die häufig in der technischen Analyse verwendet werden, zu visualisieren. Dieser Indikator unterstützt die Identifizierung möglicher Marktbewegungen, garantiert jedoch keine Rentabilität. Es wird empfohlen, den Indikator vor dem Kauf im Demomodus zu testen. Aktuelles Angebot : 50 % Rabatt auf den "Chart Patterns All i
                    TrendMaestro
                    Stefano Frisetti
                    5 (3)
                    note: this indicator is for METATRADER4, if you want the version for METATRADER5 this is the link:  https://www.mql5.com/it/market/product/108106 TRENDMAESTRO ver 2.4 TRENDMAESTRO recognizes a new TREND in the bud, he never makes mistakes. The certainty of identifying a new TREND is priceless. DESCRIPTION TRENDMAESTRO identifies a new TREND in the bud, this indicator examines the volatility, volumes and momentum to identify the moment in which there is an explosion of one or more of these data a
                    Owl smart levels
                    Sergey Ermolov
                    4.34 (35)
                    MT5-Version  |  FAQ Der   Owl Smart Levels Indikator   ist ein komplettes Handelssystem innerhalb eines Indikators, der so beliebte Marktanalysetools wie die   fortschrittlichen Fraktale von Bill Williams , Valable ZigZag, das die   richtige Wellenstruktur   des Marktes aufbaut, und   Fibonacci-Levels , die die genauen Einstiegslevels markieren, enthält in den Markt und Orte, um Gewinne mitzunehmen. Detaillierte Strategiebeschreibung Anleitung zur Verwendung des Indikators Berater-Assistent im
                    DERZEIT 31% RABATT! Die beste Lösung für jeden Newbie oder Expert Trader! Dieser Indikator ist ein einzigartiges, qualitativ hochwertiges und erschwingliches Handelsinstrument, da wir eine Reihe von proprietären Funktionen und eine geheime Formel eingebaut haben. Mit nur EINEM Chart liefert er Alerts für alle 28 Währungspaare. Stellen Sie sich vor, wie sich Ihr Handel verbessern wird, weil Sie in der Lage sind, den genauen Auslösepunkt eines neuen Trends oder einer Scalping-Gelegenheit zu erk
                    PRO Renko System ist ein hochpräzises Handelssystem, das speziell für den Handel mit RENKO-Charts entwickelt wurde. Dies ist ein universelles System, das auf verschiedene Handelsinstrumente angewendet werden kann. Das System neutralisiert effektiv so genannte Marktgeräusche, die Ihnen Zugang zu genauen Umkehrsignalen geben. Der Indikator ist sehr einfach zu bedienen und hat nur einen Parameter, der für die Signalerzeugung verantwortlich ist. Sie können das Tool einfach an jedes Handelsinstrum
                    DynamicCOG Mt4
                    Justine Kelechi Ekweh
                    Dynamic Center of Gravity Indicator Revolutionary Price Action Trading System Harness the power of price momentum with the Dynamic Center of Gravity indicator - an advanced price action trading tool designed for serious traders. This innovative indicator identifies powerful gravity zones that attract rapid price movements, creating high-probability trading opportunities when momentum breaks free from these zones. Key Features Pure price action analysis - no lagging indicators Works effectively a
                    MetaForecast M4
                    Vahidreza Heidar Gholami
                    5 (2)
                    MetaForecast prognostiziert und visualisiert die Zukunft eines beliebigen Marktes basierend auf den Harmonien in den Preisdaten. Obwohl der Markt nicht immer vorhersehbar ist, kann MetaForecast, wenn es ein Muster im Preis gibt, die Zukunft so genau wie möglich voraussagen. Im Vergleich zu ähnlichen Produkten kann MetaForecast durch die Analyse von Markttrends genauere Ergebnisse erzeugen. Eingabeparameter Past size (Vergangene Größe) Gibt an, wie viele Balken MetaForecast verwendet, um ein Mod
                    RelicusRoad Pro
                    Relicus LLC
                    4.64 (102)
                    Jetzt 147 US -Dollar (nach ein paar Aktualisierungen auf 499 US -Dollar) - Unbegrenzte Konten (PCs oder MACs) RelicusRoad Benutzerhandbuch + Schulungsvideos + Zugang zur privaten Discord-Gruppe + VIP-Status EINE NEUE ART, DEN MARKT ZU BETRACHTEN RelicusRoad ist der weltweit leistungsstärkste Handelsindikator für Forex, Futures, Kryptowährungen, Aktien und Indizes und gibt Händlern alle Informationen und Tools, die sie benötigen, um profitabel zu bleiben. Wir bieten technische Analysen und Ha
                    Legacy of Gann
                    Pavel Zamoshnikov
                    4.83 (12)
                    The indicator very accurately determines the levels of the possible end of the trend and profit fixing. The method of determining levels is based on the ideas of W.D.Gann, using an algorithm developed by his follower Kirill Borovsky. Extremely high reliability of reaching levels (according to K. Borovsky  - 80-90%) Indispensable for any trading strategy – every trader needs to determine the exit point from the market! Precisely determines targets on any timeframes and any instruments (forex, met
                    MetaBands M4
                    Vahidreza Heidar Gholami
                    5 (3)
                    MetaBands verwendet leistungsstarke und einzigartige Algorithmen, um Kanäle zu zeichnen und Trends zu erkennen, sodass es Tradern potenzielle Punkte für den Einstieg und Ausstieg aus Trades bieten kann. Es ist ein Kanalindikator sowie ein leistungsstarker Trendindikator. Es umfasst verschiedene Arten von Kanälen, die einfach durch Verwendung der Eingabeparameter zusammengeführt werden können. MetaBands verwendet alle Arten von Warnmeldungen, um Benutzer über Marktereignisse zu informieren. Funkt
                    Blahtech Supply Demand
                    Blahtech Limited
                    4.61 (33)
                    Was: $299  Now: $149   Supply Demand uses previous price action to identify potential imbalances between buyers and sellers. The key is to identify the better odds zones, not just the untouched ones. Blahtech Supply Demand indicator delivers functionality previously unavailable on any trading platform. This 4-in-1 indicator not only highlights the higher probability zones using a multi-criteria strength engine, but also combines it with multi-timeframe trend analysis, previously confirmed swings
                    Volume by Price MT4
                    Brian Collard
                    4.64 (11)
                    The Volume by Price Indicator for MetaTrader 4 features Volume Profile and Market Profile TPO (Time Price Opportunity). Volume and TPO histogram bar and line charts. Volume Footprint charts. TPO letter and block marker collapsed and split structure charts. Static, dynamic and flexible range segmentation and compositing methods with relative and absolute visualizations. Session hours filtering and segment concatenation with Market Watch and custom user specifications. Graphical layering, positio
                    FX Gunslinger
                    Oleg Rodin
                    5 (2)
                    Forex Gunslinger ist ein KAUF/VERKAUF-Umkehrsignalindikator, der auf der Idee basiert, Unterstützung/Widerstand, Überkreuzungen und Oszillatoren im MTF-Modus zu kombinieren. Wenn alles ausgerichtet ist, generiert der Indikator ein KAUF- oder VERKAUFSsignal. Obwohl der Indikator auf der MTF-Idee basiert, ist der Algorithmus sehr stabil und generiert zuverlässige Umkehrsignale. Dies ist ein Indikator vom Typ MTF, bei dem ein höherer oder niedrigerer Zeitrahmen zur Berechnung der Signale für Ihr ak
                    CyberZingFx Volume Plus
                    Afsal Meerankutty
                    4.93 (15)
                    Advanced version of CyberZingFx Volume Plus, the ultimate MT4 indicator for traders seeking highly accurate buy and sell signals. With an additional strategy and price action dot signals that enhances its effectiveness, this indicator offers a superior trading experience for professionals and beginners alike. The CyberZingFx Volume Plus Advanced version combines the power of volume analysis and historical price data with an additional strategy, resulting in even more precise and reliable signals
                    Derzeit 20% Rabatt! Die beste Lösung für jeden Neueinsteiger oder Expert Händler! Dieses Dashboard arbeitet mit 28 Währungspaaren. Es basiert auf 2 unserer Hauptindikatoren (Advanced Currency Strength 28 und Advanced Currency Impulse). Es bietet einen hervorragenden Überblick über den gesamten Forex-Markt. Es zeigt die Werte der Advanced Currency Strength, die Veränderungsrate der Währungen und die Signale für 28 Devisenpaare in allen (9) Zeitrahmen. Stellen Sie sich vor, wie sich Ihr Handel
                    Order Block Hunter
                    Noha Mohamed Fathy Younes Badr
                    5 (9)
                    Order block hunter indicator is the best indicator for  hunt the order blocks that area where there has been a large concentration of limit orders waiting to be executed Order blocks are identified on a chart by observing previous price action and looking for areas where the price experienced significant movement or sudden changes in direction .This indicator does that for you by using very complicated codes and helps you to take the best areas To buy and sell because it make marks at the best a
                    Weitere Produkte dieses Autors
                    Berma Bands
                    Muhammad Elbermawi
                    5 (3)
                    The Berma Bands (BBs) indicator is a valuable tool for traders seeking to identify and capitalize on market trends. By analyzing the relationship between the price and the BBs, traders can discern whether a market is in a trending or ranging phase. Berma Bands are composed of three distinct lines: the Upper Berma Band, the Middle Berma Band, and the Lower Berma Band. These lines are plotted around the price, creating a visual representation of the price movement relative to the overall trend. T
                    Bermaui Deviation Percent
                    Muhammad Elbermawi
                    4.94 (111)
                    Oder (BD%), ein Volatilitätsindex, der die Volatilität in Prozent statt in Punkten misst. Die Idee von BD% besteht darin, einen Index in Abhängigkeit von der Classic Standard Deviation (CSD) zu erstellen, die sich zwischen 0 und 100 Prozent bewegt. Sie können BD% verwenden, um die Volatilität für dasselbe Wertpapier in verschiedenen Zeiträumen oder Zeitrahmen zu vergleichen. Darüber hinaus können Sie BD% verwenden, um die Volatilität zwischen verschiedenen Wertpapieren in verschiedenen Märkten
                    MASR Bands
                    Muhammad Elbermawi
                    5 (5)
                    Oder M Oving A verage S upport R eständigkeit Bands. Der MASR-Bänder-Indikator ist ein gleitender Durchschnitt, der von zwei Bändern umgeben ist, die als Unterstützungs- und Widerstandsniveaus zusammenarbeiten. Statistisch enthalten MASR-Bänder in 93% der Fälle Preiskerzen. So wird es in Schritten berechnet: 1. Der erste Schritt besteht darin, das höchste Hoch (HHV) und das niedrigste Tief (LLV) für einen Zeitraum von X zu berechnen. 2. Der zweite Schritt besteht darin, HHV durch LLV zu teil
                    True Direction Oscillator
                    Muhammad Elbermawi
                    4.86 (359)
                    Oder (TDO), ein Index, der die Preisänderungsrate nach dem Prinzip des „ Pure Momentum “ misst. Wenn ein Wertpapierkurs von 10 auf 15 steigt, beträgt die Preisänderungsrate 150%, aber wenn er von 15 auf 10 zurückgeht, beträgt die Preisänderungsrate nur 33,3%. Aus diesem Grund liefern Indikatoren der technischen Analyse wie "Price Rate of Change" (ROC) oder "Momentum" höhere Werte für aufsteigende Kursbewegungen als solche für absteigende. TDO behebt dieses Problem, um Händlern zu helfen, das Mom
                    Bermaui Bands
                    Muhammad Elbermawi
                    4.97 (67)
                    Bermaui Bands (BB) ist ein technisches Analysetool, das dabei hilft, zwischen Bereichs- und Trendkursbewegungen zu filtern. Die Idee hinter diesem Indikator lässt sich in den nächsten Schritten erklären: Berechnen Sie die Standardabweichung als Oszillator, der sich zwischen 0 und 100 bewegt. Ich nenne sie Bermaui-Abweichung in Prozent (BD %). Wenn "BD %" nahe Null ist, ist die Volatilität am höchsten. Außerdem ist die Volatilität sehr gering, wenn "BD %" nahe 100 liegt. Hohe Volatilität bedeutet
                    Bermaui RSI Candles
                    Muhammad Elbermawi
                    5 (4)
                    Die Idee dieses Indikators besteht darin, den RSI in Form von Kerzen zu zeichnen, die mit Preischarts verglichen werden können, um Kauf- und Verkaufssignale zu generieren. Der Indikator ist nicht meine Erfindung. Ich habe es vor einigen Jahren im Internet gegründet. Ich habe den Code aktualisiert, Warnfunktionen hinzugefügt und die Bermaui Utilities-Toolgruppe hinzugefügt. Der Indikator berechnet den RSI aller Kurse, die zum Zeichnen von Kerzen verwendet werden (RSI des Eröffnungs-, Hoch-, Tief
                    Bermaui Channel
                    Muhammad Elbermawi
                    5 (19)
                    This is a price channel that shows five important price levels on the chart. Those levels are: 1. The Highest High (HH) of the previous x bars. 2. The Highest Low (HL) of the previous x bars. 3. The Center Line. 4. The Lowest High (LH) of the previous x bars. 5. The Lowest Low (LL) of the previous x bars. How does Bermaui Channels Captures Overbought  area Think of the distance between HH and HL levels as an overbought area. When the price candles or bars crosses the HL to the upside this indica
                    Moving Average Cloud
                    Muhammad Elbermawi
                    4.92 (13)
                    Oder "MAC". Dies ist ein Indikator, der Ihnen helfen soll, den Trend zu erfassen und zu handeln. Die Idee hinter diesem Indikator lässt sich in den nächsten Schritten erklären: Zeichnen Sie eine sich schnell bewegende durchschnittliche Hüllkurve. Zeichnen Sie eine sich langsam bewegende durchschnittliche Hüllkurve. Das MAC Upper Band ist der höchste Wert zwischen den Höhen beider Hüllkurven. Das MAC Lower Band ist der niedrigste Wert zwischen den Tiefstwerten beider Hüllkurven. Die MAC Histogra
                    Bermaui Pin Bars
                    Muhammad Elbermawi
                    5 (13)
                    Bermaui Pin Bars Oder (BPB) ist ein Indikator, der das Preisaktionsmuster von Pin Bars auf dem Chart findet. Pin Bars ist eine Abkürzung für "Pinocchio Bars", eine klassische Balkenmuster-Alternative zu japanischen Kerzenhaltern mit hohen oberen oder unteren Schatten und sehr kleinen Körpern wie Hammer, Inverted-Hammer, Hanging Man, Shooting Star, Dragon Fly Doji oder Grave Stone Doji . Bermaui Pin Bars Indikator findet dieses Muster abhängig von einer Formel, die in den nächsten Schritten erkl
                    Bermaui Manual EA
                    Muhammad Elbermawi
                    5 (10)
                    Dies ist ein halbautomatischer Fachberater, der das Netzsystem handelt. Die Idee ist, nach und nach verschiedene Positionen im Markt einzunehmen und dann den Break-Even-Level für sie zu berechnen. Wenn die Kurse diesen Break-Even um eine vorbestimmte Distanz überschreiten, werden alle geöffneten Orders geschlossen. Wichtige Informationen Hier ist die Bedienungsanleitung:   https://www.mql5.com/de/blogs/post/730567 Sie können diesen EA mit jedem meiner anderen Produkte hier ausprobieren: https:/
                    Auswahl:
                    udayan datta
                    843
                    udayan datta 2024.01.27 11:51 
                     

                    Indicator looks perfectly good and working fine, looking forward to learn it

                    Leroy Pastran
                    427
                    Leroy Pastran 2023.06.03 01:25 
                     

                    I started reading about the Keltner Channel and was surprised to see a simple yet effective indicator being sold/rented for a good price. I recently just rented the indicator and plan to test it out with my personal strategy. Thanks for creating this indicator!

                    elite luis
                    3351
                    elite luis 2023.03.06 14:06 
                     

                    Der Benutzer hat keinen Kommentar hinterlassen

                    davevicens
                    321
                    davevicens 2022.12.22 16:03 
                     

                    Very good indicator. , i use it together with bermaui bands . It´s amazing!!!!

                    Thin Vu Xuan
                    275
                    Thin Vu Xuan 2022.12.07 03:06 
                     

                    Good

                    prim forex
                    91
                    prim forex 2022.11.03 02:43 
                     

                    To be honest, I like the indicaor best now. It was no too difficult until start Mekong pips. Highly recommended.

                    Muhammad Elbermawi
                    52685
                    Antwort vom Entwickler Muhammad Elbermawi 2022.11.03 05:04
                    Thanks, Hiro Koyama
                    mrkaib
                    1079
                    mrkaib 2022.10.13 19:33 
                     

                    very good indicator

                    luis066
                    29
                    luis066 2022.09.03 20:38 
                     

                    this is a great product, i use it together with bermaui bands and i always have the correct view of the market. low price and a lot of quality.

                    awasthisp
                    784
                    awasthisp 2022.08.23 13:27 
                     

                    No doubt about his software's result and grade . Previous to this i have already purchased and rented his maximum software nothing doubt about any thing.

                    rodbizness
                    84
                    rodbizness 2022.06.11 01:20 
                     

                    Muhammad, thank you so much for the Big Job.

                    deimy
                    563
                    deimy 2022.04.15 00:55 
                     

                    Very good indicator, thank you

                    Doctornoob
                    329
                    Doctornoob 2022.03.25 22:44 
                     

                    good addition to my trading

                    yellowplus2009
                    262
                    yellowplus2009 2022.03.19 10:22 
                     

                    Great product.Highly recommended indicator.

                    moayad alhadidid
                    33
                    moayad alhadidid 2022.02.16 13:33 
                     

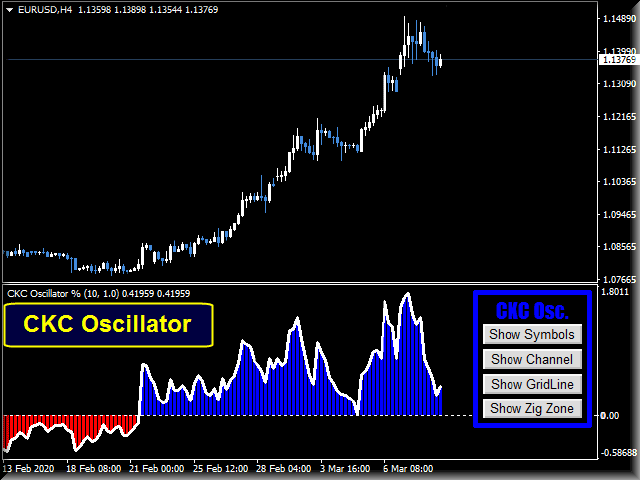
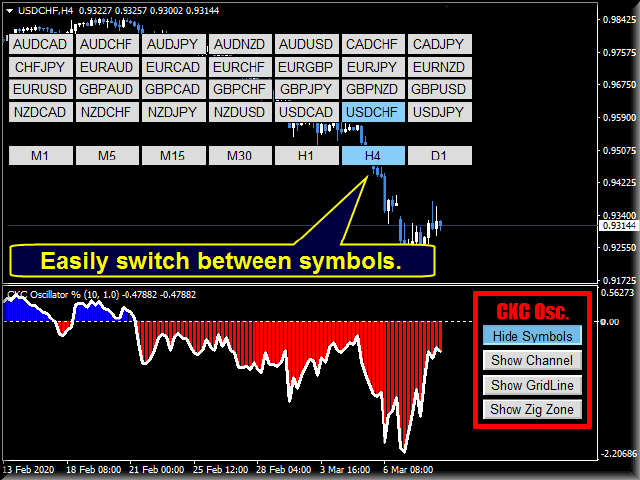
                    I bought the product for a month to try it, and the CKC oscillator did not appear

                    Muhammad Elbermawi
                    52685
                    Antwort vom Entwickler Muhammad Elbermawi 2022.03.18 17:45
                    If there is any problem then why didn't you contact me?!
                    OLADIMEJI ADEBAJO IWALESIN
                    4144
                    OLADIMEJI ADEBAJO IWALESIN 2022.01.27 06:52 
                     

                    Der Benutzer hat keinen Kommentar hinterlassen

                    ck15220
                    714
                    ck15220 2021.10.18 15:39 
                     

                    Very good indicators make me make a lot of profits. Thank you

                    Muhammad Elbermawi
                    52685
                    Antwort vom Entwickler Muhammad Elbermawi 2021.10.18 18:07
                    Thanks, my friend. I appreciate it. 🙏💚
                    adonis4ex
                    6341
                    adonis4ex 2021.10.01 03:26 
                     

                    Der Benutzer hat keinen Kommentar hinterlassen

                    Muhammad Elbermawi
                    52685
                    Antwort vom Entwickler Muhammad Elbermawi 2021.10.02 08:38
                    Thanks, Adonis. I appreciate it. 🙏💚
                    Johnny Long
                    99
                    Johnny Long 2021.09.27 14:54 
                     

                    the product and the author is great!

                    Muhammad Elbermawi
                    52685
                    Antwort vom Entwickler Muhammad Elbermawi 2021.10.01 09:10
                    Thanks 🙏💚
                    James Wioos
                    412
                    James Wioos 2021.08.16 18:07 
                     

                    Der Benutzer hat keinen Kommentar hinterlassen

                    Muhammad Elbermawi
                    52685
                    Antwort vom Entwickler Muhammad Elbermawi 2021.08.16 22:23
                    🙏 Thanks a lot for your trust, James. ✅ I hope that you enjoy all the trading examples on the telegram channel:
                    https://t.me/BermauiChannel
                    ambho
                    112
                    ambho 2021.07.05 20:32 
                     

                    Good service and indicator

                    Muhammad Elbermawi
                    52685
                    Antwort vom Entwickler Muhammad Elbermawi 2021.08.06 21:48
                    Thanks for the great review and stars 🙏💚
                    You can join my telegram group from here:
                    https://t.me/BermauiChannel
                    123
                    Antwort auf eine Rezension
                    Version 2.2 2020.03.08
                    Added a buffer for Signals to make it easy for developers to use the indicator in building expert advisors.

                    The new buffer is no. 2. It is called "BuySell". It works Like this:
                    1) If BuySell = +1 then buy
                    2) If BuySell = -1 then Sell
                    Version 2.1 2020.03.02
                    Added an icon to the description.
                    Version 2.0 2020.02.26
                    1. Enhanced the calculation method.
                    2. Added color lists, for a better chart view.
                    3. Enhanced all the alerts.
                    4. Arranged the inputs to be more user friendly.
                    5. Added buffers to indicator description.
                    .
                    Note:

                    I didn't make any changes on CKC basic formula. It is still the same.
                    I didn't make any changes in the indicator buffers.