Higher Low and Lower High Breakout Dashboard
- Indikatoren
- Matthew Chan
- Version: 1.3
- Aktualisiert: 12 Oktober 2017
- Aktivierungen: 10
Description & Summary
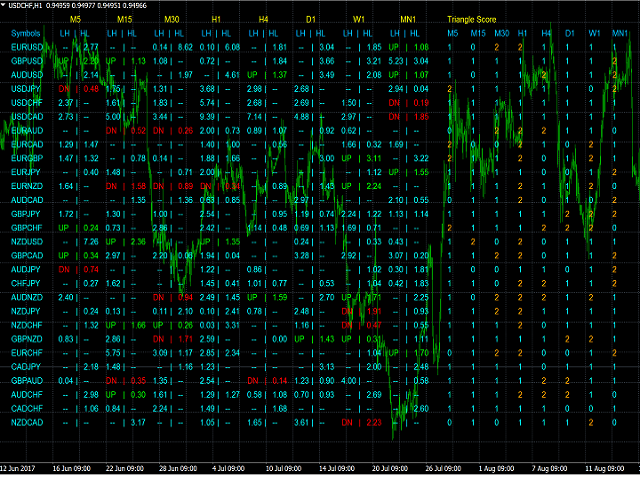
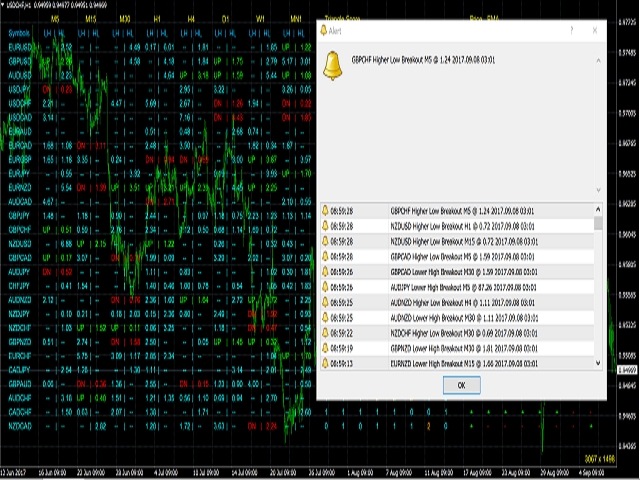
Dashboard to detect Higher-Low/Lower-High breakouts and Triangle Patterns on 28 currency pairs and up to 8 timeframes at once.
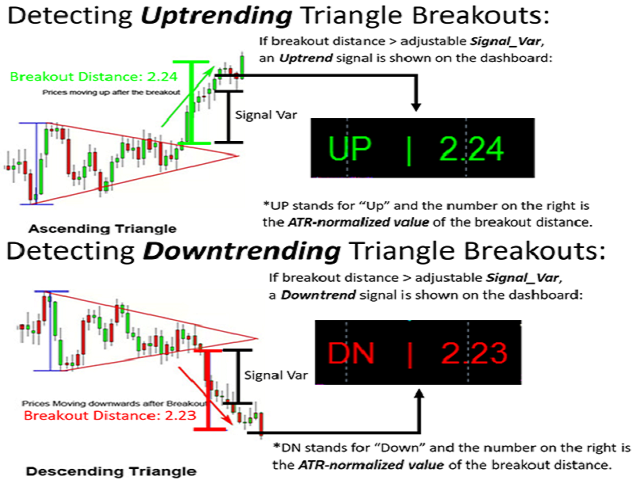
Numbers on the left are the normalized values of distance between price and last Lower-High and Higher-Low if one has formed (displays "--" if none). Text will turn Red upon a Higher-Low Breakout and Green upon a Lower-High Breakout if the breakout distance is greater than that timeframe's Signal_Var extern variable.
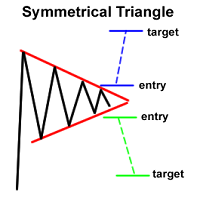
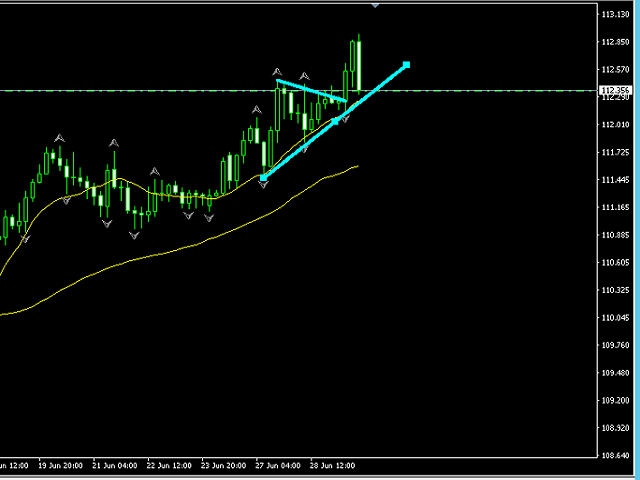
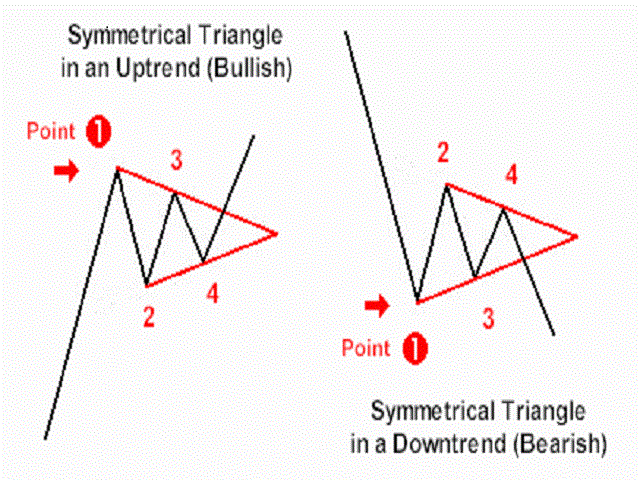
The middle columns display each timeframe and symbol's "Triangle Score" - a score of 2 means a triangle pattern has formed (see screenshots for more details).
The right columns display if the price is above or below an EMA of configurable time period (extern variable EMA_Period).
Configurable Parameters
- X_Signal_Var: the minimum distance price has to go above a recent Lower-High or below a Higher-Low to display a red or green signal on X timeframe.
- Show_M5/M15/M30/H1/H4/D1/W1/MN1: Show columns for the selected timeframe.
- EMA_Period: Set the period of the EMA for the columns on the right.
- The indicator colors are the colors of the labels and columns.
- Safe_Mode: Run the indicator in "safe mode", avoiding symbols and timeframes that might be missing data.












Good